Weakening Crop Prices and High Production Costs Weigh on Farmer Sentiment

Source: James Mintert and Michael Langemeier, Purdue Center for Commercial Agriculture

Click here to listen

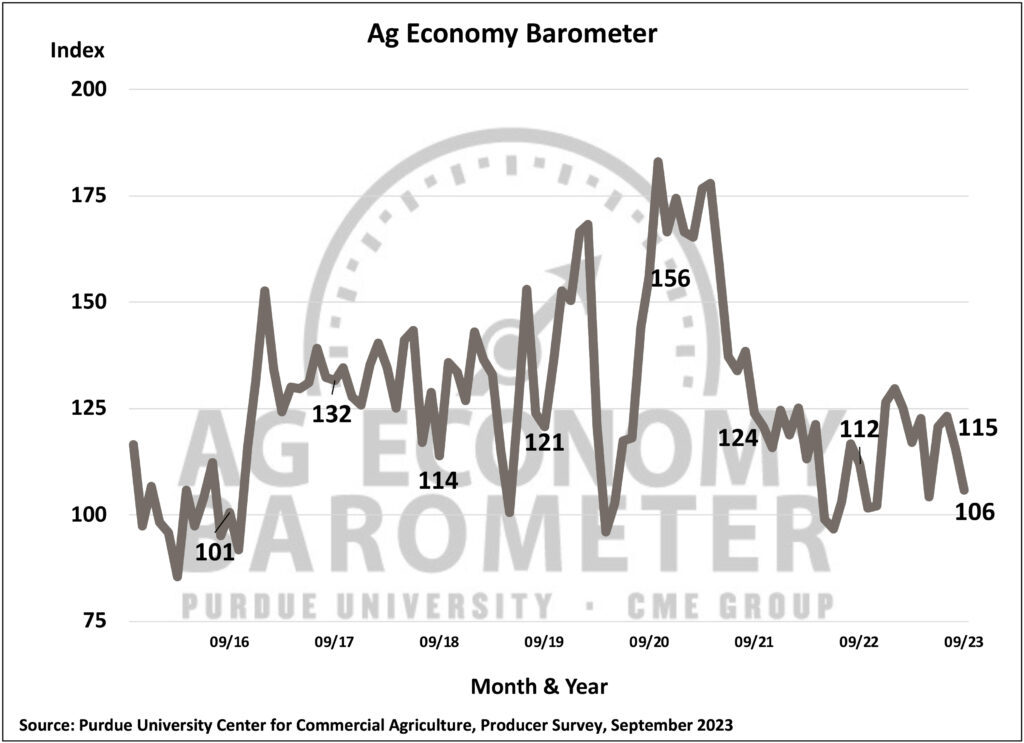
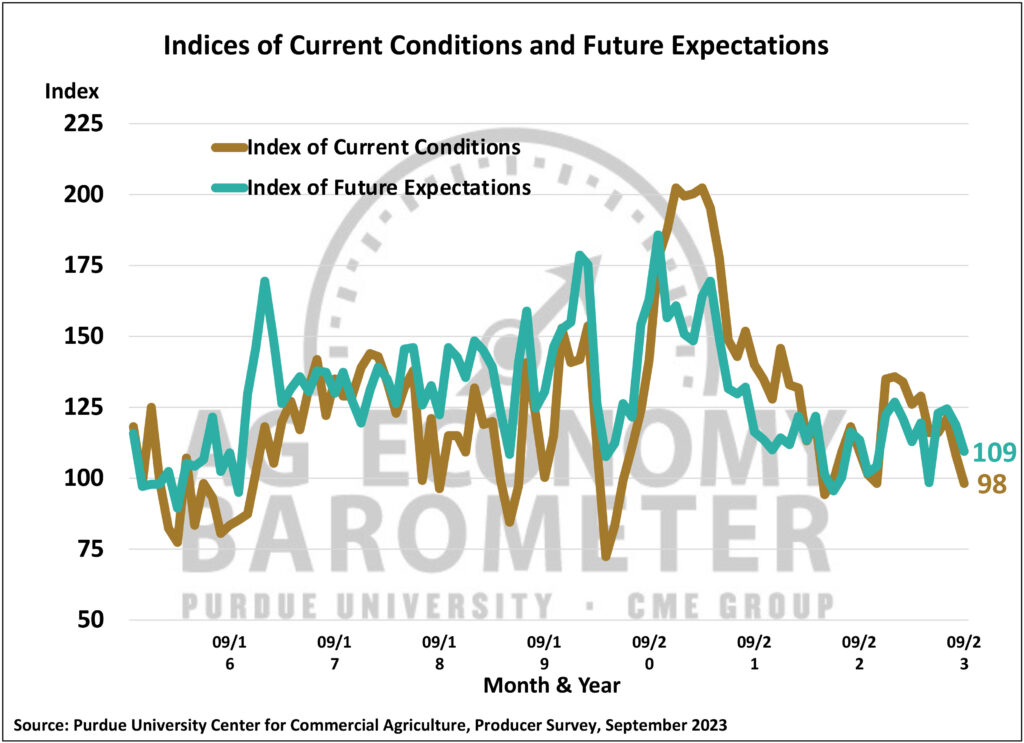
Agricultural producers’ sentiment declined for the second month in a row during September as the Purdue University-CME Group Ag Economy Barometer fell 9 points to a reading of 106. Producers expressed concern about both their current situation as well as future prospects for their farms. The Current Conditions and Futures Expectations Indices both declined 10 points in September leaving the Current Conditions Index at a reading of 98 while the Future Expectations Index stood at 109. Weakening prices for major crops and ongoing concerns about high production costs and interest rates weighed on producers’ minds this month. September’s declines left all three indices below year-ago levels. This month’s Ag Economy Barometer survey was conducted from September 11-15, 2023.

Figure 1. Purdue/CME Group Ag Economy Barometer, October 2015-September 2023.
Figure 1. Purdue/CME Group Ag Economy Barometer, October 2015-September 2023.
Figure 2. Indices of Current Conditions and Future Expectations, October 2015-September 2023.

Read More Here


Weekly Commodity Market Update

Brownfield’s Weekly Commodity update featuring former OSU Extension Ag Economist Ben Brown.

This Week’s Topics:

  • Market recap
  • U.S. grain stocks adjustments
  • U.S. harvest
  • Corn and soybean storage
  • Reports to watch

Market recap (Changes on week as of Monday’s close):

  • December 2023 corn up $.07 at $4.88
  • December 2024 corn up $.08 at $5.17
  • November 2023 soybeans down $.20 at $12.77
  • November 2024 soybeans up $.06 at $12.67
  • December soybean oil flat at 57.43 cents/lb
  • December soybean meal down $15.50 at $374.30/short ton
  • December 2023 wheat down $.25 at $5.64
  • July 2024 wheat down $.12 at $6.31
  • November WTI Crude Oil down $2.38 at $87.24/barrel

Weekly Highlights

  • For the most recent week of data- US crude oil stocks were down (-91 mil. gals) while US gasoline (+43.1 mil. gal.), Distillate (16.7 mil. gal.) and ethanol (16.7 mil. gal.) were all up.
  • Ethanol production rebounded to 297 million gallons produced on the week using an estimated 99.9 million bushels of corn.
  • US Ag Export sales were up for most commodities week over week including corn, soybeans, grain sorghum, and all wheats. US wheat sales were bullish coming in above pre-report estimates.
  • It was the third consecutive week producers and merchants decreased their net short in Chicago futures and options positions by more than 40%- this week 49%. Producers and merchants also reduced the net long in soybeans for the fourth consecutive week.
  • Managed money traders of Chicago commodities were mixed. They were net buyers of wheats and net sellers of corn and soybeans.
  • Weekly ag export inspections were down week over week for corn and wheat, but up week over week for soybeans and grain sorghum. All were within pre-report trade expectations.
  • US Grain stocks on September 1 were all within trade expectations but toward the top end for soybeans and below the average trade guess for corn. Both corn and soybean stocks were down from September 1, 2022.
  • The quarterly Hogs and Pigs report showed that there were 74.3 million hogs and pigs in the US- up slightly from last September.
  • Soybeans crushed for crude oil in August was 169 million bushels- down from 183 million in July, 175 million last August and pre-report expectations of 171.6 million bushels.
  • Corn crushed in August totaled 490 million bushels- below July 2023 but up 1% from August 2022. Corn for fuel alcohol at 443 million bushels, was down 3% from July but up 3% from last August.
  • US corn harvest is now 23% complete with corn crop conditions showing some slight improvement as combines roll along. Weekly increases were pretty consistent across the country.
  • US soybean harvest is now 23% complete up 11% week over week. Conditions improved on the week after declining last week.
  • 40% of the Winter wheat crop has been planted so far- slightly ahead last years pace but behind the average pace.

Weekly Commodity Market Update

Brownfield’s Weekly Commodity update featuring former OSU Extension Ag Economist Ben Brown.

This Week’s Topics:

  • Market recap
  • U.S. harvest overview
  • U.S. wheat planting
  • Ukraine production estimate up
  • The Fed holds interest rates steady… but
  • Reports to watch

Market recap (Changes on week as of Monday’s close):

  • December 2023 corn up $.10 at $4.81
  • November soybeans down $.19 at $12.97
  • October soybean oil down 3.64 cents at 58.75 cents/lb
  • October soybean meal up $1.60 at $392.00/short ton
  • December 2023 wheat down $.02 at $5.89
  • July 2024 wheat up $.03 at $6.43
  • September WTI Crude Oil up $0.36 at $89.62/barrelWeekly Highlights
  • US energy stocks dropped across the board this week: crude oil (-90 million gallons), gasoline (35 million gallons), and distillate supplies (-120 million gallons).
  • Ethanol production dropped 17 million gallons to 288 million gallons on the week- the lowest volume in nearly 5 months.
  • The Federal Reserve kept short term rates at a range between 5.25-5.5 during their September meeting.
  • It was a disappointing week for US ag export sales. Corn and wheats were on the low end of trade expectations while soybean sales were below the most bearish estimate. The deficit for export sales is growing fast.
  • Open interest positions of Chicago commodities were mostly up again this week. Corn, soybeans, soybean meal, and wheats saw increases. Rough rice and soybean oil were down.
  • Similar to last week, producers and merchants were active buyers of Chicago corn on the week decreasing their net short position of futures and options by nearly 42% after 42% the week before. Conversely, managed money traders were net sellers increasing their net short by nearly 10,000 positions. For soybeans, producers and merchants sold off 17.6% of their net long position with money managers also shedding 28,000 positions.
  • Friday afternoon’s USDA Cattle on Feed Report showed all US cattle on feed as of September 1 at 11.094 million head, or 97.8% of last year. The estimate was just above the average trade estimate of 97.7%. August placements were higher while marketings were lower.
  • US agricultural export inspections were up week over week for soybeans and wheat, but down for corn and grain sorghum. All were within trade expectations.
  • US corn harvest is now 15% complete with corn crop conditions showing some slight improvement as combines roll along. While it is unlikely that precipitation is having an impact on crop conditions at this point in the season- yield monitors (or reports from monitors) might. Illinois and Iowa both saw noticeable increases.
  • US soybean harvest is now 12% complete up 7% week over week. Conditions declining only slightly.
  • 26% of the Winter wheat crop has been planted so far- slightly behind last years pace and the average pace. Plantings are being the most in the eastern corn belt due to slow fall harvest. This is where most of the soft red winter wheat is planted.

Weekly Commodity Market Update

Brownfield’s Weekly Commodity update featuring former OSU Extension Ag Economist Ben Brown.

This Weeks Topics:

  • Market recap
  • USDA WASDE review
  • Tightness in soybean market
  • Soybean crush down
  • Harvest picks up
  • Reports to watch

Market recap (changes on week as of Monday’s close):
• December 2023 corn down $.14 at $4.71
• November soybeans down $.53 at $13.16
• October soybean oil up 1.05 cents at 62.39 cents/lb
• October soybean meal down $15.60 at $390.40/short ton
• December 2023 wheat up $.07 at $5.91
• July 2024 wheat up $.03 at $6.40
• September WTI Crude Oil up $3.41 at $89.28/barrel

Continue reading Weekly Commodity Market Update

Ohio Crop Progress

Source: USDA

Last week’s warm days and mostly fair weather supported crop progress but left some counties excessively dry, according to Ben Torrance, State Statistician, USDA NASS, Ohio Field Office. Topsoil moisture conditions were rated 9 percent very short, 19 percent short, 68 percent adequate, and 4 percent surplus. Statewide, the average temperature for the week ending on September 10 was 72.5 degrees, 4.6 degrees above normal. Weather stations recorded an average of 0.27 inches of precipitation, 0.27 inches below average. There were 5.6 days suitable for fieldwork during the week ending September 10.

Ninety-five percent of corn was in or past dough, 53 percent was in or past dent, and 11 percent was mature. Corn for silage was 27 percent harvested. Eight percent of soybeans were dropping leaves. Corn and soybean condition were 82 and 75 percent good to excellent, respectively. Third cuttings of alfalfa hay and other dry hay were 88 and 58 percent complete, respectively. Fourth cuttings of alfalfa hay were 38 percent complete. Pasture and range condition was rated 68 percent good to excellent, down from the previous week.

Weekly Commodity Market Update

Brownfield’s Weekly Commodity update featuring former OSU Extension Ag Economist Ben Brown.

This Weeks Topics:

  • Market recap
  • Corn and soybean acreage
  • Corn and soybean production
  • Reports to watch

Market recap (Changes on week as of Monday’s close):
– December 2023 corn up $.05 at $4.85
– November soybeans up $.06 at $13.69
– October soybean oil down 2.63 cents at 61.34 cents/lb
– October soybean meal up $5.80 at $406.00/short ton
– December 2023 wheat down $.14 at $5.84
– July 2024 wheat down $.12 at $6.37
– September WTI Crude Oil up $2.13 at $85.87/barrel

Weekly Highlights

  • US crude oil stocks were down again last week continuing a trend over the last month. Globally production cuts by the top exporters are being offset by other global producers and lower global demand.
  • Ethanol production was basically flat on the week- up 2 million gallons. Gasoline demand was up on the week while ethanol stocks were flat suggesting that ethanol exports have been rather sluggish in August.
  • It was the last week of export sales of the 2022/23 marketing year for corn and soybeans with net cancelations on of corn and 5.7 net sales for soybeans. However, new crop 2023/24 sales finally showed some life.
  • Open interest positions of Chicago futures and options were largely up:  Chicago wheats-flat, corn- +1.4%, soybeans- +2.2%, cotton- +10.4%, and rough rice- +14.7%.
  • Managed money traders bought back 168 futures and options positions to slightly decrease their net short position in that commodity, while also selling off 6,565 contracts of corn increasing the net short, and also selling 8,175 contracts of Chicago soybeans decreasing the net long for that commodity.
  • US ag export inspection data was mixed this week- for feed grains it was a relatively strong week with corn, grain, and wheats with all reaching multi-month highs. Soybean inspections were the lowest since early August.
  • Crop conditions continue to deteriorate. Corn was down 1 point to 337, but up 1 point from last year. Soybeans fell 3 points to 337 and are 10 below last year. Cotton conditions fell a point to 275 and are also down 10 points relatively to last year.
  • Five percent of the US corn crop is harvested- compared to 4% on average. Eight percent of the US cotton crop has been harvested. Forty-five percent of the US rice crop has been harvested compared to an average of 35%.

Farmer Sentiment Dips Amid Weaker View of Current Conditions

Source: James Mintert and Michael Langemeier, Purdue Center for Commercial Agriculture

U.S. farmers’ sentiment weakened in August compared to July as the Purdue University-CME Group Ag Economy Barometer dipped 8 points to a reading of 115. This month’s decline was fueled by producers’ weaker perception of current conditions both on their farms and in U.S. agriculture as the Current Conditions Index fell 13 points to a reading of 108. The Future Expectations Index also declined in August to a reading of 119, 5 points below a month earlier. This month’s Ag Economy Barometer survey was conducted from August 14-18, 2023. Although producer sentiment weakened in August, producers’ rating of farm financial conditions changed little this month, as the Farm Financial Performance Index declined just one point to a reading of 86. However, producers’ perspectives on farm financial conditions were noticeably weaker than a year earlier when the index stood at 99. Weaker producer sentiment this month did translate into a decline in the Farm Capital Investment Index. The investment index fell to 37, eight points lower than in July and two points lower than a year earlier. Among producers with a negative view of the investment climate, the increase in prices for farm machinery and new construction along with rising interest rates were the two most commonly cited reasons for their negative view. In a related question, over half (60%) of producers in this month’s survey said they expect interest rates to rise in the upcoming year.

When asked about top concerns for their farming operations in the next 12 months, producers continue to point to higher input prices and rising interest rates as their top two concerns. Higher input prices was chosen by one out of three (34%) and rising interest rates was chosen by one out of four (24%) survey respondents as a top concern. Even though crop prices weakened significantly this summer, producers ranked declining commodity prices as their number three concern, chosen by one out of five (20%) producers.

Click here to download the full report


Weekly Commodity Market Update

Brownfield’s Weekly Commodity update featuring former OSU Extension Ag Economist Ben Brown.

This weeks topics include:

  •  Market recap
  • Harvest market outlook
  • Hot, dry weather impacting soybeans
  • Wishlist for new marketing year
  • Reports to watch

Market recap (changes on week as of Monday’s close):
– December 2023 corn down $.15 at $4.81
– November soybeans down $.42 at $13.63
– October soybean oil down 1.00 cent at 63.97 cents/lb
– October soybean meal up $.50 at $400.20/short ton
– December 2023 wheat down $.19 at $5.98
– July 2024 wheat down $.19 at $6.49
– September WTI Crude Oil up $4.04 at $83.74/barrel

Weekly Highlights:
– US crude oil stocks were down again last week continuing a trend over the last month. The hurricanes hitting the US southeast have cause some temporary shutdowns that are expected to tighten domestic stocks again next week.
– Ethanol production pulled back to 296 million gallons on the week- the lowest level in just over 3 ½ months. The reduction in ethanol production and higher gasoline use decreased ethanol stocks another 50 million gallons providing support to ethanol prices.
– Ag export sales were mixed, supportive for feed grains while being bearish for soybeans. There were 39 million bushels of 2023/24 corn export sales- the largest volume of the marketing year. For soybeans, there were net cancelations of soybean sales for the current marketing year with below average new crop sales.
– Total corn consumed for fuel in July totaled 454 million bushels up 3% from June and 2% from July 2022.
– Soybeans crushed for crude oil in July totaled 184.8 million bushels up 10 million from June and 4 million from July 2022. The July 2023 volume was also above the average trade guess of 181.2.
– Open interest positions of Chicago futures and options were mixed on the week: Chicago wheats-flat, corn- -12.7%, soybeans- +1.2%, cotton- +4.4%, and rough rice- +3.8%.
– Managed money traders bought 18.8 thousand net corn contracts after being big sellers the last couple weeks. Money managers also bought net positions of soybeans to increase their net long 32.8 thousand contracts.

Ohio Crop Progress

Source: USDA

Ninety percent of corn was in or past dough, 40 percent of Ohio corn was in or past dent, and 2 percent was mature. Corn for silage was 11 percent harvested. Ninetyfive percent of soybeans were setting pods and 3 percent were dropping leaves. Corn and soybean condition were 80 and 76 percent good to excellent, respectively. Second cuttings of other hay were 94 percent complete. Third cuttings of alfalfa hay and other dry hay were 75 and 51 percent complete, respectively. Fourth cuttings of alfalfa hay were 29 percent complete.