Farm Safety

Safety on the farm is not something that should be taken lightly. The average person reacts to a potential hazard in 0.2-0.3 seconds.  #eFields18 includes a special report on farm safety and shares the severity of injuries that could occur in that fraction of a second before reacting. The inclusion of farm safety in this year’s report was made possible by Kent McGuire and the OSU Agricultural Safety and Health Program.

View the eFields “Safety on the Farm” report on page 20 here:go.osu.edu/eFields18
Learn more about the Ag Safety and Health Program here: agsafety.osu.edu

Yield Response of Corn to Plant Population in Indiana

Source: RL (Bob) Nielsen, Jim Camberato, & Jason Lee Purdue University (Edited)

Summary:

Results from 97 field scale trials around Indiana since 2008 suggest that maximum yield response to plant populations for 30-inch row corn grown under minimal to moderate stress conditions occurs at about 32,150 plants per acre (ppa), equal to seeding rates of about 33,840 SEEDS per acre (spa). Economic optimum populations are several thousand lower than the agronomic optimum. Corn grown under extremely challenging conditions (e.g., severe drought stress) may perform best at plant populations no higher than 22,800 ppa and perhaps as low as 21,000 ppa under truly severe growing conditions (e.g., actual drought, non-irrigated center pivot corners, non-irrigated sandy fields with minimal rainfall).

The cost of seed corn is the largest single variable input cost for most Indiana corn growers(Dobbins et al., 2019). Minimizing that cost involves a combination of shrewd purchasing skills and wise selection of seeding rates. This summary focuses on our recent research evaluating the yield responses of corn to plant populations in field scale trials conducted around the state of Indiana since 2008.

Reported corn plant populations have increased steadily in Indiana (and Ohio) for the past several decades, at an annual increase of approximately 315 plants per acre (ppa) per year, based on historical data summarized by the USDA National Agricultural Statistics Service. In 2018, the average reported plant population for Indiana (and Ohio) was approximately 30,400 PLANTS per acre (USDA-NASS, 2019). Considering stand establishment success typically ranges from 90% to 95%, the average reported population suggests that the average seeding rate statewide is 32,000 to 33,800 seeds per acre (spa). Among the agronomic factors that support the steady annual increase in plant populations has been the genetic improvement in overall stress tolerance that has resulted in a) ear size and kernel weight becoming less sensitive to the stress of thicker stands of corn and b) improved late-season stalk health.

Click here to read the entire study


Estimating Wheat Yield With Stem Counts

Source: Dr. Laura Lindsey

Between planting in the fall and Feekes 4 growth stage (beginning of erect growth) in the spring, winter wheat is vulnerable to environmental stress such as freezing temperatures with limited snow cover, saturated soils, and freeze-thaw cycles that cause soil heaving. All of which may lead to substantial stand reduction.

However, a stand that looks thin in the spring does not always correspond to lower grain yield. Rather than relying on a visual stand assessment, farmers should estimate the yield potential of their winter wheat crop by counting stems, before deciding whether a field should be destroyed. An alternative method to evaluate wheat stand is fractional green canopy cover (FGCC). Fractional green canopy cover can be used to measure the canopy surface area using the mobile device application Canopeo. The app can be downloaded for free here: http://www.canopeoapp.com.

Figure 1. Measurement tool used to consistently count the number of stems in one foot of row.

Wheat Stem Count Methods: Wheat stems (main stem plus tillers) should be counted at Feekes 5 growth stage (leaf sheaths strongly erect) from one linear foot of row from several areas within a field (Figure 1).


Figure 2. Winter malting barley image analyzed for fractional green canopy cover with the Canopeo mobile device application.


Fractional Green Canopy Cover Methods: Fractional green canopy cover should be measured at Feekes 5 growth stage using the mobile device application, Canopeo (http://www.canopeoapp.com). The camera should be held at a height to capture three rows of wheat in the image (Figure 2).


After counting the number of wheat stems or measuring FGCC, Table 1 can be used to estimate wheat grain yield. For example, if an average of 51 stems is counted from one foot length of row, the predicted grain yield would be 100 bu/acre. Similarly, if the average FGCC measurement was 35%, the predicted grain yield would be 100 bu/acre.


Addressing Harvest Ruts and Erosion Gullies

Source: Paul Jasa – Extension Engineer, University of Nebraska-Lincoln

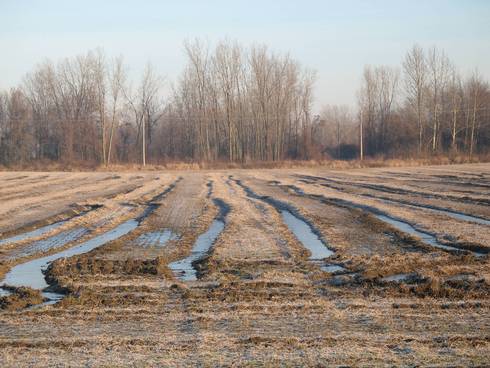
Some fields were harvested last fall when the soil was quite wet and the harvest equipment left ruts. In addition, runoff from storms created rills and gullies in some fields, leaving them rough. Flooding also created gullies in some fields and may have deposited sand, silt, and other debris. With the wet spring, producers need to evaluate soil moisture conditions before heading to their fields to clean up flood debris and fill in ruts, rills, and gullies.

Harvest Compaction
Compaction is the loss of pore space between soil particles. When that pore space is lost, it “reappears” on the soil surface as the rut. Tillage will fluff the soil surface so that the compaction from tillage is not easily seen. Usually, the ruts or gullies are as deep as the tillage depth since tillage destroys soil structure and leaves a compaction layer below the tillage depth. Unfortunately, the compaction from harvest equipment cannot be broken up with spring tillage on wet soils as the soil needs to be dry to fracture. The soil may appear dry on the surface, but it’s usually too wet at tillage depth to effectively reduce compaction and deeper tillage should be delayed until after harvest.

Field Drydown
Wait as long as possible for the soil to dry before lightly tilling very shallow to fill in and smooth ruts or gullies. Tilling deeper on wet soils will cause soil smearing and create compaction. The tillage also will destroy soil structure such that subsequent tillage passes or trips across the field will cause more compaction. The compaction from wheel traffic ruts extends far deeper into the soil than typical spring tillage operations can reach. Building soil structure is the best way to avoid compaction and wheel traffic rut problems.

Spot Tillage
Usually, ruts or gullies are only in portions of a field, not across the entire field. As such, shallow spot tillage rather than whole field tillage should be used to smooth these areas. While popular for cutting up residue, vertical tillage implements are not very effective for filling in ruts or gullies as they aren’t designed to move soil side-to-side. A light disking or field cultivation, at an angle to the ruts or gullies, is far more effective to fill in the deeper ones. Shallow rills (three inches or less) could be planted across without tillage so as not to destroy the residue. The planter may need to be operated slightly slower than usual to reduce bounce and the planting depth may need to be set deeper to make sure all seeds are placed in the soil.

Cover Crops
Many of the gullies were formed by concentrated flows of runoff. Unless something is done to anchor the soil when the gullies are filled, they will simply wash out again. Seeding a cover crop in these areas will help anchor the soil, especially on sloping soils. Rather than using a wide tillage implement, far less soil will be disturbed by using a center pivot track filler. Unlike conventional tillage implements, many center pivot track fillers also firm the soil into the filled track, helping anchor the soil. Mounting a simple 12-volt spinner seeder in front of the track filler could seed a cover crop at the same time. The roots of the growing cover crop will help reduce compaction and help build soil structure.

Residue Benefits
Producers should leave as much residue standing in the field as possible and minimize full width tillage. Tillage dries the soil, buries residue, destroys soil structure, and increases erosion and runoff. Standing residue, still attached, is one of the most effective ways to protect soil from the erosive forces of wind. The standing residue will greatly decrease the amount of blowing soil when wind erosion is at its peak before the planting season. Producers should consider no-tilling directly into the standing residue to continue the erosion control benefits until crop canopy can take over.
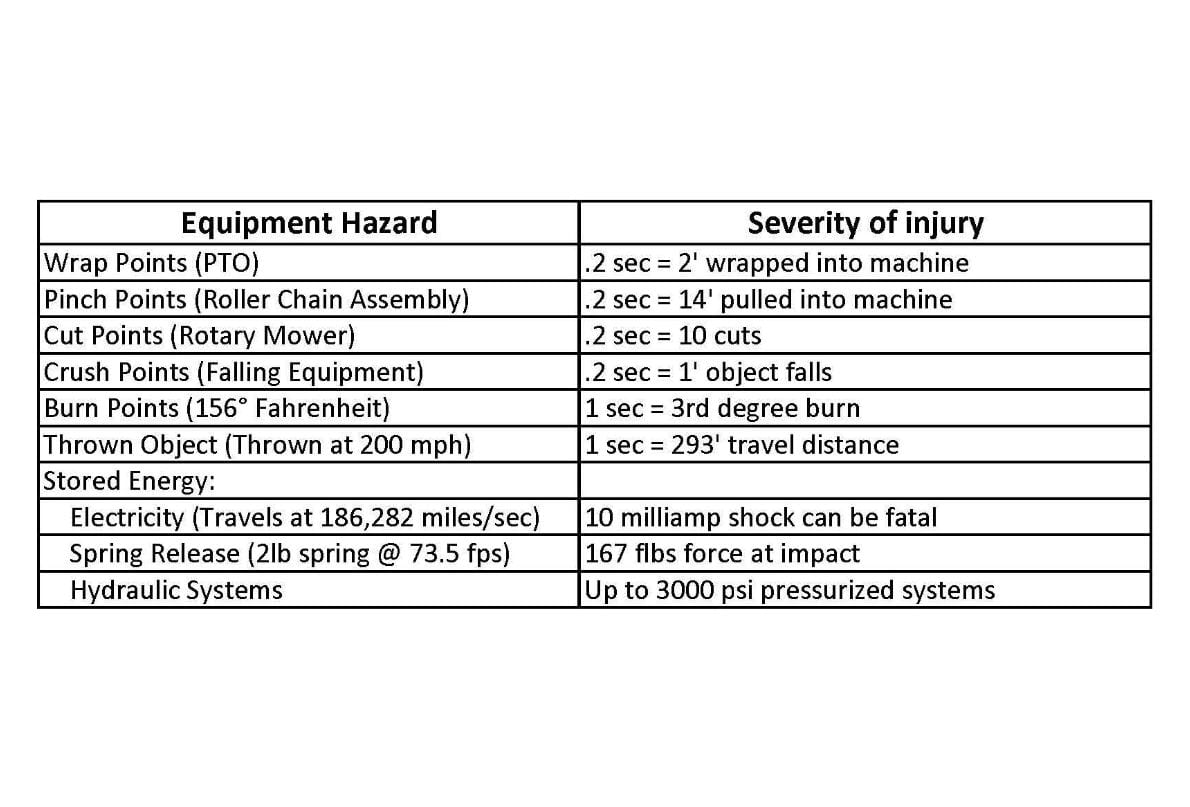
SPRING ROLLER COASTER RIDE COMING

Source:  Jim Noel (Edited)

It is spring and with it often comes wild swings. This is what we expect for the rest of April 2019.

A parade of storms will begin later this Thursday (4/11) into Friday (4/12) and follow every 3-5 days. This will cause 2-3 inches of rain on average for Ohio the next two weeks as shown in the attached graphic. Normal rainfall is now almost 1 inch per week. Hence, slightly above normal rainfall is expected. The one exception could be northern and northwest Ohio where it is possible to see less rainfall depending on the exact storm tracks.

We are also fast approaching our end of the freeze season typically in mid April up to around the 20th for much of the state. Some places in the north it can be late April. Right now, everything looks like a normal end to the freeze season. We do see the possibility of another freeze this weekend on Sunday AM especially north of I-70. A few more could happen into the next week or two before coming to an end.

Temperatures are expected to overall be slightly above normal for the rest the rest of April but with wild swings. This should help bring 2-4 inch soil temperatures into the normal range, possibly a degree or so above normal. The exception would be northern Ohio where above normal ice levels this past winter on the Great Lakes will keep water temperatures on the Lakes lagging and may keep air temperatures closer to normal there.

With all the storms lined up, we do expect a windy April as well. Winds of 30-40 mph with gust to 50 mph can not be ruled out Thursday (4/11) or Friday (4/12) this week with storm number one. 30-40 mph winds will also be possible with the storm later Sunday into next Monday and can not be ruled out with the third storm later next week.

After a wetter April indications are for a warmer and not as wet May with the possibility of normal or even a bit below normal rainfall.

Early indications for the summer growing season are normal or slightly above normal temperatures and possibly a bit wetter than normal though June could be a bit drier.