Check your corn now for stalk strength

As harvest approaches, its time to check our corn plants for stalk integrity.  Time spent tin the field now, may pay huge dividends later this fall.  As stalk tissue becomes compromised below the main ear the stalk may become brittle or weak and be prone to lodging.

There are a number of plant pathogens that can cause stalk rot including, Anthracnose, Bacteria, Charcoal, Diplodia, Fusarium, Gibberella, and Pythium. Some of these stalk rots have very characteristic symptoms that can help identify the specific problem, while others may require laboratory diagnosis (Table 1).  The Purdue Extension Publication Corn Diseases: Stalk Rot has good images to help identify the major stalk rot diseases. (https://www.extension.purdue.edu/extmedia/BP/BP-89-W.pdf ).

Check field by using the Push or Pinch Test by evaluating 20 plants in at least five random areas in a field.

  • Pinch Test – grab the stalk somewhere between the lowest two internodes and pinch between your fingers to see if the stalk is strong enough to handle the force – if the stalk collapses, it fails.
  • Push Test – push the stalk to a 30-degree angle – if it pops back up when released, it passes the test, if not it fails.

Threshold: 10% or more of the stalks fail then consider field for early harvesting to avoid risk for lodging.

What can you do in the future – management options will depend on the specific disease (see table 1). Production practices that promote good plant health including balanced fertilization, appropriate plant populations, and good water management can reduce stresses that might predispose corn to stalk rot. In addition, these key management tools can help mitigate future stalk rot issues.

  1. Properly diagnosis the stalk rot pathogen.
  2. Select hybrids with resistance if available.
  3. Crop Rotation – rotating to non-host crop will help reduce stalk rot potential in a field. Note that Charcoal rot and Gibberella stalk rot can infect other rotational crops.
  4. Tillage – burying infected crop residue will encourage more rapid desiccation and help reduces risk of overwintering in crop residue.
  5. Good soil drainage and reduced compaction.
  6. Foliar Fungicides – applying foliar fungicides can help protect crop from foliar diseases that could predispose plant to stalk rot when present, but devoid of foliar disease pressure fungicides applications have not consistently been found to help reduce stalk rot.

Farm Insurance: Covering Your Assets

Farms are subject to more risks than ever before. Whether it is the liability exposure of driving equipment on roadways or the potential of property loss due to a barn roof collapse, every farm has multiple sources of risk. While farmers can reduce their risk exposure through good business practices and rigorous safety protocols, there is no way to entirely eliminate risks. For this reason, insurance policies that adequately protect against risks are a necessity for farm operations. Farmers likely understand the important role insurance plays in protecting farm assets. But how many actually read and understand their insurance policies? The failure to read policies is not a result of apathy but more likely due to the almost complex nature of an insurance policy. Reading and understanding an insurance policy is difficult for anyone other than those in the insurance industry. The objective of this publication is to help by providing farmers a basic understanding of insurance policies—from common coverages to policies in preparation for a thorough policy review with the insurance agent. Our information is based on general knowledge as applicable to most policies. Farmers should periodically review their insurance policy, including coverage limits, with their agent to be sure they are fully covered for potential risks.

Click here to view entire document

The Rising Costs of Corn Production in Illinois

Source: Farmdoc daily, University of Illinois, (edited)

While this article is written for Illinois, many if not all of these thoughts are pertinent in Ohio as well.

Significant increases in production costs in recent years combined with expectations for lower commodity prices have resulted in much lower return expectations for 2023 and 2024 compared with the previous three years (see farmdoc dailyAugust 29, 2023). In today’s article, we revisit trends in direct costs for corn production in Illinois over time (see farmdoc dailyApril 4, 2023 and July 12, 2016, for previous articles).  Since 2000, direct costs – which include production inputs – have risen at an average annualized rate of 7% per year.  Individual components of direct costs, such as fertilizers, pesticides, and seeds, have all experienced similar average growth rates.

Total direct costs are projected to reach record levels for 2023 and are expected to experience only modest declines for 2024.  Fertilizer costs are projected at record levels for 2023, but a fairly large decline is expected for 2024. Seed costs are projected at record levels for 2023 and remain constant in 2024.  Pesticide costs are projected to be at record levels for 2023 and to further increase for 2024. In addition to viewing these costs on a $ per acre basis, we also provide perspective on a share of revenue basis.

Total Direct Costs

Direct costs include the cost of production inputs such as fertilizers, seeds, and pesticides (herbicides, pesticides, fungicides). Costs associated with drying, storage, and crop insurance are also included in the direct cost category.  Total direct costs for corn production in central Illinois have increased over time from $134 per acre in 2000 to $558 in 2022 (see Figure 1), which implies an average annualized growth rate of 7% between 2000 and 2022.  Direct costs for the 2023 crop year are projected at a record level of $579 per acre, with a decline to $527 per acre currently expected for the 2024 crop year based on recently released crop budgets (see farmdoc dailyAugust 29, 2023 and 2024 Illinois Crop Budgets) and Ohio Crop Enterprise budgets.

Click here for the full article

Farm Safety – Grain Handling Equipment

Harvest season is right around the corner.  As we all know this time of year can be very busy with many different activities happening at once.  Try to keep safety in mind especially around grain handling equipment.  There are many potential hazards to consider when handling grain, such as equipment entanglement, grain entrapment and engulfment, dust explosions, among others.

This fall, lower your risk of injury by using a safety checklist.


  • Check that all exposed moving machinery parts have guards, shields, or cages installed and in good condition to prevent entanglement, including auger flighting, conveyers, belts, and power-take-off (PTO) components.
  • Don’t wear loose or baggy clothing, tie back hair, and remove dangling drawstrings and jewelry that could get pulled into moving parts.
  • Lock-out the power to augers, conveyers, belts, and PTO components before performing maintenance or replacing parts so they can’t be accidentally turned on.
  • Steer clear of flowing grain, which can trap a person knee-deep in a matter of a few seconds and can completely submerge them in less than 20 seconds.
  • Work from outside of the bin whenever possible and use safe bin entry procedures including the buddy system when a bin must be entered.
  • Check that everyone knows how to de-energize grain loading and unloading equipment and lock-out the power sources so that grain moving equipment can’t be turned on while someone is inside of a bin.
  • Use hazard signage and teach kids and unexperienced people to stay out of stored grain, including bins, piles, and grain transport vehicles.
  • Keep the grain vacuum nozzle away from the area below your feet and keep an eye on the angle of the grain surface as you are removing grain. To prevent grain flow, the grain angle should be less than the grain’s angle of repose, which is around 21 degrees for corn and 23 degrees for soybeans.
  • Check that fire extinguishers are easily accessible at the grain storage site. Grain handling facilities naturally collect dust which can lead to explosions given the right conditions.
  • Clean off dust accumulated in grain legs and elevators and service bearings, belts, and motors regularly. Just a paper-thick layer of dust is combustible in a confined space and overheated equipment parts or static electricity can be an ignition source.
  • Recheck combine settings as grain condition changes to reduce kernel damage and collection of fines and trash. Dry conditions across Iowa may cause overly dry and brittle grain or uneven conditions across farms, making regular combine adjustments important.
  • If excess fines and broken kernels are collected, either clean the grain before it goes into the bin or core the bin multiple times during filling to remove fines accumulated in the center of the bin. Removing the center core of fines and broken grain will improve aeration in the bin and reduce the risk of grain spoilage and unloading issues down the road.

Ohio Crop Progress

Source: USDA

Crop maturity accelerated under last week’s warm and dry conditions, according to Ben Torrance, State Statistician, USDA NASS, Ohio Field Office. Topsoil moisture conditions were rated 6 percent very short, 49 percent short, and 45 percent adequate. Statewide, the average temperature for the week ending on September 24 was 63.4 degrees, 2.0 degrees above normal. Weather stations recorded an average of 0.09 inches of precipitation, 0.64 inches below average. There were 6.5 days suitable for fieldwork during the week ending September 24.

Last week’s field activities included hay bailing, manure application, lime spreading, and drainage tile installation. Limited instances of tar spot fungus in corn stands were reported in west-central portions of the State. Seventyseven percent of corn was in or past dent, 40 percent was mature, and 2 percent was harvested. Corn for silage was 59 percent harvested. Fifty-two percent of soybeans were dropping leaves. Corn and soybean condition were 72 and 68 percent good to excellent, respectively. Third cuttings of alfalfa hay and other dry hay were 95 and 80 percent complete, respectively. Fourth cuttings of alfalfa hay were 63 percent complete. Winter wheat was 3 percent planted. Pasture and range condition was rated 56 percent good to excellent, down from the previous week.

Weekly Commodity Market Update

Brownfield’s Weekly Commodity update featuring former OSU Extension Ag Economist Ben Brown.

This Week’s Topics:

  • Market recap
  • U.S. harvest overview
  • U.S. wheat planting
  • Ukraine production estimate up
  • The Fed holds interest rates steady… but
  • Reports to watch

Market recap (Changes on week as of Monday’s close):

  • December 2023 corn up $.10 at $4.81
  • November soybeans down $.19 at $12.97
  • October soybean oil down 3.64 cents at 58.75 cents/lb
  • October soybean meal up $1.60 at $392.00/short ton
  • December 2023 wheat down $.02 at $5.89
  • July 2024 wheat up $.03 at $6.43
  • September WTI Crude Oil up $0.36 at $89.62/barrelWeekly Highlights
  • US energy stocks dropped across the board this week: crude oil (-90 million gallons), gasoline (35 million gallons), and distillate supplies (-120 million gallons).
  • Ethanol production dropped 17 million gallons to 288 million gallons on the week- the lowest volume in nearly 5 months.
  • The Federal Reserve kept short term rates at a range between 5.25-5.5 during their September meeting.
  • It was a disappointing week for US ag export sales. Corn and wheats were on the low end of trade expectations while soybean sales were below the most bearish estimate. The deficit for export sales is growing fast.
  • Open interest positions of Chicago commodities were mostly up again this week. Corn, soybeans, soybean meal, and wheats saw increases. Rough rice and soybean oil were down.
  • Similar to last week, producers and merchants were active buyers of Chicago corn on the week decreasing their net short position of futures and options by nearly 42% after 42% the week before. Conversely, managed money traders were net sellers increasing their net short by nearly 10,000 positions. For soybeans, producers and merchants sold off 17.6% of their net long position with money managers also shedding 28,000 positions.
  • Friday afternoon’s USDA Cattle on Feed Report showed all US cattle on feed as of September 1 at 11.094 million head, or 97.8% of last year. The estimate was just above the average trade estimate of 97.7%. August placements were higher while marketings were lower.
  • US agricultural export inspections were up week over week for soybeans and wheat, but down for corn and grain sorghum. All were within trade expectations.
  • US corn harvest is now 15% complete with corn crop conditions showing some slight improvement as combines roll along. While it is unlikely that precipitation is having an impact on crop conditions at this point in the season- yield monitors (or reports from monitors) might. Illinois and Iowa both saw noticeable increases.
  • US soybean harvest is now 12% complete up 7% week over week. Conditions declining only slightly.
  • 26% of the Winter wheat crop has been planted so far- slightly behind last years pace and the average pace. Plantings are being the most in the eastern corn belt due to slow fall harvest. This is where most of the soft red winter wheat is planted.

A Comparison of Business Entities Available to Ohio Farmers

By: Robert Moore, Barry Ward, OSU Extension

Ohio farmers have many choices when selecting a business entity for their farming operations. Choosing the right entity is important, as it can impact issues such as how the business functions, ownership rights, personal liability, and taxation. What should a farmer consider when deciding which type of entity to use for a business? We provide an overview of business entities used for farm operations in this bulletin, compare ten important factors to consider when making the entity selection decision, and highlight the advantages of using a formal business entity. A Business Entity Comparison Chart at the end of the publication summarizes entity characteristics. As with all legal issues, consultation with an attorney is critical to making a successful decision.

Types of business entities

Sole Proprietorship. A Sole Proprietorship is a business owned by a single person who is referred to as the “sole proprietor.” The sole proprietor and the business are one and the same—there is no separate legal business entity. The sole proprietor owns all business assets, is responsible for all liabilities, and reports income as individual income.

Partnership. A partnership exists when two or more individuals or “partners” jointly own and conduct a business for profit. A “General Partnership” consists of partners who each have management authority and personal liability for the partnership and who report income from the partnership as individual income. A different type of partnership, the “Limited Partnership,” allows investors to enter a partnership as “limited partners” without involving them in management and exposing them to personal liability for the partnership.

Click here to read more.


Wheat Planting Management Considerations for Fall 2023

This year, wheat yields were extremely high across Ohio. In the Ohio Wheat Performance Test (https://ohiocroptest.cfaes.osu.edu/wheattrials/default.asp?year=2023), grain yield averaged between 86 and 126 bu/acre across five Ohio counties. Cool temperatures and adequate subsoil moisture led to a long grain fill period. The long grain fill period coupled with low disease resulted in high-yielding conditions. Mother nature certainly helped us out in 2023; however, fall wheat management is important to set your crop up for success.

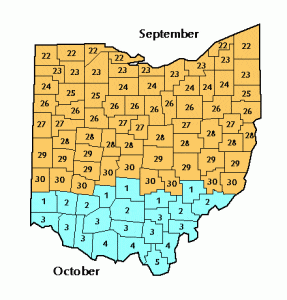
Now that we’ve entered mid-September, wheat planting is just around the corner. Here are our key management strategies for this fall:

  1. Plant within the 10-day period starting after the county fly-safe date. It can be tempting to plant wheat before your county’s Hessian fly-safe date (Figure ; however, the best time to plant wheat is the 10-day period starting the day after the fly-safe date. Planting before the fly-safe date increases the risk of insect and disease problems including Hessian fly and aphids carrying Barley Yellow Dwarf Virus. Our wheat planting date field trials have shown no yield benefit of planting prior to the county fly-safe date.
  2. Select high-yielding varieties with high test weight, good straw strength, and adequate disease resistance. Do not jeopardize your investment by planting anything but the best-yielding varieties that also have resistance to the important diseases in your area. Depending on your area of the state, you may need good resistance to powdery mildew, Stagonospora leaf blotch, and/or leaf rust. Avoid varieties with susceptibility to Fusarium head scab. Plant seed that has been properly cleaned to remove shriveled kernels and treated with a fungicide seed treatment to control seed-borne diseases.
  3. Optimum seeding rates are between 1.2 and 1.6 million seeds/acre. For drills with 7.5-inch row spacing, this is about 18 to 24 seeds per foot of row. When wheat is planted on time, the actual seeding rate has little effect on yield, but high seeding rates (above 30 seeds per foot of row) increase lodging and risk of severe powdery mildew development next spring.
  4. Planting depth is critical for tiller development and winter survival. Plant seed 1.5 inches deep and make sure planting depth is uniform across the field. No-till wheat seeded into soybean stubble is ideal, but make sure the soybean residue is uniformly spread over the surface of the ground. Shallow planting is the main cause of low tiller numbers and poor winter survival due to heaving and freezing injuries. Remember, you cannot compensate for a poor planting job by planting more seeds; it just costs more money.
  5. Follow the Tri-State Fertilizer Recommendations for Corn, Soybeans, Wheat, and Alfalfa (https://agcrops.osu.edu/FertilityResources/tri-state_info).
  6. Apply 20 to 30 lb of actual nitrogen per acre at planting to promote fall tiller development. A soil test should be completed to determine phosphorus and potassium needs. Wheat requires more phosphorus than corn or soybean, and soil test levels should be maintained between 30-50 ppm (Mehlich-3 P) for optimum production (Table 1). Do not add phosphorus if soil test levels exceed 50 ppm.

Table 1. Wheat phosphorus recommendations from the Tri-State Fertilizer Recommendations for Corn, Soybeans, Wheat, and Alfalfa.

Table 1. Wheat phosphorus recommendations from the Tri-State Fertilizer Recommendations for Corn, Soybeans, Wheat, and Alfalfa.

Soil potassium should be maintained at levels of 100-130 and 120-170 ppm (Mehlich-3 K) on sandy soils (CEC < 5 meq/100 g) and loam/clay soils (CEC > 6 meq/100 g), respectively. If potassium levels are low, apply K2O fertilizer at planting, depending on soil CEC and yield potential (Table 2).

Table 2. Wheat potassium recommendations from the Tri-State Fertilizer Recommendations for Corn, Soybeans, Wheat, and Alfalfa.

Table 2. Wheat potassium recommendations from the Tri-State Fertilizer Recommendations for Corn, Soybeans, Wheat, and Alfalfa.

Soil pH should be between 6.3 and 7.0. In Ohio, limed soils usually have adequate calcium and magnesium.

Weekly Commodity Market Update

Brownfield’s Weekly Commodity update featuring former OSU Extension Ag Economist Ben Brown.

This Weeks Topics:

  • Market recap
  • USDA WASDE review
  • Tightness in soybean market
  • Soybean crush down
  • Harvest picks up
  • Reports to watch

Market recap (changes on week as of Monday’s close):
• December 2023 corn down $.14 at $4.71
• November soybeans down $.53 at $13.16
• October soybean oil up 1.05 cents at 62.39 cents/lb
• October soybean meal down $15.60 at $390.40/short ton
• December 2023 wheat up $.07 at $5.91
• July 2024 wheat up $.03 at $6.40
• September WTI Crude Oil up $3.41 at $89.28/barrel

Continue reading Weekly Commodity Market Update

Ohio Crop Progress

Source: USDA
Moderate temperatures and mostly clear skies throughout Ohio provided farmers with favorable conditions to conduct pre-harvest activities, according to Ben Torrance, State Statistician, USDA NASS, Ohio Field Office. Continued lack of significant precipitation resulted in an increase in abnormally dry soil moisture levels. Topsoil moisture conditions were rated 6 percent very short, 37 percent short, 56 percent adequate, and 1 percent surplus. Statewide, the average temperature for the week ending on September 17 was 62.3 degrees, 3.1 degrees below normal. Weather stations recorded an average of 0.25 inches of precipitation, 0.59 inches below average. There were 6.1 days suitable for fieldwork during the week ending September 17.
While row crop progress remained behind the five-year average, favorable crop condition ratings exceeded previous year averages. Sixty-seven percent of corn was in or past dent and 22 percent was mature. Corn for silage was 42 percent harvested. Twenty-seven percent of soybeans were dropping leaves. Corn and soybean condition were 76 and 71 percent good to excellent, respectively. Third cuttings of alfalfa hay and other dry hay were 92 and 71 percent complete, respectively. Fourth cuttings of alfalfa hay were 56 percent complete. Winter wheat was 1 percent planted. Pasture and range condition was rated 63 percent good to excellent, down from the previous week.