
By: Gary Schnitkey, Jonathan Coppess, Krista Swanson, Nick Paulson, Department of Agricultural and Consumer Economics,University of Illinois and Carl Zulauf, Department of Agricultural, Environmental and Development Economics, Ohio State University
The National Agricultural Statistical Service (NASS) released county yields for 2018 (released March 21 on NASS’s Quick Stats website). With these NASS yields, fairly accurate estimates of 2018 Agricultural Risk Coverage at the county level (ARC-CO) payments can be made. We present U.S. maps showing estimated payments per base acre for corn, soybeans, and wheat. Estimates for Illinois also are presented in the final section.
Estimation Procedures
ARC-CO payments for 2018 will be made in October 2019. At this point, 2018 payments presented in this article are estimates. Actual payments will vary from those presented here for three reasons:
- Farm Service Agency (FSA) uses different yields than NASS when calculating ARC-CO payments. The NASS yield generally will be higher than the yield used by FSA. As a result, estimated payments presented here should be viewed as conservative. NASS does not make estimates of county yields for all counties in which ARC-CO are available. Where NASS data is not available, 2018 ARC-CO payment estimates are not presented in this article.
- Market Year Average (MYA) prices are not known because marketing years do not end until August for corn and soybeans and May for Wheat. MYA estimates are midpoints of World Agricultural and Supply Demand Estimates (WASDE) made in March: $3.55 per bushel for corn, $8.60 per bushel for soybean, and $5.50 per bushel for wheat. Higher prices will result in fewer counties receiving payments and lower payments in those counties receiving payments. Conversely, lower prices will result in more counties receiving payments and higher payments.
- Sequestration amounts may differ from those used here. The ARC-CO payments estimated here use the 6.8% sequestration reduction applied to the 2014 through 2017 payments.
ARC-CO is a revenue-based program where revenue equals the MYA price times the county yield. Variation in payments across counties occurs because of variations in county yields from benchmark yields. Those areas with county yields substantial above benchmark yields will have no ARC-CO payments. ARC-CO payments increase as the county yield falls relative to the benchmark yield, eventually reaching the cap equal to ten percent of benchmark revenue.
The following maps report payments on a per base acre basis. Payment acres are .85 of base acres and the .85 adjustment has been applied to payments presented in the following maps and table.
Corn
Most counties are not projected to receive ARC-CO payments in 2018 (see Table 1). In the eastern Corn Belt, no counties in Illinois, Indiana, and Ohio are projected to receive payments. In the western Corn Belt, scattered counties in Iowa, Minnesota, North Dakota, and South Dakota are projected to receive payments. Geographical areas with some concentration of counties receiving payments are eastern Kansas and Missouri, North Carolina, and Texas. (see Figure 1).
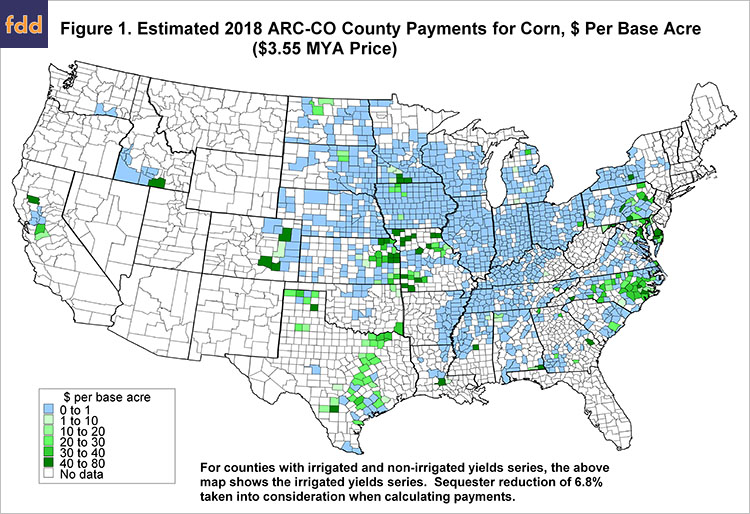
Fewer counties are receiving 2018 payments than in previous years (see farmdoc daily, October 16, 2018). ARC-CO uses five-year Olympic averages in calculating benchmark prices and benchmark yields. By design, benchmark prices will decline in periods of low MYA prices. As a result, benchmark prices used to set guarantees for corn have been coming down, resulting in fewer payments. Benchmark prices were $5.29 per bushel in 2014 and 2015, $4.70 in 2016, $3.96 in 2017, and $3.70 in 2018. The $3.70 price in 2018 is as low as the benchmark price can go as the benchmark price cannot go below the reference price of $3.70. Besides lower benchmark prices, many counties had exceptional yields in 2018.
Soybeans
Similar to corn, few areas are projected to receive ARC-CO payments for soybeans (see Figure 2). Within the Corn Belt there are scattered counties projected to receive payments. Geographical areas with some concentration of payments include western North Dakota, Missouri, and North and South Dakota.
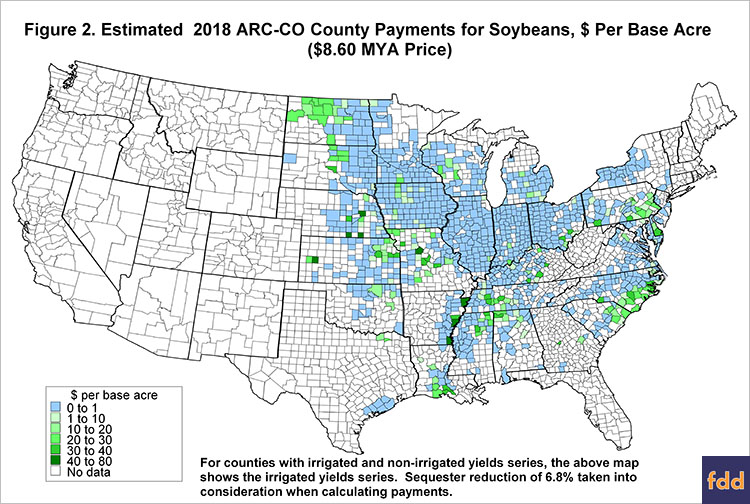
Similar to corn, benchmark prices for soybeans have been declining: $12.27 in 2014 and 2015, $11.87 in 2016, $10.86 in 2017, and $9.63 in 2018. Many counties had exceptional soybean yields in 2018, offsetting the decline in market price from $9.33 in 2017 to a projection of $8.60 in 2018.
Wheat
Geographical areas having a concentration of 2018 ARC-CO payments include Montana, North Dakota, South Dakota, Kansas, Oklahoma, Indiana, Ohio, Michigan, Virginia, and North Carolina (see Figure 3).
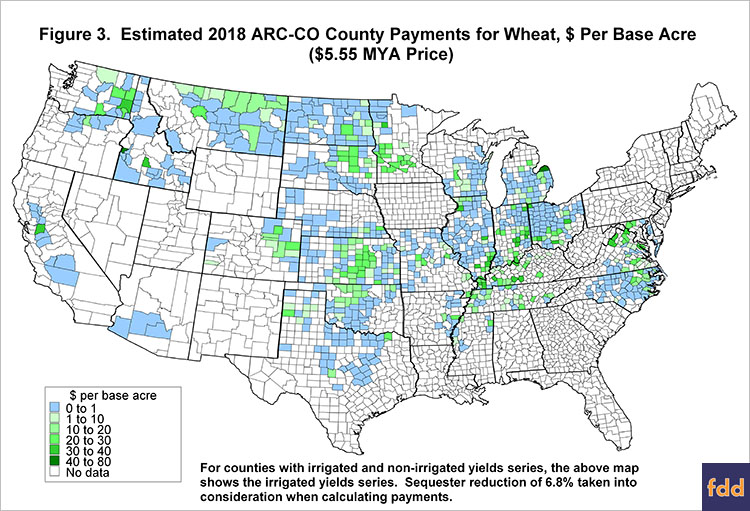
Similar to corn and soybeans, benchmark prices for wheat have been declining: $6.60 in 2014, $6.70 in 2015 and 2016, $6.12 in 2018, and $5.66 in 2018.
Summary
Because final yields and prices are not yet known, actual ARC-CO payments can vary from estimates shown in this article. ARC-CO will make pay in fewer counties for 2018 production. In many cases, payments will be lower as well.
References
NASS/USDA. Quick Stats. https://quickstats.nass.usda.gov/
Schnitkey, G., C. Zulauf, J. Coppess and N. Paulson. “2017 ARC-CO Payments and Outlook for 2018 Payments.” farmdoc daily (8):191, Department of Agricultural and Consumer Economics, University of Illinois at Urbana-Champaign, October 16, 2018.
U.S. Department of Agriculture, Office of the Chief Economist. World Agricultural Supply and Demand Estimates. March 8, 2019. https://www.usda.gov/oce/commodity/wasde/wasde0319.pdf