Hottest year on record, statistically speaking II

Last portfolio entry, I looked at the statistics showing that the odds of the earth’s warming trend since 1970 is random are infinitesimally small.  Today I’m going to look at the other side of that coin.

Climate scientists – and scientists in general – are dealing with mounds of complex data gathered from across the world in different ways.  For that reason, when they make a declaration that, for example, 2014 was the warmest year on record, or that “warming of the climate system is unequivocal,” they also like to quantify the confidence they have that the findings are true.

In the case of the announcement that 2014 is the warmest year on record, NOAA gave that a 48% probability and NASA gave it a 38% probability (source pdf).  On the face of it, this seems pretty low.  How can NOAA and NASA state 2014 is the warmest year with less than a 50% probability?

There are several ways this uncertainty is created.  First, there are multiple teams of scientists measuring temperatures around the world, and each may be taking readings from different weather stations or in slightly different ways.

Second, the historical record goes back to 1880, and in that time weather stations may have moved and procedures for measuring temperature may have changed.  Today’s scientists don’t have the scientists of 1900 to talk to – they have to rely on records left behind.

Gavin Schmidt, director of NASA’s Goddard Institute for Space Studies, said that any one year’s average temperature reading has an uncertainty of plus or minus 0.05 degrees C or 0.09 degrees F.

Then consider that the differences in average annual temperature we are talking about between 2014 and the next couple of hottest year contenders, 2005 and 2010, are tiny.  According to Dr. James Hansen, the former director of Goddard Institute for Space Studies:

The two agencies use slightly different methods, so they have different readings for the difference between 2014 and the previous warmest year, 2010, with N.O.A.A. putting it at 0.07 degrees Fahrenheit (0.04 degrees Celsius), while NASA got 0.036 degrees (0.02 Celsius) — which this analysis says is well “within uncertainty of measurement.” (source)

Because there are so many sources of uncertainty, it turns out that a 48% or 38% certainty that 2014 is the hottest year on record is actually pretty high.  The next most likely year is 2010, at 18%. This means that 2014 is a little more than 2.5 times more likely than 2010 to be the warmest on record.  That’s how scientists can say pretty definitely that 2014 is the hottest.

However, the 48%/38% certainty that 2014 is the hottest year on record did not escape the notice of climate skeptics – who really need to be called climate deniers because they spend their careers trying to discredit any science showing the earth is warming.

The Daily Mail published an article by David Rose, who held up the certainty figures for ridicule and acted as if NASA and NOAA had been trying to hide them, even though they were discussed publicly at the presentation of findings to the media.

Here the skeptics seem to be pouncing on an artifact of how science works which the public doesn’t understand, and playing it up in an effort to discredit the science.

While it might be only 48%/38% certain that 2014 is the warmest year ever, it is not uncertain that 2014 was among the warmest.  In fact, even with all the sources of uncertainty discussed above, scientists are 90.4% certain that 2014 is among the five warmest years, and 99.2% certain it is among the 10 warmest.

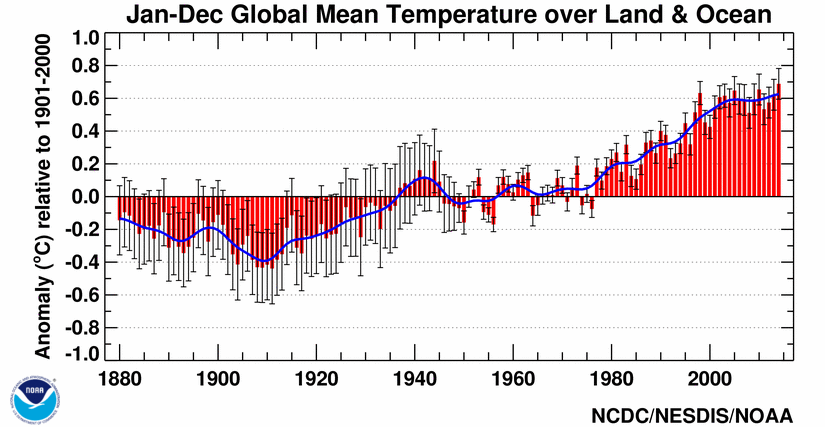
There’s also the matter of the warming trend shown in the graph from NOAA.  Whether or not 2014 sets a specific record – and indications are that it did – it is still a matter of direct observation that every year since 1978 has been warmer than average, and that temperatures are on a clear trend of increasing.

Taking scientific probabilities of certainty out of context and presenting them without any explanation of where they came from is a fundamental misrepresentation of the science.  But that is what the professional climate skeptics do, which is why the public is still so confused about climate change.

Further reading
Freedman, Andrew. Climate scientists rebuff skeptics’ arguments against 2014 ‘warmest year’ claim. Mashable. January 20, 2015.
Revkin, Andrew.  How ‘Warmest Ever’ Headlines and Debates Can Obscure What Matters About Climate Change. The New York Times. January 21, 2015.
Hottest year on record, statistically speaking

This week, NASA and NOAA announced both had calculated that 2014 was the hottest year on record for Earth.  This news was part of the ongoing public conversation about climate change, which is much more of a debate in the general public than among scientists, the vast majority of whom have come to the consensus that climate change is real, caused by humans, and an existential threat to our existence and the existence of millions of other species on the planet.

One reason it is news that 2014 is the hottest year on record is that so many recent years have also been among the hottest.  This is evidence for the reality of global climate change, which many of our current elected officials deny, and for it being caused by humans, which is even more controversial in public policy circles.  NOAA released this temperature graph:

NOAA temperatures


global-temp-and-co2-1880-2009Others have mapped levels of carbon dioxide onto the graph to show a strong correlative relationship.  This is from Greg Laden:

Either way, the graph shows a definite pattern from the time global temperatures started being recorded in 1880 to the present.  Since 1978 the Earth has not experienced a single year with a global temperature lower than the historical average.

Seth Borenstein, an AP science writer who I’ve been following since he was at the Miami Herald in the late 90s, wrote the main story about the NOAA and NASA announcement, including interviews with a number of climate scientists.  But he also wrote a very interesting sidebar to the story.  He decided to look at the statistical probability that the pattern of warming we see in the graphs above is random, occurring naturally, or if there is another explanation.

Borenstein talked to a number of statisticians who told him the following:

  • With global average temperature records spanning from 1880 to 2014, the odds of 2014 by itself being the warmest on record are 1 in 135.
  • The three hottest years on record — 2014, 2010 and 2005 — have occurred in the last 10 years. The odds of that happening randomly are 3,341 to 1.
  • Nine of the 10 hottest years on record have occurred in the 21st century. The odds of that being random are 650 million to 1.
  • Thirteen of the 15 the hottest years on record have occurred in the last 15 years. The odds of that being random are more than 41 trillion to 1.
  • All 15 years from 2000 on have been among the top 20 warmest years on record. They said the odds of that are 1.5 quadrillion to 1. A quadrillion is a million billion.
  • The last 358 months in a row have been warmer than the 20th-century average. The odds of that are so high — a number with more than 100 zeros — that there is no name for it.

Other than the first number, neither Borenstein nor the statisticians tell us how they made their calculations.  I assume they took the number of years in the historical record (135) and somehow multiplied this by the odds of each year considered being among the warmest.  For example, chances of the hottest three years being in the last decade would involve calculating the odds of each year being in the hottest three and of the last decade being among the hottest.

Although it would be interesting to see how the statisticians made these calculations, clearly something is going on in the earth’s climate that is way beyond random chance.  Climate scientists have considered a number of possibilities not discussed in this article, and ruled out all but human activity.  For example, it’s not the sun because the warmest temperatures are on the surface, not in the stratosphere, and the sun’s temperature has actually been cooling.  It is not natural cycles because those occur at a pace of hundreds of thousands of years, not decades.

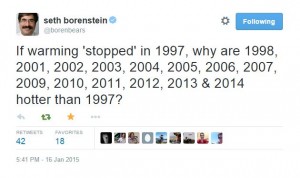
Borenstein global pauseYet despite this evidence, climate change deniers are still denying the science.  Rep. Dana Rohrbacher (R-Calif.) tweeted that the findings of NOAA and NASA were “yet more fraud.”  And climate deniers descended on Seth Borenstein’s Twitter page, repeating the claim that global warming “paused” in 1997. The temperature graphs show differently, but facts don’t seem to matter to a lot of these people.  Finally an exasperated Borenstein tweeted:

It certainly is a point worth considering.  And though steadfast deniers will never change their minds, there is a large confused public in the middle who can be educated and who need to start understanding the importance of acting on climate change.