Statistical error

Today in statistics we talked about Type I and Type I error.

Type 1 error is when you reject the null hypothesis when you should not have. You see an outlier in the data that turns out to be there by chance as part of the normal distribution, but you think it is not – you think it shows a cause and effect relationship between two variables.

Type II error is when you fail to reject the null hypothesis when you should have. You see a data point inside the normal distribution so you think it is there by chance when in actuality it reflects the pattern of a cause and effect relationship between two variables.

Type I error is the most talked about, probably because it’s easiest to measure. Statistics has a convention of seeking a 95% or 99% confidence level in your results. That means you are willing to accept a 5% or 1% threshold as an acceptable risk for making a Type I error, or for identifying a causal relationship in the data that turns out to be there by chance.

Type II error doesn’t really have any conventional measurements. In this scenario, there is a causal relationship between two variables, but because the data are within the realm of normal distribution, you think they are there by chance.

The effects of climate change are just such a Type II error, science historian Naomi Oreskes writes in a recent op-ed column in The New York Times. She argues that scientists are trained to be skeptical – to assume the null hypothesis of no relationship is right unless the researcher can show there is less than a 1 in 20 chance that the relationship is real.

Here the relationship is between putting carbon into the atmosphere mainly by burning fossil fuels, and the effects of climate change such as extreme weather, ocean acidification, etc.

Oreskes argues that because of its predilection toward skepticism, science has actually underestimated the effects of climate change. In 2009 in at the 15th Conference of Parties in Copenhagen, world leaders on the recommendation of scientists agreed on a maximum threshold of 2 degrees C as the “safe” limit for global warming.

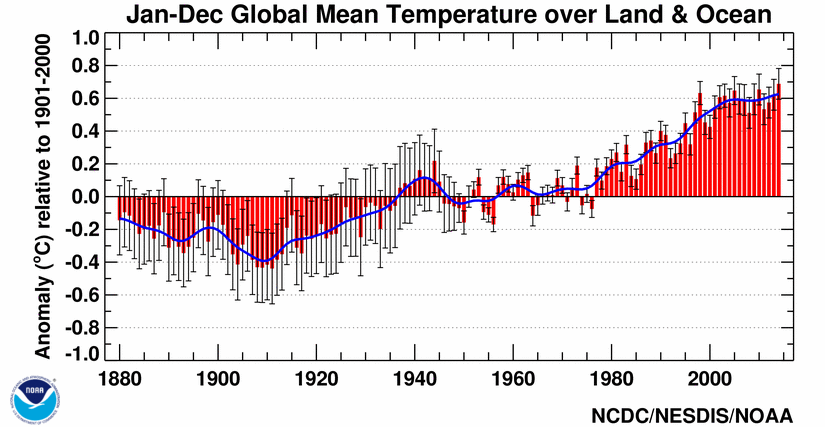
However, we are now at 0.8 degrees C and already seeing a lot of damage. Droughts and wildfires in California, superstorms, blizzards and floods in the East Coast and Midwest, coral reef dieoffs in the oceans, melting ice in Greenland and the Arctic – all these effects are happening much faster and more intensely than scientists predicted.

Is this an example of a Type II error? Maybe not technically in statistics, unless we are talking about a particular study. But it does bring out a general trend in science. Normally being skeptical pays off, because if there is a causal relationship, the results of ongoing research will back this up over time. The theory of evolution is an example of a hypothesis that has stood the test of time – decades of research have continued to add evidence making it stronger.

However, we don’t have a lot of time where climate change is concerned. Because carbon stays in the atmosphere for so long after we burn it – in 100 years half the carbon we put there today will still be there – we already have another degree of warming in the pipeline.

That combined with the warming we’ve already seen means there is not much time left to get a handle on the chief cause of climate change, fossil fuel consumption. And if the relationship between burning fossil fuels and all the effects of climate change we are seeing is actually stronger than we realized, we may have even less time than we think.

Itinerary for Costa Rica trip

Today I decided to get acquainted with the itinerary for the Costa Rica service learning trip.

Saturday March 14

  • Depart Columbus 6 a.m.
  • Arrive San Jose 1:09 p.m.
  • Head the EARTH University in Guacimo

We will be headquartered at EARTH University for much of the trip.  EARTH is a small university that teaches sustainable agriculture and development to 419 students from across Central America and around the world.  There are on-campus farms and laboratories.  Among other products, EARTH grows the whole trade bananas sold at Whole Foods.

Sunday March 15

  • Organic farm tour
  • Integrated husbandry system tour
  • Workshop on peri-urban agriculture

Monday, March 16

  • Travel to Parque Nacional Tortuguero
  • Service project – Beach cleanup

Parque Nacional Tortuguero, or Turtle National Park, is the world’s most important spawning ground for the green sea turtle, and an important site for leatherback, hawksbill, and loggerhead turtles.  Access is only by boat.

Tuesday, March 17

  • Time at Tortuguero
  • Travel to Guapiles

Guapiles is the transport center for the Rio Frio banana growing region, according to the Lonely Planet guide to Costa Rica.  There is a botanical garden and ecological farm. It’s also right next to Parque Nacionale Braulio Carrillo.

Wednesday, March 18

  • Nature reserve tour (maybe La Danta Salvaje?)
  • Banana plantation tour
  • Service activity (materials for chicken coop)

Thursday, March 19

  • Service activity – biodigester construction
  • Service projects – painting at Casa de la Mujer and farms tour

Friday, March 20

  • Community visit
  • Travel to Ciudad Quesada
  • Hot springs – Looking forward to this!

Saturday, March 21

  • Travel to San Jose airport
  • Visit markets / cultural sites on way
  • Lodging San Jose airport

Sunday, March 22

  • Depart San Jose 1:04 p.m.
Itinerary

Map of Costa Rica with destinations highlighted. Click to enlarge.


Some vital information

  • Money is the colon, plural colones. $1 = 537 colones
  • Costa Rica is in the Central time zone, but they don’t observe Daylight Savings Time, so they should be two hours behind Ohio time.
  • With all this movement all over the country, I am going to have to pack light. This is going to be a real challenge.
  • March is the dry season. The sun will be coming up about 6 a.m. and setting about 6 p.m.  Apparently at the equator, there’s no dawn or dusk.  It’s just dark then light or vice versa.  Temperatures will be around 80 during the day, 65 at night – awesome.  Apparently the sun is very strong, so sunscreen and a hat are recommended.
  • Electricity is 120V/60hz. I think that’s the same as what we use in the US.  Need to find out how possible it will be to charge electronic devices.  We are supposed to keep journals, but my handwriting has gotten so bad, I’d much rather type.
  • Mosquitoes look like a big problem. Will need powerful bug spray with DEET and a mosquito net.  One site recommended anti-malarial pills the entire time you are there and four weeks after you get back – wow.   Diarrhea remedy also recommended.  May need vaccines for typhoid, hepatitis A, and yellow fever.  Really don’t want to get sick on such a short trip.
  • Public restrooms are rare, but you can pay to use some facilities. Plumbing is bad, so people don’t flush toilet paper.  I’m worried about them even having toilet paper.  Using the bathroom could be the most awkward and complicated part of the trip.

Hottest year on record, statistically speaking II

Last portfolio entry, I looked at the statistics showing that the odds of the earth’s warming trend since 1970 is random are infinitesimally small.  Today I’m going to look at the other side of that coin.

Climate scientists – and scientists in general – are dealing with mounds of complex data gathered from across the world in different ways.  For that reason, when they make a declaration that, for example, 2014 was the warmest year on record, or that “warming of the climate system is unequivocal,” they also like to quantify the confidence they have that the findings are true.

In the case of the announcement that 2014 is the warmest year on record, NOAA gave that a 48% probability and NASA gave it a 38% probability (source pdf).  On the face of it, this seems pretty low.  How can NOAA and NASA state 2014 is the warmest year with less than a 50% probability?

There are several ways this uncertainty is created.  First, there are multiple teams of scientists measuring temperatures around the world, and each may be taking readings from different weather stations or in slightly different ways.

Second, the historical record goes back to 1880, and in that time weather stations may have moved and procedures for measuring temperature may have changed.  Today’s scientists don’t have the scientists of 1900 to talk to – they have to rely on records left behind.

Gavin Schmidt, director of NASA’s Goddard Institute for Space Studies, said that any one year’s average temperature reading has an uncertainty of plus or minus 0.05 degrees C or 0.09 degrees F.

Then consider that the differences in average annual temperature we are talking about between 2014 and the next couple of hottest year contenders, 2005 and 2010, are tiny.  According to Dr. James Hansen, the former director of Goddard Institute for Space Studies:

The two agencies use slightly different methods, so they have different readings for the difference between 2014 and the previous warmest year, 2010, with N.O.A.A. putting it at 0.07 degrees Fahrenheit (0.04 degrees Celsius), while NASA got 0.036 degrees (0.02 Celsius) — which this analysis says is well “within uncertainty of measurement.” (source)

Because there are so many sources of uncertainty, it turns out that a 48% or 38% certainty that 2014 is the hottest year on record is actually pretty high.  The next most likely year is 2010, at 18%. This means that 2014 is a little more than 2.5 times more likely than 2010 to be the warmest on record.  That’s how scientists can say pretty definitely that 2014 is the hottest.

However, the 48%/38% certainty that 2014 is the hottest year on record did not escape the notice of climate skeptics – who really need to be called climate deniers because they spend their careers trying to discredit any science showing the earth is warming.

The Daily Mail published an article by David Rose, who held up the certainty figures for ridicule and acted as if NASA and NOAA had been trying to hide them, even though they were discussed publicly at the presentation of findings to the media.

Here the skeptics seem to be pouncing on an artifact of how science works which the public doesn’t understand, and playing it up in an effort to discredit the science.

While it might be only 48%/38% certain that 2014 is the warmest year ever, it is not uncertain that 2014 was among the warmest.  In fact, even with all the sources of uncertainty discussed above, scientists are 90.4% certain that 2014 is among the five warmest years, and 99.2% certain it is among the 10 warmest.

There’s also the matter of the warming trend shown in the graph from NOAA.  Whether or not 2014 sets a specific record – and indications are that it did – it is still a matter of direct observation that every year since 1978 has been warmer than average, and that temperatures are on a clear trend of increasing.

Taking scientific probabilities of certainty out of context and presenting them without any explanation of where they came from is a fundamental misrepresentation of the science.  But that is what the professional climate skeptics do, which is why the public is still so confused about climate change.

Further reading
Freedman, Andrew. Climate scientists rebuff skeptics’ arguments against 2014 ‘warmest year’ claim. Mashable. January 20, 2015.
Revkin, Andrew.  How ‘Warmest Ever’ Headlines and Debates Can Obscure What Matters About Climate Change. The New York Times. January 21, 2015.

Environmental policy in Costa Rica

It’s been a long time since I’ve been outside the country.  In high school I did a school trip to Mexico to see various archaeological sites.  Between college and my first round of grad school, I did a six-week visit to Europe.  Half of it was spent visiting a friend and traveling in Germany, and the other half on one of those “If it’s Tuesday, it must be Belgium” trips.  It was exhausting but I did see a lot.

For one of my journalism jobs I attended a conference in Windsor, Canada, and later I visited my brother who was working at McGill University in Montreal.  I don’t really count Canada as leaving the country, but at least you need a passport.

Now that I’m in a degree-seeking program at Ohio State, I decided to look at study abroad opportunities.  Because of my job I needed something short term, and I wanted something related to the environment. So I picked a spring break service learning trip to Costa Rica, to find out more about what makes this country a leader in sustainability.

Here are some points about Costa Rica’s environmental policy:

  • Almost 30% of land in Costa Rica is in protected reserves, and the country produces more than 90% of its electricity through renewables such as hydroelectric, geothermal and wind. The government has long provided cash incentives for reforestation and sustainable timber projects.  As a result, forest cover grew from 21% in 1987 to 52% in 2005. (source pdf)
  • In 1997 Costa Rica passed a carbon tax of 3.5% (pdf) on all hydrocarbon fossil fuels. It was one of the first countries to pass such a tax.  The revenue goes toward the Payment for Environmental Services program, which offers incentives for property owners to practice sustainable development and conservation.
  • In 2009 Costa Rica set a goal of being the first carbon-neutral country in the world by 2021, though that has now been extended to 2025. The plan is to promote biofuels, hybrid vehicles and clean energy, and to offer a carbon-neutral label through which industry and tourists can pay $10 a ton to offset emissions.  The money would be used to fund conservation, reforestation and research in protected areas. I would definitely pay this for my flight there and back and my time in the country.

One interesting thing about Costa Rica is its Biodiversity Law.  The country is considered one of the Top 20 in the world for biodiversity.  It has more than 500,000 species, or almost 4% of species estimated worldwide.  Part of what makes this possible is its array of ecosystems from coasts to rainforests to mountains.  The other part is the legal framework.

The Biodiversity Law passed in 1998 set up the National Commission for Biodiversity Management (CONAGEBIO), which works with the National System of 11 Conservation Areas to administer the country’s natural resources.  The National Strategy for the Conservation and Sustainable Use of Biodiversity was created in 1999 to guide this management through a highly participatory process on the local and national levels.

One issue that has come up repeatedly is intellectual property rights.  International pharmaceutical and seed corporations want to come in and collect samples of Costa Rica’s biodiversity to use in drugs or crops that they can patent and sell.  Without property rights, they can’t make money, which is what they say allows them to develop and distribute these products.

Costa Rica’s Biodiversity Law, however, gives communities control over this intellectual property.  Communities don’t want to give up this knowledge to international corporations because then they feel they have lost control of the resource for very little compensation.  They think intellectual property rights don’t need to be granted for commercialization to take place.

However, this runs up against the WTO agreement which Costa Rica signed, which does allow corporations from other countries to take its biological resources.  It’s hard to see how this conflict can be resolved to the satisfaction of all.

A final point about Costa Rica: It has no standing army.  The military was abolished in 1948.  For a country that sits next to some places with pretty high levels of violence (Nicaragua, Honduras, El Salvador, Guatemala), that seems like an odd choice.  But Costa Rica hasn’t had a coup since, and it has spent the “peace dividend” on education and the environment.

The country does have a pretty strong police force, which it needs to deal with a drug trade moving north from South America.  It also has an ongoing border dispute with Nicaragua. But its spending on national defense is zero.

Maybe all of this – biodiversity, environment, and education – is why Costa Rica was recently named the happiest place on earth.

Hottest year on record, statistically speaking

This week, NASA and NOAA announced both had calculated that 2014 was the hottest year on record for Earth.  This news was part of the ongoing public conversation about climate change, which is much more of a debate in the general public than among scientists, the vast majority of whom have come to the consensus that climate change is real, caused by humans, and an existential threat to our existence and the existence of millions of other species on the planet.

One reason it is news that 2014 is the hottest year on record is that so many recent years have also been among the hottest.  This is evidence for the reality of global climate change, which many of our current elected officials deny, and for it being caused by humans, which is even more controversial in public policy circles.  NOAA released this temperature graph:

NOAA temperatures


global-temp-and-co2-1880-2009Others have mapped levels of carbon dioxide onto the graph to show a strong correlative relationship.  This is from Greg Laden:

Either way, the graph shows a definite pattern from the time global temperatures started being recorded in 1880 to the present.  Since 1978 the Earth has not experienced a single year with a global temperature lower than the historical average.

Seth Borenstein, an AP science writer who I’ve been following since he was at the Miami Herald in the late 90s, wrote the main story about the NOAA and NASA announcement, including interviews with a number of climate scientists.  But he also wrote a very interesting sidebar to the story.  He decided to look at the statistical probability that the pattern of warming we see in the graphs above is random, occurring naturally, or if there is another explanation.

Borenstein talked to a number of statisticians who told him the following:

  • With global average temperature records spanning from 1880 to 2014, the odds of 2014 by itself being the warmest on record are 1 in 135.
  • The three hottest years on record — 2014, 2010 and 2005 — have occurred in the last 10 years. The odds of that happening randomly are 3,341 to 1.
  • Nine of the 10 hottest years on record have occurred in the 21st century. The odds of that being random are 650 million to 1.
  • Thirteen of the 15 the hottest years on record have occurred in the last 15 years. The odds of that being random are more than 41 trillion to 1.
  • All 15 years from 2000 on have been among the top 20 warmest years on record. They said the odds of that are 1.5 quadrillion to 1. A quadrillion is a million billion.
  • The last 358 months in a row have been warmer than the 20th-century average. The odds of that are so high — a number with more than 100 zeros — that there is no name for it.

Other than the first number, neither Borenstein nor the statisticians tell us how they made their calculations.  I assume they took the number of years in the historical record (135) and somehow multiplied this by the odds of each year considered being among the warmest.  For example, chances of the hottest three years being in the last decade would involve calculating the odds of each year being in the hottest three and of the last decade being among the hottest.

Although it would be interesting to see how the statisticians made these calculations, clearly something is going on in the earth’s climate that is way beyond random chance.  Climate scientists have considered a number of possibilities not discussed in this article, and ruled out all but human activity.  For example, it’s not the sun because the warmest temperatures are on the surface, not in the stratosphere, and the sun’s temperature has actually been cooling.  It is not natural cycles because those occur at a pace of hundreds of thousands of years, not decades.

Borenstein global pauseYet despite this evidence, climate change deniers are still denying the science.  Rep. Dana Rohrbacher (R-Calif.) tweeted that the findings of NOAA and NASA were “yet more fraud.”  And climate deniers descended on Seth Borenstein’s Twitter page, repeating the claim that global warming “paused” in 1997. The temperature graphs show differently, but facts don’t seem to matter to a lot of these people.  Finally an exasperated Borenstein tweeted:

It certainly is a point worth considering.  And though steadfast deniers will never change their minds, there is a large confused public in the middle who can be educated and who need to start understanding the importance of acting on climate change.