Education and medical expenses are exempt from gifting rules

By: Robert Moore, OSU Extension

Gifting can be an important part of a farm transition plan but it is important to understand the tax implications of gifting.  Taxable gifts refer to the total value of gifts given to others during a calendar year, which may be subject to gift tax under the U.S. tax code.  These gifts can include various types of property, money, or assets.  The determination of taxable gifts considers the fair market value of the transferred assets and any applicable exclusions or deductions provided by the tax code.  Currently, an individual may gift up to $17,000 each year to an unlimited number of people.  These annual exclusion gifts are not subject to gift tax.  Gifts made in excess of $17,000 are either subject to gift tax or reduce the lifetime gift exclusion by the amount of the excess gift.  For a detailed discussion of gifting, see the Gifting Assets Prior to Death bulletin at farmoffice.osu.edu. 

In addition to direct gifts, the payment of a bill or expense on behalf of someone else is usually considered a gift.  However, there are two specific exceptions.  The IRS allows education expenses and medical expenses to be paid for someone without being considered a gift.  These exemptions may present opportunities for those who are limited by the $17,000 annual gift limit.

Education Expenses

Paying tuition directly to a school is not considered a taxable gift.  There are two important points to remember regarding tuition payment.  The tuition must be paid directly to the institution, the payment cannot go directly to the student.  Second, the exclusion applies only to tuition payments.  Other school-related expenses like books, supplies, and room and board costs are not eligible for this exclusion.

Consider the following example:  

Dale has a grandchild who attends Harvard.  The tuition at Harvard is very expensive and Dale would like to help his grandchild.  Dale sends a check to Harvard for $50,000 to be applied to tuition.  The $50,000 that Dale paid for his grandchild’s tuition is not considered a gift and therefore does not count toward the $17,000 annual exclusion gift.  Dale could still gift up to $17,000 directly to the grandchild and still not exceed the annual gift exclusion.   

Medical Care

Payments that qualify for the medical exclusion are those made directly to a healthcare provider, medical institution, or medical insurance company for someone’s benefit.  Transportation and lodging costs related to the person’s medical care can also be covered, but there are specific rules, so it is best to consult with a tax professional.  The payments must go directly to the care provider or insurance company, not to the individual receiving care, to avoid it being considered a taxable gift above the annual exclusion amount. 

Consider the following example:  

Waylon and his neighbor Tom are lifelong friends.  Tom is at Waylon’s house for dinner when he begins to have extreme stomach pain and nausea.  Waylon calls 911 and an ambulance takes Tom to the hospital.  Once at the hospital, Tom is rushed into surgery to have his appendix removed.  A few weeks later, Tom receives a bill from the hospital for $25,000.  Waylon knows Tom has been down on his luck financially and he does not want Tom stressed about the cost of the life-saving surgery.  Waylon pays the full $25,000 directly to the hospital for Tom’s surgery.  Additionally, Waylon gifted Tom $10,000 to help cover his lost wages while he recovered.  By using a combination of the medical expense exemption and the annual gift exclusion, Waylon was able to help out Tom with $35,000 without having to pay gift taxes or adversely affecting the lifetime gift exemption.

Estate Planning Implications

Farmers who may wish to transfer wealth to others during their life should keep in mind the annual gift exclusion and the education and medical payment exclusion.  These strategies allow money or other assets to be transferred without negative gift or estate tax implications.  Using these exclusions can help farmers plan their estates by passing on assets, supporting education, and managing healthcare expenses with fewer tax issues. 

Weekly Commodity Market Update

Brownfield’s Weekly Commodity update featuring former OSU Extension Ag Economist Ben Brown.

This Week’s Topics:

  • Market recap
  • Corn, soybean production estimates drop
  • Chinese soybean stock changes
  • Wheat exports
  • Record soybean crush
  • Reports to watch

Market recap (Changes on week as of Monday’s close):

  • December 2023 corn up $.02 at $4.90
  • December 2024 corn up $.01 at $5.17
  • November 2023 soybeans up $.22 at $12.86
  • November 2024 soybeans up $.05 at $12.55
  • December soybean oil up 2.97 cents at 55.90 cents/lb
  • December soybean meal up at $390.20/short ton
  • December 2023 wheat up $.05 at $5.77
  • July 2024 wheat down $.06 at $6.34
  • November WTI Crude Oil up $1.10 at $85.70/barrel

Weekly Highlights

  • US crude oil stocks excluding the strategic petroleum reserve increased 427 million gallons on the week while gasoline, distillate, and ethanol stocks all declined.
  • Ethanol production declined just slightly week over week- down 2 million gallons to 295. However, US gasoline consumption was up nearly 7% during the first week over October. With the increase in use and the moderate decline in production ethanol stocks declined 15 million gallons.
  • It was a neutral week for US ag export sales. Corn sales were roughly half what they were the week prior but slightly above all expectations while soybeans also cleared rather low expectations. Soft red winter wheat export sales continue to support the wheat complex on global price competitiveness.
  • USDA cut both US corn and soybeans national average yields in October by 0.8 and 0.5 bushels respectively. For both, the decrease in production was either partially or fully offset with declines in demand categories.
  • The most surprising number in Thursday Supply and Demand Report came from the global soybean balance sheet where a drop in Chinese beginning stocks and an increase in expected feed use helped create a bullish global ending stocks picture.
  • Open interest in Chicago corn and soybean futures and options positions increased week over week. Producer and merchants doubled their short position of corn contracts while slightly selling soybean contracts.
  • Managed money traders bought back 46.7 thousand positions of Chicago corn to shrink their net short- this was someway surprising after daily estimates had estimated they would increase their net short.
  • USDA Ag Export Inspections were bullish for soybeans while bearish for corn. At nearly 74 million bushels, soybean exports were the highest since early January.
  • The National Oilseed Processors Association reported their members crushed 165.5 million bushels of soybeans in September- setting a new record for the month of September. Soybean oil stocks fell to its lowest level since December 2014.
  • Harvest production in the US moved along this week- corn was up 11% to 45% and soybean harvest was up 19% to 43%.

Farm Office Live to be held on October 20 at 10:00 a.m.

The OSU Extension Farm Office Team is pleased to be offering a “Farm Office Live” Zoom webinar on Friday, October 20 from 10:00 to 11:30 a.m.

This month’s webinar will feature the following topics:

  • Federal Farm Program Assistance Update
  • Legislative Update
  • A Look at Upcoming Farm Management Programs
  • Crop Input Outlook for 2024
  • Handing an Insurance Claim
  • Farm Bill Update

Featured Farm Office Team members include Bruce Clevenger, Jeff Lewis, David Marrison, Eric Richer, and Barry Ward.

To register for this program (or to access replays of previous programs):

go.osu.edu/farmofficelive

More information about this program can be accessed at farmoffice.osu.edu

Weekly Commodity Market Update

Brownfield’s Weekly Commodity update featuring former OSU Extension Ag Economist Ben Brown.

This Week’s Topics:

  • Market recap
  • Crude oil price swings
  • USDA report preview
  • Corn ending stocks
  • U.S. export positioning
  • Reports to watch


Market recap (Changes on week as of Monday’s close):

  • December 2023 corn flat at $4.88
  • December 2024 corn down $.01 at $5.16
  • November 2023 soybeans down $.13 at $12.64
  • November 2024 soybeans down $.17 at $12.50
  • December soybean oil down 3.5 cents at 53.93 cents/lb
  • December soybean meal down flat at $374.60/short ton
  • December 2023 wheat up $.08 at $5.72
  • July 2024 wheat up $.09 at $6.40
  • November WTI Crude Oil down $2.64 at $84.60/barrelWeekly Highlights
  • It was announced last week that the Argentina Government will expected their “soy dollar” program through October 25
  • US Crude oil stocks minus the strategic petroleum reserve fell another 93 million gallons this week along with distillate stocks, while gasoline stocks were up 272 million gallons.
  • Ethanol production was flat at 297 million gallons produced on the week using an estimated 99.9 million bushels of corn.
  • It was a solid week for agricultural export sales last week with corn and soybeans at the top end of their respective expectations and highest weekly volumes since April and January, respectively.

Weakening Crop Prices and High Production Costs Weigh on Farmer Sentiment

Source: James Mintert and Michael Langemeier, Purdue Center for Commercial Agriculture

Click here to listen

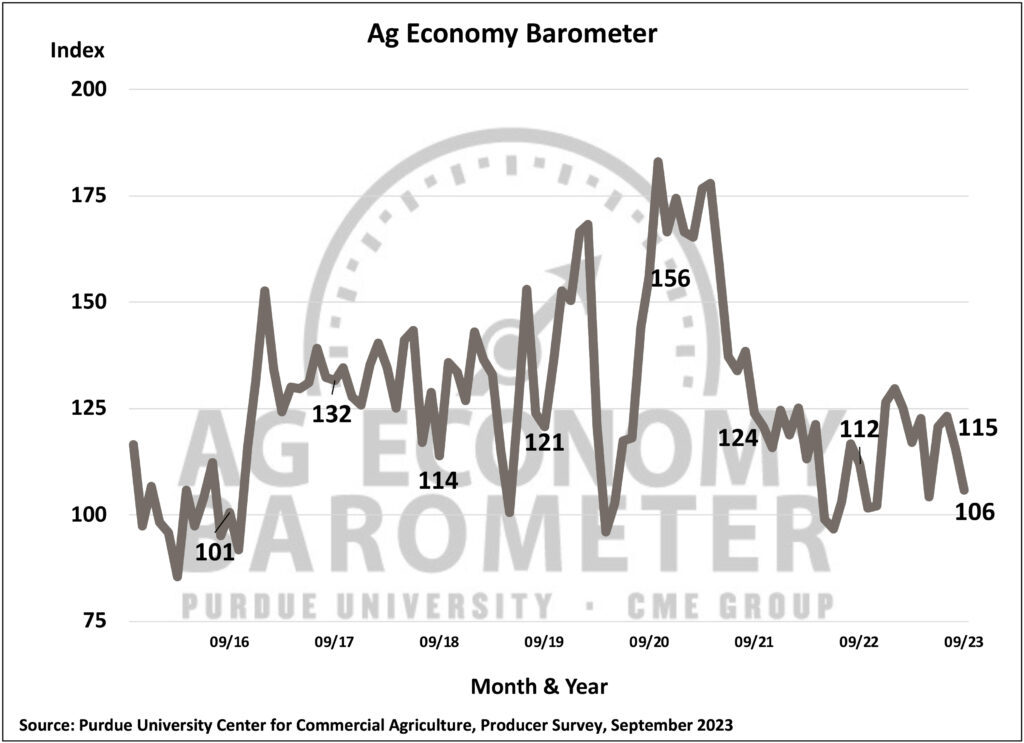
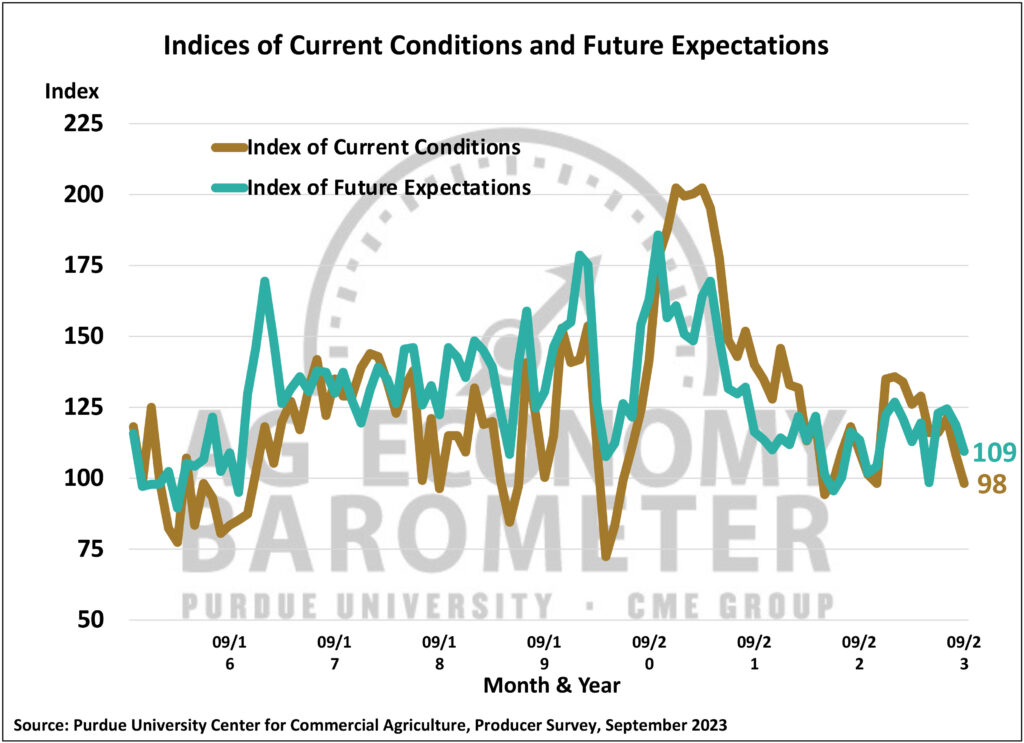
Agricultural producers’ sentiment declined for the second month in a row during September as the Purdue University-CME Group Ag Economy Barometer fell 9 points to a reading of 106. Producers expressed concern about both their current situation as well as future prospects for their farms. The Current Conditions and Futures Expectations Indices both declined 10 points in September leaving the Current Conditions Index at a reading of 98 while the Future Expectations Index stood at 109. Weakening prices for major crops and ongoing concerns about high production costs and interest rates weighed on producers’ minds this month. September’s declines left all three indices below year-ago levels. This month’s Ag Economy Barometer survey was conducted from September 11-15, 2023.

Figure 1. Purdue/CME Group Ag Economy Barometer, October 2015-September 2023.
Figure 1. Purdue/CME Group Ag Economy Barometer, October 2015-September 2023.
Figure 2. Indices of Current Conditions and Future Expectations, October 2015-September 2023.

Read More Here


Weekly Commodity Market Update

Brownfield’s Weekly Commodity update featuring former OSU Extension Ag Economist Ben Brown.

This Week’s Topics:

  • Market recap
  • U.S. grain stocks adjustments
  • U.S. harvest
  • Corn and soybean storage
  • Reports to watch

Market recap (Changes on week as of Monday’s close):

  • December 2023 corn up $.07 at $4.88
  • December 2024 corn up $.08 at $5.17
  • November 2023 soybeans down $.20 at $12.77
  • November 2024 soybeans up $.06 at $12.67
  • December soybean oil flat at 57.43 cents/lb
  • December soybean meal down $15.50 at $374.30/short ton
  • December 2023 wheat down $.25 at $5.64
  • July 2024 wheat down $.12 at $6.31
  • November WTI Crude Oil down $2.38 at $87.24/barrel

Weekly Highlights

  • For the most recent week of data- US crude oil stocks were down (-91 mil. gals) while US gasoline (+43.1 mil. gal.), Distillate (16.7 mil. gal.) and ethanol (16.7 mil. gal.) were all up.
  • Ethanol production rebounded to 297 million gallons produced on the week using an estimated 99.9 million bushels of corn.
  • US Ag Export sales were up for most commodities week over week including corn, soybeans, grain sorghum, and all wheats. US wheat sales were bullish coming in above pre-report estimates.
  • It was the third consecutive week producers and merchants decreased their net short in Chicago futures and options positions by more than 40%- this week 49%. Producers and merchants also reduced the net long in soybeans for the fourth consecutive week.
  • Managed money traders of Chicago commodities were mixed. They were net buyers of wheats and net sellers of corn and soybeans.
  • Weekly ag export inspections were down week over week for corn and wheat, but up week over week for soybeans and grain sorghum. All were within pre-report trade expectations.
  • US Grain stocks on September 1 were all within trade expectations but toward the top end for soybeans and below the average trade guess for corn. Both corn and soybean stocks were down from September 1, 2022.
  • The quarterly Hogs and Pigs report showed that there were 74.3 million hogs and pigs in the US- up slightly from last September.
  • Soybeans crushed for crude oil in August was 169 million bushels- down from 183 million in July, 175 million last August and pre-report expectations of 171.6 million bushels.
  • Corn crushed in August totaled 490 million bushels- below July 2023 but up 1% from August 2022. Corn for fuel alcohol at 443 million bushels, was down 3% from July but up 3% from last August.
  • US corn harvest is now 23% complete with corn crop conditions showing some slight improvement as combines roll along. Weekly increases were pretty consistent across the country.
  • US soybean harvest is now 23% complete up 11% week over week. Conditions improved on the week after declining last week.
  • 40% of the Winter wheat crop has been planted so far- slightly ahead last years pace but behind the average pace.

The Rising Costs of Corn Production in Illinois

Source: Farmdoc daily, University of Illinois, (edited)

While this article is written for Illinois, many if not all of these thoughts are pertinent in Ohio as well.

Significant increases in production costs in recent years combined with expectations for lower commodity prices have resulted in much lower return expectations for 2023 and 2024 compared with the previous three years (see farmdoc dailyAugust 29, 2023). In today’s article, we revisit trends in direct costs for corn production in Illinois over time (see farmdoc dailyApril 4, 2023 and July 12, 2016, for previous articles).  Since 2000, direct costs – which include production inputs – have risen at an average annualized rate of 7% per year.  Individual components of direct costs, such as fertilizers, pesticides, and seeds, have all experienced similar average growth rates.

Total direct costs are projected to reach record levels for 2023 and are expected to experience only modest declines for 2024.  Fertilizer costs are projected at record levels for 2023, but a fairly large decline is expected for 2024. Seed costs are projected at record levels for 2023 and remain constant in 2024.  Pesticide costs are projected to be at record levels for 2023 and to further increase for 2024. In addition to viewing these costs on a $ per acre basis, we also provide perspective on a share of revenue basis.

Total Direct Costs

Direct costs include the cost of production inputs such as fertilizers, seeds, and pesticides (herbicides, pesticides, fungicides). Costs associated with drying, storage, and crop insurance are also included in the direct cost category.  Total direct costs for corn production in central Illinois have increased over time from $134 per acre in 2000 to $558 in 2022 (see Figure 1), which implies an average annualized growth rate of 7% between 2000 and 2022.  Direct costs for the 2023 crop year are projected at a record level of $579 per acre, with a decline to $527 per acre currently expected for the 2024 crop year based on recently released crop budgets (see farmdoc dailyAugust 29, 2023 and 2024 Illinois Crop Budgets) and Ohio Crop Enterprise budgets.

Click here for the full article

Weekly Commodity Market Update

Brownfield’s Weekly Commodity update featuring former OSU Extension Ag Economist Ben Brown.

This Week’s Topics:

  • Market recap
  • U.S. harvest overview
  • U.S. wheat planting
  • Ukraine production estimate up
  • The Fed holds interest rates steady… but
  • Reports to watch

Market recap (Changes on week as of Monday’s close):

  • December 2023 corn up $.10 at $4.81
  • November soybeans down $.19 at $12.97
  • October soybean oil down 3.64 cents at 58.75 cents/lb
  • October soybean meal up $1.60 at $392.00/short ton
  • December 2023 wheat down $.02 at $5.89
  • July 2024 wheat up $.03 at $6.43
  • September WTI Crude Oil up $0.36 at $89.62/barrelWeekly Highlights
  • US energy stocks dropped across the board this week: crude oil (-90 million gallons), gasoline (35 million gallons), and distillate supplies (-120 million gallons).
  • Ethanol production dropped 17 million gallons to 288 million gallons on the week- the lowest volume in nearly 5 months.
  • The Federal Reserve kept short term rates at a range between 5.25-5.5 during their September meeting.
  • It was a disappointing week for US ag export sales. Corn and wheats were on the low end of trade expectations while soybean sales were below the most bearish estimate. The deficit for export sales is growing fast.
  • Open interest positions of Chicago commodities were mostly up again this week. Corn, soybeans, soybean meal, and wheats saw increases. Rough rice and soybean oil were down.
  • Similar to last week, producers and merchants were active buyers of Chicago corn on the week decreasing their net short position of futures and options by nearly 42% after 42% the week before. Conversely, managed money traders were net sellers increasing their net short by nearly 10,000 positions. For soybeans, producers and merchants sold off 17.6% of their net long position with money managers also shedding 28,000 positions.
  • Friday afternoon’s USDA Cattle on Feed Report showed all US cattle on feed as of September 1 at 11.094 million head, or 97.8% of last year. The estimate was just above the average trade estimate of 97.7%. August placements were higher while marketings were lower.
  • US agricultural export inspections were up week over week for soybeans and wheat, but down for corn and grain sorghum. All were within trade expectations.
  • US corn harvest is now 15% complete with corn crop conditions showing some slight improvement as combines roll along. While it is unlikely that precipitation is having an impact on crop conditions at this point in the season- yield monitors (or reports from monitors) might. Illinois and Iowa both saw noticeable increases.
  • US soybean harvest is now 12% complete up 7% week over week. Conditions declining only slightly.
  • 26% of the Winter wheat crop has been planted so far- slightly behind last years pace and the average pace. Plantings are being the most in the eastern corn belt due to slow fall harvest. This is where most of the soft red winter wheat is planted.

A Comparison of Business Entities Available to Ohio Farmers

By: Robert Moore, Barry Ward, OSU Extension

Ohio farmers have many choices when selecting a business entity for their farming operations. Choosing the right entity is important, as it can impact issues such as how the business functions, ownership rights, personal liability, and taxation. What should a farmer consider when deciding which type of entity to use for a business? We provide an overview of business entities used for farm operations in this bulletin, compare ten important factors to consider when making the entity selection decision, and highlight the advantages of using a formal business entity. A Business Entity Comparison Chart at the end of the publication summarizes entity characteristics. As with all legal issues, consultation with an attorney is critical to making a successful decision.

Types of business entities

Sole Proprietorship. A Sole Proprietorship is a business owned by a single person who is referred to as the “sole proprietor.” The sole proprietor and the business are one and the same—there is no separate legal business entity. The sole proprietor owns all business assets, is responsible for all liabilities, and reports income as individual income.

Partnership. A partnership exists when two or more individuals or “partners” jointly own and conduct a business for profit. A “General Partnership” consists of partners who each have management authority and personal liability for the partnership and who report income from the partnership as individual income. A different type of partnership, the “Limited Partnership,” allows investors to enter a partnership as “limited partners” without involving them in management and exposing them to personal liability for the partnership.

Click here to read more.


Weekly Commodity Market Update

Brownfield’s Weekly Commodity update featuring former OSU Extension Ag Economist Ben Brown.

This Weeks Topics:

  • Market recap
  • USDA WASDE review
  • Tightness in soybean market
  • Soybean crush down
  • Harvest picks up
  • Reports to watch

Market recap (changes on week as of Monday’s close):
• December 2023 corn down $.14 at $4.71
• November soybeans down $.53 at $13.16
• October soybean oil up 1.05 cents at 62.39 cents/lb
• October soybean meal down $15.60 at $390.40/short ton
• December 2023 wheat up $.07 at $5.91
• July 2024 wheat up $.03 at $6.40
• September WTI Crude Oil up $3.41 at $89.28/barrel

Continue reading