This section of the research and development process was to introduce the team to the MATLAB GUI (Graphical User Interface) that can be used to evaluate and properly interpret AEV performance during runs. This tool can download data from the run from the Arduino, do analysis calculations in the form of several variables, and plot the results. Below are the plots for the data we collected on a test run.
Energy Vs. Time
In this plot, from 0 to 4 seconds, the motors were accelerating from 0 percent to 25%. The motors then ran at a constant power of 25 percent for 1 second, and then at a constant power of 20 percent for 2 seconds. The motors were then reversed and ran at a constant speed of 25 percent power for two seconds. The motors were then all braked and slowed to a stop in the remainder of the plot.
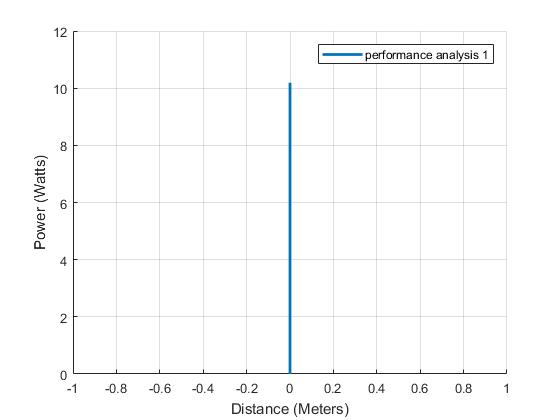
In this plot, the vehicle was not able to overcome the static friction between its wheels and the track, so the Power versus Distance plot did not detect anything other than the equilibrium position of 0.
The code for the Data Analysis lab is available here.

