Ohio Crop Progress


Seventy-nine percent of corn was in or past dough, and 30 percent of Ohio corn was in or past dent. Ninety percent of soybeans were setting pods. Corn and soybean condition were 79 and 76 percent good to excellent, respectively. Second cuttings of other hay were 88 percent complete. Third cuttings of alfalfa hay and other dry hay were 69 and 44 percent complete, respectively. Pasture and range condition was rated 66 percent good to excellent, up from the previous week.

Farm Real Estate Values and Cash Rents

Source: USDA

The 2023 average Ohio farm real estate value, including land and buildings, averaged $7,800 per acre, according to Ben Torrance, State Statistician of the USDA, NASS, Ohio Field Office.

Farm real estate values in Ohio were up 8.3 percent from 2022. Ohio is in the Corn Belt region, which also includes Illinois, Indiana, Iowa, and Missouri. The Corn Belt region value was $8,100 per acre, up 7.1 percent from 2022. The value of farmland in States bordering Ohio were: Indiana, $9,100 per acre; Kentucky, $4,700 per acre; Michigan, $6,400 per acre; Pennsylvania, $7,610 per acre; and West Virginia, $3,200 per acre.

Ohio’s cropland value was $8,200, an increase of 8.6 percent from the previous year. The Corn Belt region experienced a 7.7 percent increase to $8,540 per acre. The average value of cropland in the United States increased 8.1 percent from 2022 to $5,460 per acre. Ohio’s pasture value was $3,700 per acre, up 2.8 percent from 2021.

Ohio’s cropland cash rent was $178 per acre in 2023, up $8.00 from the previous year. Cropland cash rents in the Corn Belt region increased $13.00 from last year to $236 per acre. The cropland cash rents in the States bordering Ohio were: Indiana, $226 per acre; Kentucky, $168 per acre; Michigan, $148 per acre; Pennsylvania, $107 per acre; and West Virginia, $45 per acre.

Pasture cash rents in the Corn Belt region increased $1.00 to $42.50 per acre. Pasture cash rent in the United States was $15.00 per acre.

Click here to download the report

Determining a Fair Cash Rent Value in Knox County


Farmers Remain Cautiously Optimistic About Agricultural Economy

Source: James Mintert and Michael Langemeier, Purdue Center for Commercial Agriculture

Click here to download the full report.

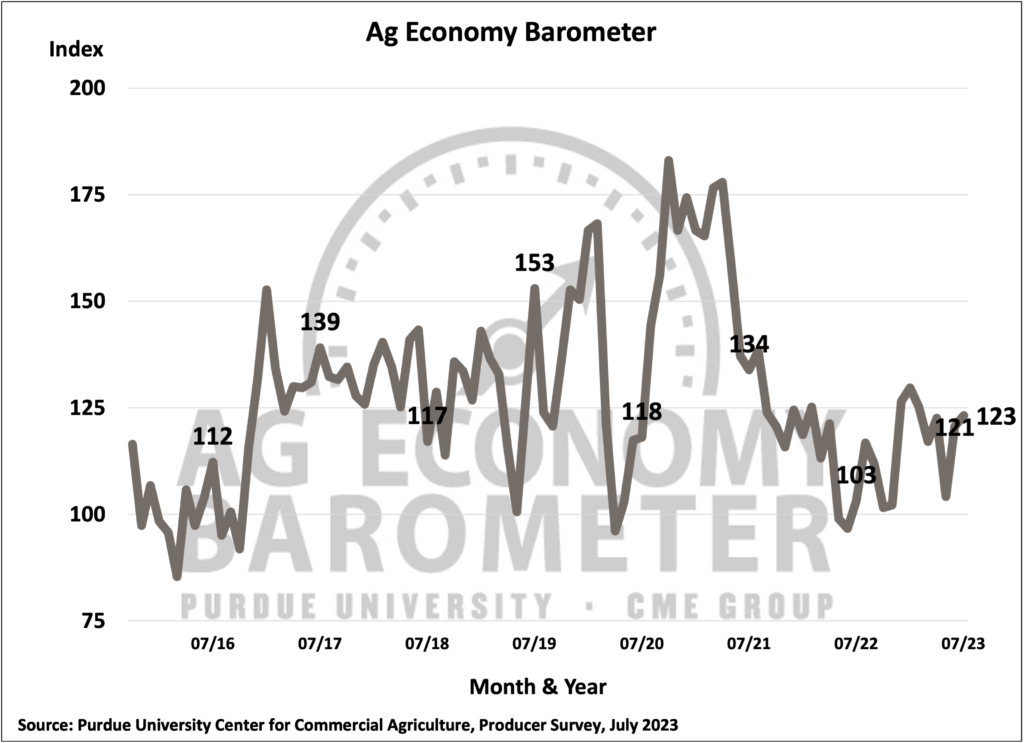
Agricultural producer sentiment improved slightly in July as the Purdue University-CME Group Ag Economy Barometer rose two points above its June reading to an index value of 123. This month’s two-percent rise in the barometer was primarily the result of farmers’ improved perception of current conditions on their farms as the Index of Current Conditions rose 5 points to a reading of 121. The Index of Future Expectations changed little compared to June, rising just one point to 124. This month’s Ag Economy Barometer survey was conducted from July 10-14, 2023.

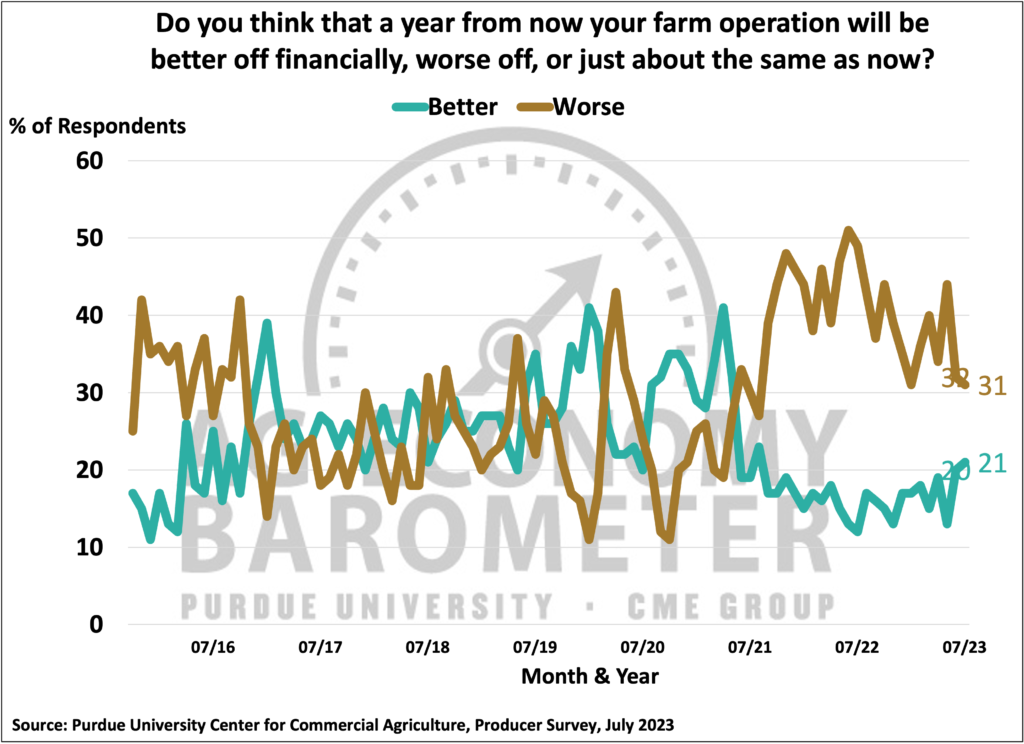
Farmers’ rating of financial conditions on their farms was virtually unchanged in July, compared to June, as the Farm Financial Conditions Index rose just one point to 87 vs. a reading of 86 in June. Looking back to May, however, the percentage of producers rating their farm’s financial performance as better than last year improved from 14% to 17%, while those rating financial performance as worse than a year ago fell from 38% to 30% of respondents. When asked to look ahead one year, there was a one percentage point increase in farmers expecting farm financial conditions to improve in July vs. June and, correspondingly, a one-point decline in the percentage of farmers expecting conditions to worsen. And farmers’ longer-term perspective on the U.S. agricultural economy improved somewhat in July, as the percentage of respondents expecting bad times in the upcoming 5 years fell from 41% in June to 39% in July.

Figure 1. Purdue/CME Group Ag Economy Barometer, October 2015-July 2023.
Figure 1. Purdue/CME Group Ag Economy Barometer, October 2015-July 2023.
Figure 2. Indices of Current Conditions and Future Expectations, October 2015-July 2023.
Figure 2. Indices of Current Conditions and Future Expectations, October 2015-July 2023.
Figure 3. In a year, will your farm operation be better off financially, worse off, or about the same as now?, October 2015–July 2023
Figure 3. In a year, will your farm operation be better off financially, worse off, or about the same as now?, October 2015–July 2023

Continue reading Farmers Remain Cautiously Optimistic About Agricultural Economy

Weekly Commodity Update

Brownfield’s Weekly Commodity update featuring former OSU Extension Ag Economist Ben Brown.  This week, Will and Ben discuss ethanol production and continued interest rate pressure.

Topics:
– Market recap
– Corn demand, ethanol production up
– Export sales remain unimpressive
– Federal Reserve action moving forward
– U.S. crop conditions
– Reports to watch

Market recap (Changes on week as of Monday’s close):
– September corn down $.49 at $5.04
– December 2023 corn down $.43 at $5.13
– September soybeans down $.83 at $13.70
– November soybeans down $.75 at $13.31
– September soybean oil down 5.10 cents at 63.11 cents/lb
– September soybean meal down $6.60 at $423.80/short ton
– September 2023 wheat 80 $.80 at $6.65
– July 2024 wheat down $.73 at $6.91
– June WTI Crude Oil up $3.51 at $81.88/barrel

Weekly Highlights
• Finally, one part of US corn demand is showing some life. US weekly ethanol production rose to a 28-month high last week at 322 million gallons.
• The Federal Reserve raised interest rates by a quarter of a percentage point on Wednesday, citing still elevated inflation as a rationale for what is now the highest US central bank policy rate in 16 years.
• Weekly US agricultural export sales were neutral last week with corn, soybeans and collective wheats up week over week. Sorghum was down week over week. Everything was within expectations.
• Open interest positions were down for corn (-2.8%), soybeans (-0.5%), soybean oil (-6.6%), and soybean meal (-0.1%) while being up for cotton (+11.5%), and rough rice (+15.3%).
• In the wake of renewed Russian attacks in Ukraine money managers bought back 73,529 positions of Chicago corn giving the commodity a net long while producers and merchants were sellers of 47,896 contracts. Managed money traders added 24,925 positions to their already long position while producers and merchants sold another 33,410 positions.
• US agricultural export inspections were on the higher end of all expectations and relatively strong compared to recent weeks. Wheat exports exceeded all pre-report expectations.
• US crop conditions largely fell more than market traders had expected this week. Corn and soybeans were down 2% while spring wheat was down 7% all compared to an expected 1% week over week decline, cotton fell 5%.
• 80% of the US winter wheat crop has been harvested compared to 81% at this time last year and a three-year average of 83%.

Corn Outlook Update Following USDA’s June WASDE Report

Purdue ag economists James Mintert and Nathanael Thompson discussed the updated corn outlook following USDA’s June World Ag Supply and Demand Estimates (WASDE) report on the latest Purdue Commercial AgCast video podcast. The latest corn crop condition ratings were discussed along with implications for 2023 U.S. corn yield, production and carryover stocks. Corn export prospects were also featured with a comparison to South American and Black Sea region exports. The discussion concluded with an overview of corn basis and basis forecasts using the recently revamped Purdue Crop Basis Tool.