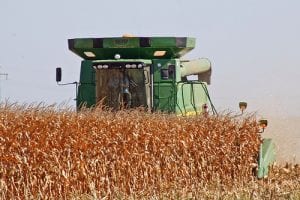
Corn Grain Test Weight

Source: R.L. Nielsen, Purdue Univ. (edited)

Among the top 10 most discussed (and cussed) topics at the Chat ‘n Chew Cafe during corn harvest season is the grain test weight being reported from corn fields in the neighborhood. Test weight is measured in the U.S. in terms of pounds of grain per volumetric “Winchester” bushel. In practice, test weight measurements are based on the weight of grain that fills a quart container (37.24 qts to a bushel) that meets the specifications of the USDA-FGIS (GIPSA) for official inspection (Fig. 1). Certain electronic moisture meters, like the Dickey-John GAC, estimate test weight based on a smaller-volume cup. These test weight estimates are reasonably accurate but are not accepted for official grain trading purposes.

The official minimum allowable test weight in the U.S. for No. 1 yellow corn is 56 lbs/bu and for No. 2 yellow corn is 54 lbs/bu (USDA-GIPSA, 1996). Corn grain in the U.S. is marketed on the basis of a 56-lb “bushel” regardless of test weight. Even though grain moisture is not part of the U.S. standards for corn, grain buyers pay on the basis of “dry” bushels (15 to 15.5% grain moisture content) or discount the market price to account for the drying expenses they expect to incur handling wetter corn grain.

Growers worry about low test weight because local grain buyers often discount their market bids for low test weight grain. In addition, growers are naturally disappointed when they deliver a 1000 bushel (volumetric bushels, that is) semi-load of grain that averages 52-lb test weight because they only get paid for 929 56-lb “market” bushels (52,000 lbs ÷ 56 lbs/bu) PLUS they receive a discounted price for the low test weight grain. On the other hand, high test weight grain makes growers feel good when they deliver a 1000 bushel semi-load of grain that averages 60 lb test weight because they will get paid for 1071 56-lb “market” bushels (60,000 lbs ÷ 56 lbs/bu).

These emotions encourage the belief that high test weight grain (lbs of dry matter per volumetric bushel) is associated with high grain yields (lbs. of dry matter per acre) and vice versa. However, there is little evidence in the research literature that grain test weight is strongly related to grain yield.

Hybrid variability exists for grain test weight, but does not automatically correspond to differences in genetic yield potential. Grain test weight for a given hybrid often varies from field to field or year to year, but does not automatically correspond to the overall yield level of an environment.

Similarly, grain from high yielding fields does not necessarily have higher test weight than that from lower yielding fields. In fact, test weight of grain harvested from severely stressed fields is occasionally higher than that of grain from non-stressed fields, as evidenced in Fig. 2 for 27 corn hybrids grown at 3 locations with widely varying yield levels in Kansas in 2011. Another example from Ohio with 22 hybrids grown in common in the drought year of 2012 and the much better yielding year of 2013 also indicated no relationship between yield level and grain test weight (Fig. 3).

Conventional dogma suggests that low test weight corn grain decreases the processing efficiency and quality of processed end-use products like corn starch (U.S. Grains Council, 2018), although the research literature does not consistently support this belief. Similarly, low test corn grain is often thought to be inferior for animal feed quality, although again the research literature does not support this belief (Rusche, 2012Simpson, 2000Wiechenthal Pas et al., 1998). Whether or not low test weight grain is inferior to higher test weight grain may depend on the cause of the low test weight in the first place.

Common Causes of Low Grain Test Weight

Continue reading

Converting Wet Corn Weight to Dry Corn Weight

Source: Bob Nielsen, Purdue University

Corn is often harvested at grain moisture contents higher than the 15% moisture typically desired by grain buyers. Wetter grain obviously weighs more than drier grain and so grain buyers will “shrink” the weight of “wet” grain (greater than 15% moisture) to the equivalent weight of “dry” grain (15% moisture) and then divide that weight by 56 to calculate the market bushels of grain they will purchase from the grower.

The two sources of weight loss due to mechanical drying are 1) the weight of the moisture (water) removed by the drying process and 2) the anticipated weight loss resulting from the loss of dry matter that occurs during the grain drying and handling processes (e.g., broken kernels, fines, foreign materials). An exact value for the handling loss, sometimes called “invisible shrink”, is difficult to predict and can vary significantly from one grain buyer to another. For a lengthier discussion on grain weight shrinkage due to mechanical drying, see Hicks & Cloud, 1991.

The simple weight loss due to the removal of grain moisture represents the greatest percentage of the total grain weight shrinkage due to drying and is easily calculated using a handheld calculator or a smartphone calculator app. In general terms, you first convert the “wet” weight (greater than 15% moisture) to absolute dry weight (0% moisture). Then you convert the absolute dry weight back to a market-standard “dry” weight at 15% grain moisture.

Concept:

  1. The initial percent dry matter content depends on the initial grain moisture content. For example, if the initial grain moisture content is 20%, then the initial percent dry matter content is 80% (e.g., 100% – 20%).
  2. If the desired ending grain moisture content is 15% (the typical market standard), then the desired ending percent dry matter content is 85% (100% – 15%).
  3. Multiply the weight of the “wet” grain by the initial percent dry matter content, then divide the result by the desired ending percent dry matter content.

Example:

  1. 100,000 lbs of grain at 20% moisture = 80,000 lbs of absolute dry matter (i.e., 100,000 x 0.80).
  2. 80,000 lbs of absolute dry matter = 94,118 lbs of grain at 15% moisture (i.e., 80,000 / 0.85).
  3. 94,118 lbs of grain at 15% moisture = 1681 bu of grain at 15% moisture (i.e., 94,118 / 56).

One take-home reminder from this little exercise is the fact that the grain trade allows you to sell water in the form of grain moisture… up to a maximum market-standard 15% grain moisture content (or 14% for long term storage). Take advantage of this fact and maximize your “sellable” grain weight by delivering corn grain to the elevator at moisture levels no lower than 15% moisture content. In other words, if you deliver corn to the elevator at grain moisture contents lower than 15%, you will be paid for fewer bushels than you otherwise could be paid for.


Estimating Yield Losses in Stressed Corn Fields

Source: Dr. Peter Thomison, OSU Extension

Drought stressed corn near tassel emergence

Many corn fields are still silking (and some are just past the mid-vegetative stages)….so, it may seem a little early to discuss estimating grain yields. However, according to the most recent  NASS crop report, for the week ending Aug. 8, 2019,  25% of the corn crop has reached the dough stage (compared to 63% for the 5 year average). Corn growers with drought damaged fields and late plantings may want to estimate grain yields prior to harvest in order to help with marketing and harvest plans. Two procedures that are widely used for estimating corn grain yields prior to harvest are the YIELD COMPONENT METHOD (also referred to as the “slide rule” or corn yield calculator) and the EAR WEIGHT METHOD. Each method will often produce yield estimates that are within 20 bu/ac of actual yield. Such estimates can be helpful for general planning purposes.

THE YIELD COMPONENT METHOD was developed by the Agricultural Engineering Department at the University of Illinois. The principle advantage to this method is that it can be used as early as the milk stage of kernel development, a stage many Ohio corn fields have probably achieved. The yield component method involves use of a numerical constant for kernel weight which is figured into an equation in order to calculate grain yield. This numerical constant is sometimes referred to as a “fudge‑factor” since it is based on a predetermined average kernel weight. Since weight per kernel will vary depending on hybrid and environment, the yield component method should be used only to estimate relative grain yields, i.e. “ballpark” grain yields. When below normal rainfall occurs during grain fill (resulting in low kernel weights), the yield component method will OVERESTIMATE yields. In a year with good grain fill conditions (resulting in high kernel weights), the method will underestimate grain yields.

In the past, the YIELD COMPONENT METHOD equation used a “fudge factor” of 90 (as the average value for kernel weight, expressed as 90,000 kernels per 56 lb bushel), but kernel size has increased as hybrids have improved over the years. Dr. Bob Nielsen at Purdue University suggests that a “fudge factor” of 80 to 85 (85,000 kernels per 56 lb bushel) is a more realistic value to use in the yield estimation equation today. https://www.agry.purdue.edu/ext/corn/news/timeless/YldEstMethod.html

According to Dr. Emerson Nafziger at the University of Illinois under current drought stress “…. If there’s a fair amount of green leaf area and kernels have already reached dough stage, using 90 [as the “fudge-factor “] might be reasonable. It typically doesn’t help much to try to estimate depth of kernels at dough stage, when kernel depth is typically rather shallow anyway, especially if there are 16 or more kernel rows on the ear. If green leaf area is mostly gone, however, and kernels look like they may be starting to shrink a little, kernels may end up very light, and using 120 or even 140 [as the “fudge-factor”] might be more accurate”. http://bulletin.ipm.illinois.edu/article.php?id=1695.

Calculate estimated grain yield as follows:

Continue reading

Hay and Straw Barn Fires a Real Danger

Jason Hartschuh, CCA, Mark Sulc, Sarah Noggle, David Dugan, Dee Jepsen, OSU Extension

Usually, we think of water and moisture as a way to put a fire out, but the opposite is true with hay and straw, which when too wet can heat and spontaneously combust. Most years this is more common with hay than straw because there is more plant cell respiration in the hay. This year the wheat is at various growth stages and straw seem to have more green stems than normal. When baled at moistures over 20% mesophilic bacteria release heat-causing temperatures to rise between 130⁰F and 140⁰F. These bacteria cause the internal temperature of hay bales to escalate, and can stay warm for up to 40 days depending on the moisture content when baled. If bacteria die and the bales cool, you are in the clear but if thermophilic bacteria take over temperatures can rise to over 175⁰F.

Assessing the Fire risk

  • Most hay fires occur within the first six weeks after baling
  • Was the field evenly dry or did it have wet spots
  • Were moistures levels kept at 20% or less
  • If over 20% was hay preservative used

Continue reading

Knox County Soybean Starter Fertilizer Trial

A BIG thank you to David & Emily Mitchem for allowing me to put my Soybean Starter Fertilizer trial on their farm this year!


The results are listed in the tables below.

The 2018 report is now available in both a print and e-version. To receive a printed copy, stop by the Knox County Extension office.  The e-version can be viewed and downloaded here at go.osu.edu/eFields.

Dealing with the Weather and Unharvested Crops

Source: Penn State Extension (Edited)

WHAT A FALL!!!  According to the November 26 Crop Weather Report, approximately 14% of corn and 10% of beans still in the field.  The average moisture content of corn harvested last week was 17 percent and the average for soybeans was 16 percent, how big of a concern is this?

The weather continues to be unpredictable and give challenges to operators with grain and crops still in the field. Snow and ice over the last couple weeks have just been the latest in a long list of hurdles that growers have had to overcome this season. With some careful thought and planning you can still have a successfully harvest.

Having corn in the field now can be a double-edged sword. The longer it stays out, the dryer the corn will be when harvested, thus decreasing your drying costs. However, there is a higher risk of yield loss the longer the corn stays unharvested. Research on winter corn drydown showed that over a five-year span, corn grain would lose roughly 40% of its moisture between the months of October and December, when left in the field. The tradeoff is that we cannot anticipate the weather. The same study found that a single year yield decreased by 45% and another year decreased by only 5%.

Another concern of unharvested corn could be disease and mold. When discussing disease and mold, snow and ice pose no more danger to your crop than rain does. A positive of this situation is that the lower temperatures could have a limiting effect on pathogens’ ability to incubate or develop. A drawback of having laying snow is an increased opportunity for lodging. This year we have already seen a lot of lodging due to stem rots and adding snow to the mix may increase this risk. The risk of lodging is even further increased when coupled with winter winds and snow and ice to come. The takeaway is that disease and mold issues should not be your largest concern right now.

If you have a large amount of stock rot and lodging, harvesting as soon as possible will be best for a successful harvest. If your corn crop has lodged, one thing to remember is that this is not a usual harvest. Special consideration and care must be taken to get acceptable yields, which means slowing down and using caution. A few other options you have for getting a better harvestable yield are combining in the opposite direction, or “against the grain.” This will allow the head to get under the crop and lift it up. Another option is to use a corn reel. A corn reel is a specialized piece of equipment that mounts on the top of your corn head and uses rotating hooks to lift the corn and allow the head to get under the lodged crop.

The last concern is compaction and rutting of fields … Who Doesn’t Have Compaction Issues This Year??  Compaction will linger for years and will require attention to avoid problems with next year’s crop.


Drying and storing wet soybeans

Source: Michael Staton, Michigan State University Extension

Due to the cool and wet conditions, soybeans harvested at this time of the year will need to be dried on the farm or at the elevator. Some elevators will accept soybeans up to 18 percent moisture while others will reject loads that are above 15 percent moisture. Contact your elevator prior to delivery and understand their discount schedule. Information on understanding soybean discount schedules is available in “Understanding soybean discount schedules” from Michigan State University Extension.

Commodity soybeans used for domestic crush or export can be dried using supplemental heat. However, food grade and seed beans should not be dried with supplemental heat. Proper management is essential to minimizing damage when using supplemental heat. Keep the drying temperature below 120 degrees Fahrenheit.

Click here to read more.


Understanding soybean discount schedules

Source: Michael Staton, Michigan State University Extension


Every elevator that receives soybeans has a discount schedule. Discount schedules are important because they communicate how and when various shrink factors and discounts are applied at delivery. Discount schedules vary from elevator to elevator and can be somewhat confusing. This article lists and explains the major shrink and discount factors pertaining to soybeans and provides examples of shrink and discount calculations.

Test weight

Test weight is a measure of density (mass/volume) and is measured in pounds per bushel. The standard test weight of 60 pounds per bushel is always used to convert the scale weight of soybean loads to the number of bushels contained in the load. This is true even if the actual test weight of the load is lower than 60 pounds per bushel. Therefore, test weight does not impact the number of saleable bushels harvested from a defined area (acre or field). However, most grain buyers will begin discounting soybean loads when the test weight falls below 54 pounds per bushel. Discounts are applied to the gross weight of the load before shrink factors are applied. The only advantage of having test weights higher than 54 pounds per bushel is that the beans will take up less volume in storage and during transportation.

Read more click here.