How to store treated seed

Source: Anne Dorrance,  OSU Extension

Let me say upfront that much of the information in this piece is based on a study published (Crop Science 53:1086-1095 in 2013) by Dr. Susan Goggi’s lab and others at Iowa State University, Dept. of Agronomy & Seed Science Center. As a scientist, we store both untreated and treated seed over years, but it is healthy and it is in cool and always dry conditions.  But this year we have several issues.  The seed raised in 2018, due to the rains through our long drawn out harvest, left a lot to be desired.  Last week, we had one day to plant and now we are making decisions on what to do with the seed we purchased that is treated.  Treated seed cannot enter the market and must be disposed of through planting, incineration, or burial based on the label. All of these are costly.

In a study at Iowa State, they compared 24 different seed lots which were treated with a fungicide, fungicide plus insecticide and not treated under 3 conditions: 1) a warehouse; 2) a climate controlled cold storage (50 F, ~60% RH); or 3) warm storage (77 F, ~31 % RH). The seed itself was high germination (95 to 98% germination), dry (<8%), and there was a very low percentage of seedborne pathogens.

Continue reading How to store treated seed

Record Setting Rainfall

Source: Farm & Dairy

May 2019 was the second-wettest month in U.S. history.

Drenching rains and historic flooding last month contributed to a record-wet, 12-month period, from June 2018 through May 2019, according to the latest climate report from the National Oceanic and Atmospheric Administration, or NOAA.

For Ohio, it was the wettest year on record in the last 124 years. (Scroll down for a chart with historical perspective of Ohio’s rainfall totals.)

Soggy conditions from June 2018 through May 2019 led to the wettest 12-month period on record in the U.S., with 37.68 inches, 7.73 inch above average. The previous June-May record was 35.47 inches and occurred from June 1982-May 1983. The previous all-time 12-month record was 36.20 inches and occurred from May 2018-April 2019.

Continue reading Record Setting Rainfall

Governor DeWine Requests USDA Disaster Designation for Ohio Farmers Impacted by Heavy Rainfall

(COLUMBUS, Ohio)—Ohio Governor Mike DeWine today sent a letter to U.S. Department of Agriculture (USDA) Secretary Sonny Perdue requesting a USDA Secretarial disaster designation for Ohio amid heavy rainfall impacting Ohio farmers.

In his letter, Governor DeWine notes that record rainfall through the spring planting season has been devastating to Ohio farmers, with flooding and saturated fields preventing them from planting crops. Only 50 percent of Ohio’s corn crop and 32 percent of Ohio’s soybean crop have been planted as of June 10, 2019.

“The harsh reality for Ohio farmers is that many acres will remain unplanted,” Governor DeWine said. “Our dairy and livestock sectors also face serious forage and feed shortages. We recognize the tremendous challenges facing our agricultural community, and we are working to identify any and all sources of possible relief.”

The letter is a formal request to the U.S. Department of Agriculture for a USDA disaster declaration for Ohio so that assistance can be made available to Ohio farmers.

“I visited with several farmers this week and saw firsthand the impact of this devastating rainfall. Fields are visibly filled with water and weeds instead of crops,” said Ohio Department of Agriculture Director Dorothy Pelanda.

Excessive rainfall presented challenges as early as last fall. Because of poor field conditions, some 2018 crops are still in the field and yet to be harvested. Currently, producers are dealing with erosion of their cropland, delayed fieldwork and planting, manure application challenges, and concerns among livestock producers that forages will be in short supply.

Farmdoc Webinar on Prevent Plant/Late Planting Decisions

A webinar on prevent planting was conducted on June 12, 2019. Items include:

1. Todd Hubbs provided market outlook: Bullish corn, bearish soybean
2. Jonathan Coppess provided a policy outlook: Still uncertainty on Market Facilitation Program and Disaster Assistence Programs
3. Gary Schnitkey provided farmer decision making: Corn planting is coming to the end, Don’t plant soybeans on corn prevent plant acres, little downside and upside on planting on planting soybeans on intended soybean acres for the next week.

The webinar video is available on our YouTube Channel now (Click Here)

Two more webinars will be conducted on the next two Wednesdays (June 19, June 26) at 8:00 am (Central Time).  Click here to register.


Corn Growth & Development

Today managing your corn crop requires knowledge of the different growth stages of the corn plant.  Growth stage identification is critical for scouting and proper timing of fertilizer and pesticide applications.  Each week throughout the growing season I will discuss the various corn growth stages and management issue at each stage.  This week I will focus on the seed.

The rain continues.  By now most of the corn that is going to be planted is in the ground.  Due to the weather induced extended corn planting season we have corn at various growth stages ranging from just planted to V4.

The Seed

Now that the seed is in the soil, it will begin to absorb water and begin to swell. Corn kernels must absorb about 30% of their weight in water before germination begins.  When enough water has been absorbed and the soil temperature is favorable, germination will occur.

Germination occurs in a specific sequence that is strongly influenced by soil temperature. Therefore, germination and emergence will occur in fewer days when the seed is planted into warmer soils.  Corn typically emerges in 115-120 growing degree days (GDD’s).

(Click on each picture to enlarge)

Fig. 1. Kernel appearance 12 hrs after planting.

The radicle root emerges first, near the tip end of the kernel, within two to three days in warm soils with adequate soil moisture or much longer if soil temperatures hover at or below 50F (10C).  In cooler or drier soils, the radicle root may not emerge until one to two weeks after planting.


Fig. 2. Seedling appearance 36 hrs (34 GDD) after planting.

The coleoptile (commonly called the “spike”) emerges next from the embryo side of the kernel within one to many days of the appearance of the radicle, depending on soil temperature.  The coleoptile is a rigid piece of plant tissue that completely encloses the four to five embryonic leaves (plumule) that formed during grain development of the seed production year.  The coleoptile initially negotiates its way toward the dent end of the kernel by virtue of the elongation of the mesocotyl. The plumule leaves slowly enlarge and eventually cause the coleoptile to split open as it nears the soil surface.

Fig. 3. Seedling appearance 60 hrs (58 GDD) after planting.

The lateral seminal roots emerge next and initially elongate towards the dent end of the kernel. Even though these roots and the radicle root are technically nodal roots, they are considered part of the seminal (seed) root system and not part of the permanent nodal root system that develops later. The first so-called “permanent” roots begin elongating from the first node at the crown of the seedling at approximately the V1 leaf stage (1 leaf with visible leaf collar) and are clearly visible by V2.

Fig. 4. Seedling appearance 72 hrs (67 GDD) after planting.

Fig. 5. Seedling appearance 82 hrs (79 GDD) after planting.

Fig. 6. Seedling appearance 105 hrs (103 GDD) after planting.


Fig. 7. Seedling emergence 5 days (114 GDD) after planting.

Fig. 8. Seedling emergence 5 days (114 GDD) after planting.


(Adopted from: Visual Indicators of Germination in Corn, Dr. Bob Nielsen, Purdue University)


More Wet Weather Ahead

Source: Jim Noel

After the wet spring which was forecast, we expected a transition in early/mid-June from the spring pattern to summer pattern with a relaxation of rainfall for a brief period. This appears to be happening. However, it won’t last too long as we expect above normal rainfall to return for the second half of the month.

Over the last week, rainfall has been all over the place. Northern Ohio and far southern Ohio saw above normal rainfall above 1 inch. Central sections and far northwest Ohio saw below normal rainfall below an inch.

For the remainder of June, expect temperatures to be near normal. However, there will be a lot of swings in those temperatures. For the week of June 11-16, temperatures will be slightly below normal. For the week of June 17-23, temperatures will remain slightly below normal. For the last week in June temperatures will likely swing to above normal. With those average temperatures, expect below normal maximum temperatures the next two weeks with above normal minimum temperatures. For the last week of June, both maximum and minimum temperatures will be above normal but plenty of moisture will keep maximum temperatures generally at or below 90.

Rainfall for the week of June 11-16 will average 0.50 to 1.5 inches which are actually close to normal. For the rest of June rainfall will go above normal after this week. For the next 16 days, rainfall will average 2-5 inches which are above the normal of too far from 2 inches. However, confidence is low in rainfall after this week. Weather models are all over the place with the transition to summer. There is the risk of some heavy rain events in late June of 5+ inches. The greatest risk is in northern Ohio for these heavy rain events.

The outlook for June is near or slightly above normal temperatures and above normal rainfall and humidity.

The latest observed 7-day 4-km hi-resolution rainfall estimates can be found here: https://www.weather.gov/images/ohrfc/dynamic/latest7day.jpeg

The latest 16-day rainfall outlook can be found at https://www.weather.gov/images/ohrfc/dynamic/NAEFS16.apcp.mean.total.png

The latest NWS Ohio River Forecast Center river conditions can be found at  https://www.weather.gov/ohrfc/


Prevented Planting, 2019 Market Facilitation Program Payments, Disaster Assistance, and Price Dynamics

Source: Schnitkey, G., C. Zulauf, K. Swanson, R. Batts and J. Coppess, Department of Agricultural and Consumer Economics, University of Illinois

We stand at a point of extreme price and policy uncertainty.  In the Midwest, corn planting is historically late and many acres are or soon will be eligible for prevented planting payments on corn crop insurance policies.  On many farms, corn prices have not increased enough to cause net returns from planting corn to exceed net returns from prevented planting.  However, the U.S. Department of Agriculture announced a 2019 Market Facilitation Program (MFP) and has currently indicated that payments will be tied to 2019 planted acres.  The 2019 MFP could provide incentives to plant crops and not take prevented planting payments.  Moreover, this program could bring a little used option into play this year:  take 35% of the corn prevented planting payment and plant soybeans after the late planting period for corn.   Adding confusion to this situation is a disaster assistance program working its way through Congress. We provide detail on the 2019 MFP program based upon what is known at this time, and the Congressional disaster assistance bill.  Then, we evaluate farmer options at this point.  Decisions are difficult.  Corn prices have not risen enough to justify planting corn on many farms.  Yet, corn prices could increase if a large number of prevent planting acres occur.

2019 Market Facilitation Program Payments

In a May 23rd press release, the U.S. Department of Agriculture (USDA) outlined the 2019 Market Facilitation Program (MFP). This program is projected to provide $14.5 billion in direct payments to farmers of specific commodities, $4.9 billion more than the $9.6 billion spent on the 2018 MFP (Schnepf, Monke, Stubbs, and Hopkinson). Important details of this program are:

  • Payments will be based on 2019 planted acres to MFP-covered crops. USDA has initially stated that payments will not be received on prevented planting acres but the final details have yet to be released. By itself, this provision provides incentives to plant crops and not take prevented planting payments.
  • MFP-covered crops in 2019 include corn, soybeans, wheat, alfalfa hay, barley, canola, crambe, dry peas, extra-long staple cotton, flaxseed, lentils, long grain and medium grain rice, mustard seed, dried beans, oats, peanuts, rapeseed, safflower, sesame seed, small and large chickpeas, sorghum, sunflower seed, temperate japonica rice, and upland cotton.
  • There will be a single payment rate for a county. That per acre payment rate will be based on total plantings of the MFP-covered crops on the individual farm. Acres planted to an individual crop will not matter other than its contribution to total planted MFP crops on the farm.  As an example, suppose that MFP rate for a county is $50 per acre. A farm with 60 acres in corn and 40 acres in soybeans will have 100 MFP acres and receive $5,000.  The farm will also receive $5,000 if 40 acres are corn and 60 acres are soybeans.
  • Payments acres in 2019 cannot exceed the payment acres on the farm for the 2018 MFP. This restriction is designed to prevent more acres moving into covered crops, particularly from grasslands or lands typically not farmed. It will most likely be made on a Farm Service Agency (FSA) farm basis. A farm that had 80 MFP-acres in 2018 cannot receive payments on more than 80 acres in 2019.  (see, Perdue Provides More Clarity on Tariff Aid).
  • Payments will be made in three tranches, the first in late July/early August after the July 15th planting reporting date with the Farm Service Agency (FSA), November, and early January.  Whether or not the November and early January payments are made will depend on USDA determination on the need for these payments.

Many important questions remain to be answered regarding 2019 MFP payments; the answers to these questions could affect 2019 planting decisions.   The most important question is:  What are the 2019 per acre payment rates?

Click Here To Read The Entire Article

More on Switching Corn Hybrid Maturities

Dr. Peter Thomison, OSU Extension

Corn GDD Tool to Identify “Safe” Hybrid Maturities for Late Planting.  Dr. Bob Nielsen at Purdue University has written an article describing a powerful decision aid, U2U Corn GDD Tool, which can be used to identify “safe” hybrid maturities for late planting. The GDD Tool is currently available for Ohio and it can estimate county-level GDD accumulations and corn development dates based on current and historical GDD data plus user-selected start dates, relative hybrid maturity ratings, GDDs to black layer, and freeze temperature threshold values. The article can be found here: (http://www.kingcorn.org/news/timeless/HybridMaturityDelayedPlant.html ).

Silage Corn.  Although corn for silage responds to timely planting, it is more tolerant of late planting than is corn planted for grain. Silage growers can generally continue to plant adapted hybrid maturities for silage purposes until late June because silage harvest typically occurs several weeks before physiological maturity. Penn State University researchers have reported yields of more than 20 tons/acre with mid-June plantings in some years. Their studies indicate that corn silage can produce reasonable forage yields in many areas, even when planted in late June. Penn State University studies have shown that energy levels are reduced in later-planted silage, presumably because of lower starch levels due to reduced grain fill.

“Ultra-early” Hybrids.  Results of past OSU research indicate that some 100-104 day hybrids are available with yields comparable to hybrids of commonly grown maturities in early and late planting environments. The 100-104 day hybrids showed greater yield potential than the hybrids with maturity ratings less than 100 days (ultra-early hybrids). Grain moisture of the early 100-104 day hybrids were 3 to 5% lower than commonly grown maturities. At test sites with the highest level of stalk lodging, most of these early hybrids showed levels of stalk lodging comparable to those of the commonly grown hybrid maturities. However, our knowledge of early hybrid performance across Ohio production environments is limited. Some shorter season hybrids may not be suitable in terms of their stress tolerance and disease resistance.

Table 1 provides a comparison of grain moisture content at harvest in hybrids ranging from 102 to 113 days relative maturity (days relative maturity) planted in late April/ early May and in early/mid June (unpublished OSU research, 2009-2010).

Table 1.  Effects of planting delays and hybrid maturities on corn grain moisture at harvest. * number in parentheses indicates number of studies

Hybrid Maturity (days)
Location/Year Planting Date 102 104 111 113
—–% harvest moisture—-
 

S. Charleston 2009 (3)*


Late April/Early May 13.9 14.9 16.6 18.9
Early/Mid June 16.4 17.3 22.3 28.4
 

S. Charleston 2010 (3)


Late April/Early May 10.9 11.7 13.0 13.0
Early/Mid June 14.8 16.3 21.9 23.4
 

Hoytville 2010 (1)


Late April/Early May 15.7 15.2 22.1 23.0
Early/Mid June 23.1 24.5 28.8 30.0

Delayed Soybean Planting – A Yield Perspective

Source:  Dr. Laura Lindsey, OSU Extension

Across the state, soybean planting is still on-hold due to continued wet weather. A few weeks ago, I wrote an article on recommendations for June-planted soybeans: https://agcrops.osu.edu/newsletter/corn-newsletter/2019-12/recommendations-late-planted-soybeans You can also find recommendations for late-planted soybeans in the Ohio Agronomy Guide available to download as a pdf here: https://stepupsoy.osu.edu/soybean-production/ohio-agronomy-guide-15th-edition (click on the picture of the guide to download).

I think June-planted soybeans still have a great deal of yield potential; however, it will depend on how the rest of the year turns out. (Will there be water limitations during pod-setting and seed fill? Will we have an early frost?)

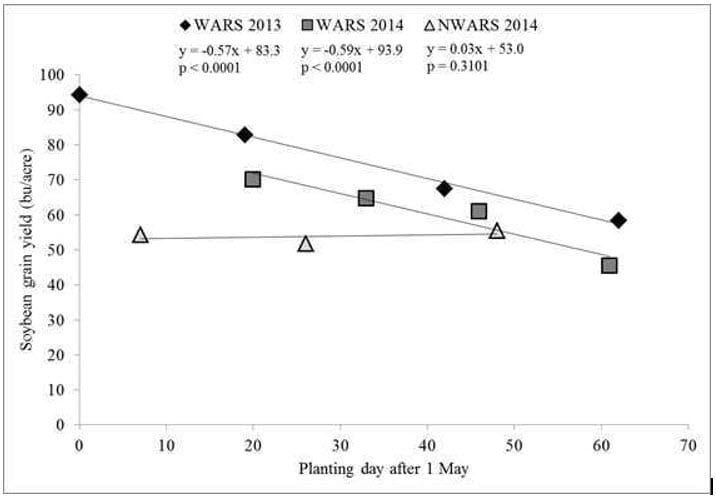
 Figure 1. Effect of soybean planting date on soybean grain yield at the Western Agricultural Research Station (WARS) (Clark County) in 2013 and 2014 and the Northwest Agricultural Research Station (NWARS) (Wood County) in 2014.

In Clark County at the Western Agricultural Research Station (WARS), we have observed a 0.6 bu/acre/day reduction in soybean yield (see Figure 1). Soybeans planted on July 2, 2013 yielded close to 60 bu/acre and soybeans planted on July 1, 2014, yielded close to 50 bu/acre. Interestingly, in Wood County at the Northwest Agricultural Research Station (NWARS) in 2014, yield was just over 50 bu/acre regardless of planting date, which spanned from May 8 to June 18. I’ve summarized some of our other late-planted soybean yield data in the table below.

Planting date County Average yield

(bu/acre)

June 1, 2011 (performance trial) Preble County 64-71
June 1, 2016 (relative maturity trial) Clark County 60
June 3, 2011 (performance trial) Mercer County 57-66
June 4, 2011 (performance trial) Delaware County 43-56
June 4, 2017 (performance trial) Sandusky County 57-58
June 5, 2011 (performance trial) Erie County 59-65
June 6, 2017 (relative maturity trial) Wood County 50
June 6, 2011 (performance trial) Henry County 54-56
June 7, 2011 (performance trial) Fayette County 58-72
June 7, 2011 (performance trial) Mercer County 53-55
June 8, 2017 (relative maturity trial) Clark County 60-65
June 9, 2016 (relative maturity trial) Wayne County 68
June 9, 2017 (relative maturity trial) Wayne County 55
June 13, 2016 (relative maturity trial) Wood County 58-61
June 26, 2018 (double crop trial) Clark County 48
June 29, 2018 (double crop trial) Wayne County 41
June 29, 2017 (double crop trial) Clark County 39-47
July 11, 2016 (double crop trial) Clark County 43


Recommended adjuvants for delayed preemergence/early postemergence herbicide applications.

Source:  Penn State University

Table 2.2-10 (from The Penn State Agronomy Guide) 

See specific herbicide label(s) for additional information on application. This type of application generally is used when weather conditions preclude the use of a standard pre­emergence program. For most products, do not apply in liquid fertilizer if com has emerged. Poor control from residual herbicides may result if annual grasses such as foxtail and panicum have emerged at the time of application; tank-mix with product that controls emerged grasses. Delayed preemergence/early postemergence programs can work well with herbicide-resistant corn hybrids now available (e.g., Roundup Ready and Libertylink). When tank-mixing with other pesticides, follow the most restrictive product label.

Recommended Adjuvants When Preemergence Herbicides Are Used Early Postemergence

Trade Name Recommended If Corn Has Emerged and Weeds Are Present Optional
Acuron1,2 NIS (0.25% v/v) or AMS 8.5 lb/100 gal
Acuron1,2 COC3 (1% v/v) AMS 8.5 lb/100 gal
Acuron Flexi NIS (0.25% v/v) or
Acuron Flexi COC3 (1% v/v)
Anthem ATZ/Anthem Flex/Anthem Maxx NIS (0.25% v/v) or
Anthem ATZ/Anthem Flex/Anthem Maxx COC (1–2 pt/A) or
Anthem ATZ/Anthem Flex/Anthem Maxx MSO (1–2 pt/A)
Atrazine label only mentions COC
Balance Flexx label states “Do not use COC or MSO or fully loaded glyphosate formulation”
Bicep II Magnum label mentions only NIS when tank-mixed with specific herbicides
Corvus label states: “Do not use COC or MSO”
FulTime NXT, TopNotch1, or Keystone NXT1 not addressed on label
Guardsman Max/G-Max Lite NIS (1–2 pt) or UAN (1–2 gal/100 gal)
Guardsman Max/G-Max Lite COC4 (1 qt/A) AMS (8–17 lb/100 gal)
Halex GT NIS (1–2 qt/100 gal) AMS (8.75–17 lb/100 gal) (required)
Harness MAX1,5 NIS (1 qt/100 gal) or UAN (rate not specified)
Harness MAX1,5 COC (1 gal/100 gal) AMS (rate not specified)
Harness Xtra or Degree Xtra not addressed on label
Instigate NIS or COC UAN or AMS (required)
Instigate rates not specified rates not specified
Lexar EZ1,2 NIS (0.25% v/v) or UAN (2.5% v/v) or
Lexar EZ1,2 COC (1% v/v) AMS (8.5 lb/100 gal)
Lumax EZ1,2 NIS (0.25% v/v) or UAN (2.5% v/v) or
Lumax EZ1,2 COC (1% v/v) AMS (8.5 lb/100 gal)
Python WDG/Accolade NIS (1 qt/100 gal) or UAN (2.5 gal/100 gal)
Python WDG/Accolade COC (1 gal/100 gal) AMS (2–4 lb/A)
Resicore NIS (1 qt/100 gal) or AMS only allowed with glyphosate or glufosinate herbicides
Resicore COC3 (1 gal/100 gal)
Zemax1,2 NIS (1 qt/100 gal) or UAN (rate not specified)
Zemax1,2 COC3 (1gal/100 gal) AMS (rate not specified)

1. Do not use either NIS or COC if tank-mixed with Liberty (AMS is allowed).
2. Do not use either NIS or COC if tank-mixed with a fully-loaded glyphosate (AMS is allowed); if glyphosate label recommends an adjuvant, add NIS and AMS.
3. Label cautions about crop injury.
4. Use COC only with Guardsman Max alone or tank-mixed with atrazine.
5. Do not use either NIS or COC if tank-mixed with glyphosate (AMS is allowed).


Spray Additives When Tank-mixed with Liberty (LibertyLink corn [LL]) or Glyphosate (Roundup Ready corn [RR])

Trade Name Specific Adjuvant Comments
2,4-D n/a**
Accent Q n/a
Aim/Cadet n/a
Atrazine n/a
Basagran n/a
Basis Blend n/a
Callisto/Callisto Xtra LL: Do not use COC
RR: Add AMS; if glyphosate calls for an adjuvant, add NIS (do not use UAN, COC or MSO)
Capreno LL: Do not use MSO or COC; only add AMS at 8.5 lb/100 gal
RR: Use of glyphosate compatible high surfactant oil concentrate (HSOC) is recommended with fully loaded glyphosate and required with partially loaded glyphosate; AMS is required; do not use COC or MSO
Curtail n/a
DiFlexx/DiFlexx Duo LL: Do not use MSO or COC; only add AMS at 8.5 lb/100 gal
RR: Label allows for additional adjuvant if resistant weeds are present
Halex GT LL: Not allowed
Harmony SG LL: n/a
RR: Add AMS; if glyphosate calls for an adjuvant, add NIS (1–2 pt/100 gal) (do not use UAN, COC, or MSO)
Impact/Armezon n/a
Laudis LL: Do not use MSO or COC; only add AMS at 8.5 lb/100 gal
RR: Label recommends additional adjuvant if fully loaded glyphosate is used; label requires additional adjuvant if partially loaded glyphosate is used
Maestro/Moxy n/a
Marksman n/a
NorthStar n/a
Permit Plus n/a
Permit/Sandea n/a
Realm Q LL: n/a
RR: When tank-mixed with glyphosate, ensure total adjuvant load is equivalent to the label recommendation
Resolve Q When tank-mixed with glyphosate or glufosinate, ensure total adjuvant load is equivalent to the label recommendation
Resource n/a
Revulin Q LL: n/a
RR: When tank-mixed with glyphosate, ensure total adjuvant load is equivalent to the label recommendation
Status n/a
Steadfast Q n/a
Stinger n/a
Stout n/a
Yukon n/a

*See also Table 2.2-16.
**n/a = adjuvants for LibertyLink or glyphosate not addressed.