Farm Bill Deal Includes Key Commodity Program Changes

Source: AgWeb.com

Key changes:

  • Adjusted loan rates
  • Annual choice between ARC and PLC
  • Opportunity to update yield data
  • Grassland to be removed from base acres

The four key ag committee leaders announced agreement in principle on a final farm bill Thursday. That deal includes some key changes to the Commodity Title of the bill, including adjustments sought by farm groups, according to Pro Farmer Washington Analyst Jim Wiesemeyer.

The first key change according to Wiesemeyer comes in a provision to increase loan rates while allowing for an annual election between the Agricultural Risk Coverage (ARC) and Price Loss Coverage (PLC) programs. Under the previous farm bill, growers made a single selection between the two programs for the life of the farm bill.

Click here to read more ….

2018 Farm Sector Income Forecast, November

Source:  USDA ERS

Net farm income, a broad measure of profits, is forecast to decrease $9.1 billion (12.1 percent) from 2017 to $66.3 billion in 2018, after increasing $13.8 billion (22.5 percent) in 2017. Net cash farm income is forecast to decrease $8.5 billion (8.4 percent) to $93.4 billion. In inflation-adjusted 2018 dollars, net farm income is forecast to decline $10.8 billion (14.1 percent) from 2017 after increasing $13.0 billion (20.2 percent) in 2017. If realized, inflation-adjusted net farm income would be 3.3 percent above its level in 2016, which was its lowest level since 2002.

See a summary of the forecasts in the table U.S. farm sector financial indicators, 2011-2018F, or see all data tables on farm income and wealth statistics.

Net farm income and net cash farm income, 2000-18F

[In the text below, year-to-year changes in the major aggregate components of farm income are discussed only in nominaldollars unless the direction of the change is reversed when looking at the component in inflation-adjusted dollars.]

Summary Findings

Continue reading 2018 Farm Sector Income Forecast, November

Converting Wet Corn Weight to Dry Corn Weight

by: R.L. (Bob) Nielsen, Purdue University
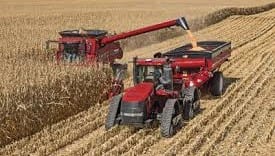
Corn is often harvested at grain moisture contents higher than the 15% moisture typically desired by grain buyers. Wetter grain obviously weighs more than drier grain and so grain buyers will “shrink” the weight of “wet” grain (greater than 15% moisture) to the equivalent weight of “dry” grain (15% moisture) and then divide that weight by 56 to calculate the market bushels of grain they will purchase from the grower. The two sources of weight loss due to mechanical drying are 1) that due to the loss of grain moisture itself and 2) the anticipated weight loss due to dry matter loss during the grain drying and handling processes (e.g., broken kernels, fines, foreign materials).

An exact value for the handling loss, sometimes called “invisible shrink”, is difficult to predict and can vary significantly from one grain buyer to another. For a lengthier discussion on grain weight shrinkage due to mechanical drying, see Hicks & Cloud, 1991.

The simple weight loss due to the removal of grain moisture represents the greatest percentage of the total grain weight shrinkage due to drying and is easily calculated using a handheld calculator or a smartphone calculator app. In general terms, you first convert the “wet” weight (greater than 15% moisture) to absolute dry weight (0% moisture). Then you convert the absolute dry weight back to market-standard “dry” weight at 15% grain moisture.

Concept:

  1. For example, if the initial grain moisture content is 20%, then the initial percent dry matter content is 80% (e.g., 100% – 20%). NOTE: The initial percent dry matter content varies depending on the initial grain moisture content.
  2. If the desired ending grain moisture content is 15% (the typical market standard), then the desired ending percent dry matter content is 85% (100% – 15%).
  3. Multiply the weight of the “wet” grain by the initial percent dry matter content, then divide the result by the desired ending percent dry matter content.

Example:

  1. 100000 lbs of grain at 20% moisture = 80000 lbs of absolute dry matter (i.e., 100000 x 0.80).
  2. 80000 lbs of absolute dry matter = 94118 lbs of grain at 15% moisture (i.e., 80000 / 0.85).
  3. 94118 lbs of grain at 15% moisture = 1681 bu of grain at 15% moisture (i.e., 94118 / 56).

One take-home reminder from this little exercise is the fact that the grain trade allows you to sell water in the form of grain moisture… up to a maximum market-standard 15% grain moisture content (or 14% for long term storage). In other words, if you deliver corn to the elevator at grain moisture contents less than 15%, you are “losing” bushels. Take advantage of this fact and maximize your “saleable” grain weight by delivering corn grain to the elevator at moisture levels no less than 15% moisture content.

Will the 2018 Corn Crop Get Smaller?

Source:  Todd Hubbs, University of Illinois

December corn prices approached contract lows not seen since the second week of July as August ended.  The continued weakness in corn prices persists despite 2018-19 marketing year projections of stocks to use near eleven percent.  The August Crop Production report forecasted 2018 corn production at 14.586 billion bushels with a yield of 178.4 bushels per acre.  Recently, the corn yield forecast has come under scrutiny due to the latest industry estimates predicting yields below the current projection.  The question is whether the corn production forecast will change enough to result in higher prices than those currently reflected in the market.

The USDA forecast for the 2018 U.S. average corn yield in August sits at 178.4 bushels, approximately seven bushels above the estimated linear trend from 1960.  Using data since 1997, the change in the yield forecast from August to September declined in 11 of those years.  The decline exceeded one bushel in five of those years and dropped more than two bushels in four years.  The quick maturity for the crop this year combined with a decrease in the combination of good and excellent ratings over the last month from 70 to 68 percent provide some support for this speculation.  By comparing crop progress for years since 1997, seven years witnessed the national crop at the current 61 percent of dent this early in the year.  Of those years, three years saw final corn yield above the trend projection.  When one excludes the drought year of 2012, the average corn yield for the remaining six years came in at 0.3 bushels above the estimated linear trend from 1960 to 2017.  If the average deviation calculated above came to fruition this year, the national average yield would be approximately 172 bushels per acre.

…Read Full Article