Blotchy Ripening of Tomato Fruit: Description, Contributing Factors, and Prevention

Marketable yield is more important than total yield. Physiological disorders like ‘blotchy ripening’ typically do not affect total yield but do reduce marketable yield, which reduces income and profit potential.

Description
Blotchy ripening refers to one or more conditions specific to the external and/or internal color of tomato fruit. Ideally, the skin and flesh color of mature tomato fruit are uniform throughout, with red being most common. Fruit exhibiting blotchy ripening have discolored sections. For example, defected fruits are mostly red on the outside but contain areas that are green, yellow, gray, or paler red than the remainder of the fruit, such as shown in the picture. Blemished areas may be more common on the half of the fruit nearest the stem. The flesh, especially vasculature, of fruit exhibiting blotchy ripening may be brown or broken down.

Symptoms associated with blotchy ripening have underlying physiological, or disease or insect feeding causes. Symptoms can be mild and in only a small number of fruit or severe and/or in many fruit. Regardless, it is important to note that fruit are said to exhibit blotchy ripening only when they are also in the mid-late stages of ripening as determined by changes in firmness and other variables and when insect (e.g., whitefly) and disease (e.g., TMV) are ruled out as causal agents. These two criteria separate truly ‘blotchy’ ripened fruit from firm, immature fruit in the early stages of ripening (which can be mottled in color inside and out) and fruit damaged by the action of pathogens and/or insects. Blotchy ripening is a physiological disorder.

Blotchy ripening has been discussed as a potentially significant marketable yield issue in research and extension publications for nearly ninety years. Seaton and Gray of the Michigan Agricultural Research Station reported on their analysis of the anatomy of blotchy-ripened fruit in 1936. Also, after touring commercial and research farms throughout the U.S., Minges and Sadik of Cornell University published a protocol for evaluating blotchy ripening in 1964 (https://journals.flvc.org/fshs/article/view/100632/96587). These landmark works provided much needed insight on blotchy ripening, and they were followed by other steps that helped identify factors that contribute to the disorder.

Contributing Factors and Prevention

1. Genetics
Immature tomato fruit are green and photosynthetic. Later however, the set of pigments found in fruit of most hybrids shifts and red becomes the dominant color.

This shift is pre-programmed but influenced by conditions surrounding the fruit and within the plant and soil. The first and one of the most reliable steps in minimizing blotchy ripening is selecting varieties known to display it very infrequently – i.e., among few crops year to year and among few fruit within a season.

Hybrid tomato varieties are the culmination of huge, coordinated efforts requiring in-depth knowledge of tomato genes. Nearly 100 years ago, these genes were found to include a natural mutation that led individual fruit to ripen uniformly red, today’s most common standard. Decades of development of varieties whose fruit turn red over their entire surface and throughout their flesh at precisely the right time relative to other variables related to market-readiness have followed. However, the natural condition of NON-uniform reddening remains in the tomato genome and it shows itself most readily in certain varieties. As a category, heirloom varieties may display the blotchy ripening disorder most consistently. As an early step in avoiding blotchy ripening, consult reliable reports on variety performance in your area and select varieties that exhibit the problem rarely, if at all.

2. Environmental Conditions, including Air Temperature, Soil Status, and Nutrient Levels

A variety’s genes may predispose it to physiological disorders like blotchy ripening but this weakness can be minimized or masked with luck and proper management. Factors contributing to the development of physiological disorders like blotchy ripening can be difficult or take a long time to determine because they are difficult to induce experimentally. That said, research and experience have shown that blotchy ripening is most prevalent when air temperatures during mid-late stages of fruit ripening are extreme (e.g., below 60 deg F and/or above 90 deg F) or highly variable, when humidity levels remain high, and/or when these conditions are common and light levels are low. Low soil quality and high salinity are also associated with the occurrence of blotchy ripening.

Most also agree that severe cases of blotchy ripening are most often associated with factors that limit the supply of potassium (especially) and to a lesser extent, magnesium, to maturing fruit. These factors include: waterlogged and/or compacted soils, below-optimal potassium or magnesium application rates, above-optimal nitrogen application rates, excessive application of potassium and magnesium competitors, excessively large or dense canopies, and the environmental conditions mentioned previously.

Potassium supplies may be restricted for different reasons. So, do not over-compensate when evaluating and adjusting irrigation and nutrient management practices. Articles written by Gordon Johnson (University of Delaware), Jerry Brust (University of Maryland), and others are excellent overviews of blotchy ripening and its management. All point to limiting blotchy ripening and similar disorders through careful nutrient and water management, considering soil, plant, and fruit factors in the process.

Limiting the Occurrence and Severity of Blotchy Ripening in Tomato
A. Select resistant varieties.

B. Minimize large temperature swings and extreme high temperatures during fruit development and ripening.

C. Ensure adequate and balanced nutrient levels, paying special attention to potassium and magnesium and their competitors or factors that limit their availability.

D. Maintain consistent and appropriate soil moisture levels.

E. Maintain or improve biological, chemical, and physical characteristics of soils allowing them to support maximum root and plant health.

The 2021 Pumpkin Roundup

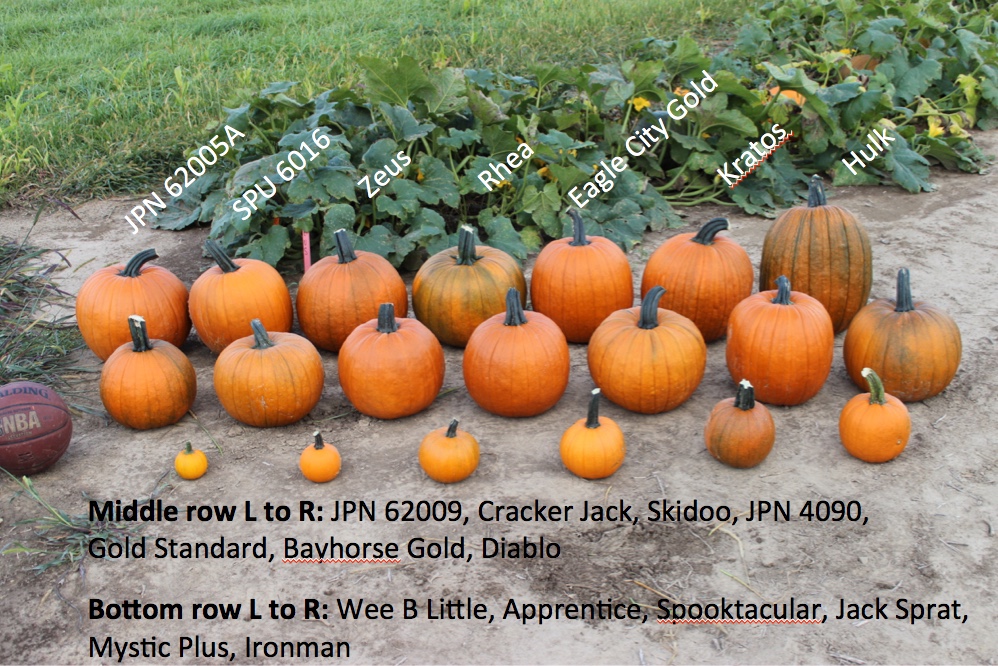
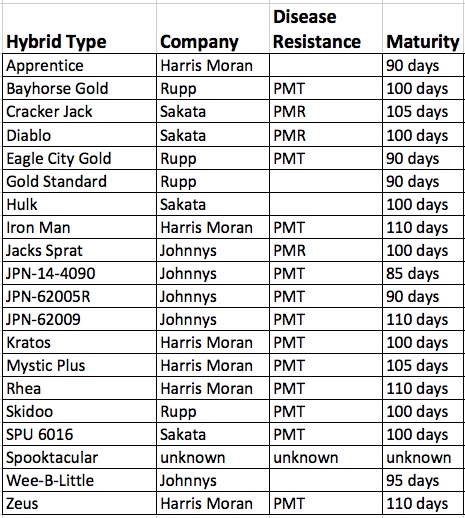
Much was accomplished in the 2021 growing season that relates to pumpkin and squash. In case you missed it while it was happening, here is a quick review of topics for you to peruse on some rainy and cold day when you don’t want to go outside and work around the farm. You can also find additional posts on the VegNet Blog located here: https://u.osu.edu/vegnetnews/

Videos

Over the past several years there has been a push to create video content to illustrate key monitoring, scouting, identification and management videos for key pests that affect pumpkin and squash. This content is posted to the OSU IPM YouTube channel (go.osu.edu/osuipm) and curated under a “Pumpkin” playlist at the top of the page. Recent additions include:

-2021 Pumpkin and Squash Hybrid Trial Review

-Tracking Big Foot Through the Pumpkin Patch

-2021 Herbicide Weed Screen for Pumpkins

-Managing Squash Vine Borer in Cucurbits

-Early Season Management of Cucumber Beetles and Bacterial Wilt

Screen shot of current pumpkin related videos on OSU IPM YouTube channel.

Powdery Mildew Trial Report

In 2021 we also conducted another powdery mildew fungicide evaluation trial at the Western Ag Research Station in South Charleston. Included in the trial were two novel fungicides, Cevya and Gatten, both which looked pretty good. The complete report can be accessed here toward the bottom of the page: https://u.osu.edu/jasinski.4/pumpkins/

Pumpkin and Squash Hybrid Trial Report

For those of you who want more details than those provided in the video review mentioned above, there is a detailed report posted on the VegNet Blog here that lists the hybrids, estimated number of fruits and yield, and other details related to the trial.

https://u.osu.edu/vegnetnews/2021/10/20/2021-pumpkin-and-squash-hybrid-trial-data/


Sunshine on my pumpkins makes me unhappy

Sunburned pumpkins by handle. Note even handle is burned on one side.

This title should seem familiar as a slight twist on the famous John Denver tune from 1971. With temperatures in the low to mid 90’s for at least three days last week across most of the state, fruit that were not properly covered in the canopy were placed at a higher risk for getting sunburned.

Downy mildew infested field with no leaf canopy.

Based on observations over several years, fruit that are cut off the vine tend to burn more readily than those that remain on the vine, likely a function of being able to evapotranpirate enough moisture to stave off burning. As clade 2 downy mildew was reported on August 13 (active on pumpkin/squash), fields that were not protected suffered almost 100% defoliation with 10-14 days. Amazingly this photo with near total canopy loss had nearly no detectable sun burned fruit despite several fruit actually being desiccated to the point where they were shriveling in the sun! If these fruit were cut off the vine, I would have expected significant rind burning to occur.

While there are a few “white washing” products on the market to spray on fruit in the field to prevent burning, they have not been investigated at OSU. The best prevention is a good canopy through harvest. The next best strategies though more labor intensive would be to cut and move fruit to a shaded location to cure naturally. If fruit are in a u-pick patch, moving them to distinct piles and covering with shade cloth may also be a possible solution.

Freeze / Frost Potential in Ohio – Aaron Wilson, Jim Jasinski

Now that the calendar has turned to April and warmer temperatures are becoming more frequent, those with horticultural interests are eager for the start of the growing season. But April can be a fickle month, with both warm spring rains and lingering cold nights that bring hard freezes and frost and occasionally, even a late-season snowfall. The threat of spring cold temperatures on horticultural production and operations (seeding, transplanting and flowering/fruit) can be greater following early season warmth, where phenological conditions may be advanced for this time of year.

Winter (December 2019 – February 2020) averaged 2-8°F above average compared to the climatological normal (1981-2010; Fig. 1). This warmth continued throughout March as well, with temperatures 4-8°F (west to east) above average. As a result, growing degree day accumulations range from the mid-60s (Ashtabula County) to nearly 200 (Lawrence County) after the first week of April 2020, with our landscapes, fruit trees, and gardening equipment coming to life.

Figure 1: Departure from average (1981-2010) temperatures for December 2019 – February 2020. Figure generated by the Midwest Regional Climate Center (http://mrcc.illinois.edu).

Frost and Freeze Potential

What is Ohio’s typical expectations regarding freeze (≤32°F) conditions in April and May? On average, locations throughout Ohio experience their last seasonal freeze from mid-April (southern Ohio) through mid-May (northeastern Ohio). Timing varies year to year and across Ohio. For a regional analysis, we have selected 8 locations from around Ohio to compare typical last seasonal freeze conditions (Fig. 2).

Figure 2: Selected locations around Ohio for freeze potential analysis displayed in Fig. 3.

Figure 3 shows the probability of experiencing a later freeze in Spring than indicating by the line graphs. All locations show probability based on the most recent 30-year period (1990-2019) except for 7-Lancaster (1996-2019). For each location, five temperatures are displayed (20°F-purple, 24°F-blue, 28°F-green, 32°F-yellow, and 36°F-red). For the purposes of this article we will focus on 32°F and 28°F (considered a hard/killing freeze). The bottom (x-axis) shows the probability that each of these temperatures will occur after a given date (indicated by the left or y-axis).

Figure 3: Probability of a later freeze in the spring for various locations (Fig. 2) around Ohio. Graphs generated by the Midwest Regional Climate Center (http://mrcc.illinois.edu).

Let’s run through an example of how to use Figure 3. For 1-Wauseon, we see that there is a 50% climatological probability of experiencing a 32°F temperature (yellow) after April 27, and this probability decreases to 20% by May 10. The colder, more damaging temperature of 28°F occurs 50% of the time after April 16, with only a 20% chance of seeing 28°F after April 27. For a southern location like 8-Marietta, these dates occur earlier in the season. Here, there is a 50% climatological probability of experiencing a 32°F temperature after April 18 with 28°F occurring 50% of the time after April 2.

Besides latitudinal (north of south) position, what other factors can influence springtime minimum temperatures? Colder air is more dense than warmer air, meaning it wants to remain close to the ground and will flow over the terrain like a fluid to settle in areas of lower elevation. If your location is in a valley or low-lying area, the climatological dates will likely be shifted later to account for more freeze potential later in the spring. Water bodies are typically colder than the surrounding land areas in spring which may keep temperatures in the immediate vicinity a little colder. For 2020, water and soil temperatures are above average, so they are likely to have a moderating impact this year. Cloud cover and higher humidity in the spring will keep air temperatures warmer due to their absorption of terrestrial (from the surface) radiational effects. Finally, late season snowfall combined with clearing skies overnight can also cause the surface to cool rapidly and lead to damaging freeze potential as well. All of these factors should be considered when comparing your location to those selected in Fig. 3.

April 2020 Outlook

At the time of this writing, the National Oceanic and Atmospheric Administration (NOAA) Climate Prediction Center (https://www.cpc.ncep.noaa.gov/) outlook for April 10-20, 2020 calls for increased probability of seeing below average (unseasonably cold air) settling into the Upper Great Plain, Midwest, and Ohio Valley (Fig. 4) with a moderate risk of experiencing much below average minimum (nighttime) temperatures. Given the warm start to the year and current phenological conditions, those with horticultural assets should monitor this freeze potential closely and be prepared to mitigate when necessary to avoid losses. For a weekly climate update, please visit the State Climate Office of Ohio’s website (https://climate.osu.edu).

Figure 4: 8-10-day (April 13-19, 2020) temperature outlook. Figure courtesy of NOAA’s Climate Prediction Center.

Aaron Wilson is a research specialist with the Byrd Polar & Climate Research Center and a climate specialist with the Department of Extension. You can also follow Aaron on social media: @dwweather-Facebook or @drwilsonsWx-Twitter.

Pumpkin Hybrid Review – 2017

In an effort to help growers select and grow the best pumpkins for their operation, the Integrated Pest Management Program planted a demonstration trial at the Western Ag Research Station in South Charleston to highlight foliage, handle, fruit size, and fruit quality. There were 20 entries from four companies in the trial, with emphasis placed on hybrids that offered some type of disease resistance, primarily to powdery mildew. The intent of the trial was primarily for growers who attended the pumpkin field day to observe differences in plant and fruit quality in person, in order to generate a visceral opinion and appreciation for the hybrid.

The trial was originally direct seeded June 1st, but due to mice damage and flooding rains, was replanted with transplants June 16th. Approximately 75 pounds of nitrogen was side dressed as liquid 28-0-0 on June 9th, with no P or K applied per soil test recommendations. Strategy and Dual were used pre-emerge to control weeds, with shielded applications of glyphosate followed by hoeing and hand weeding throughout the season. Once powdery mildew was detected in these plots on July 24th, they were sprayed on a 7-10 day schedule with a standard fungicide program that alternated several modes of action, per OSU recommendations.

While specific trial data was collected, because it was not replicated or randomized, all calculations for yield and fruit size should be seen as estimates taken from one site, under a specific set of weather conditions. When making decisions about hybrid selection for 2018, this information should be combined with other trial data from around the state or region. This trial was not irrigated, and received above average rain fall for this location based on historical records.

Group shot of pumpkin hybrid trial, large fruit in top row, medium sized fruit in middle row, and small fruit in bottom row.

To obtain average fruit weight, 3-5 fruit of each hybrid per plot representing the largest, smallest, and average sized fruit were chosen and weighed. All other marketable fruit in plot were counted and used in yield calculation, which was based on a 15’ row spacing, 35’ length of row, with plant spacing 3-4’ apart.

If you have additional questions about the trial, contact me directly at jasinski.4@osu.edu.

Yield data from pumpkin hybrid trial, see above for yield estimates. *indicates reduced stand in trial.


Seed companies and other pumpkin hybrid attributes from 2017 trial. PMR = powdery mildew resistant, PMT = powdery mildew tolerant.