What Does a Trade Deal Promise for Soybean Exports?

Source: Hubbs, T. “What Does a Trade Deal Promise for Soybean Exports?.” farmdoc daily (9):207, Department of Agricultural and Consumer Economics, University of Illinois at Urbana-Champaign, November 4, 2019
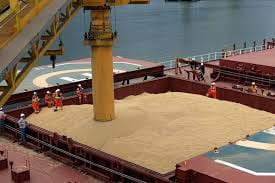
The proposed Phase 1 trade deal with China continues to move toward a resolution.  An initial announcement of $40-50 billion a year of agricultural exports gradually morphed into a $20 billion arrangement. Subsequently, a scenario popped up from Chinese trade commentators framing increased U.S. agricultural imports as China market demands require.  Stronger soybean prices appear to have priced in much of the recent export activity and leave the question of what if any change in soybean exports may come from the new deal.

USDA projections for Chinese soybean imports in 2019-20 are at 3.12 billion bushels, up 73 million bushels over the previous marketing year estimate.  The ongoing issues with swine fever led to the Chinese hog herd estimates coming in around 40 percent below last year.  Despite the reduced herd, Chinese attempts at rapid herd expansion and alternative feed use for soybeans to meet protein demands keep soybean imports from falling.  China reported soybean imports of 301 million bushels in September, with the vast majority of those coming from Brazil.  In the run-up to this latest round of negotiations, China exempted 10 million metric tons (367.4 million bushels) of U.S. soybean imports from tariffs.  Through October 24, China’s total commitments for U.S. exports sit near 227 million bushels.  Space exists for more buying under the current tariff exemption.  The implementation of a trade deal in November appears set to change the nature of soybean exports over the next year.


While the prospect of expanded export totals to China appears promising, the overall increase in soybean export may not be at levels equivalent to Chinese buying.  During the 2018-19 marketing year, the U.S. shipped 489 million bushels of soybeans to China and 1.258 billion bushels to the rest of the world.  Soybean exports to the rest of the world increased 41 percent from the previous marketing year as the U.S. picked up the slack witnessed from large Chinese buying out of South America.  A reversion to higher South American exports to the rest of the world’s major importers seems assured under expanded Chinese buying of U.S. soybeans.  Projections for non-Chinese soybean imports for the world are expected to decrease around 10 million bushels to 2.318 billion bushels for the marketing year.  It seems unlikely China would walk away from the trade relationships built over the last year and a half during the trade war.  Particularly when substantial uncertainty remains about the prospects of a long-term deal.  Significant Chinese buying from non-U.S. sources should continue.

The projection for U.S. soybean exports during the marketing year is 1.775 billion bushels.  This forecast is 7 million bushels higher than last marketing year’s total exports.  Soybean accumulated exports through October 24 equaled 292 million bushels, 21 million bushels above last year’s pace.  As of October 24, 416 million bushels of soybean had been sold for export but not shipped.  The outstanding sales total sits close to 100 million bushels below last year at this time despite increased Chinese buying.  The current unshipped export sales to China totaled 167 million bushels.  In the five marketing years before the onset of the trade war, U.S. exports to China averaged 37.7 percent of China’s total imports.  If the trade deal saw a reversion to that historical average, soybean exports to China this marketing year come in at 1.18 billion bushels.  By factoring in export substitutions related to expanded South American shipments to non-Chinese nations, expansion of U.S. exports by 70 – 100 million bushels above the present 1.775 billion bushel projection seems realistic.  This scenario remains strongly dependent on production levels in the U.S. and South America and the final framework for the trade deal.

World soybean production is set for much lower totals in 2019 due to the reduction in U.S. acreage.  U.S. soybean production is projected at 3.55 billion bushels for the 2019 crop.  The present yield forecast of 46.9 bushels per acre may see a further decline with the November 8 crop production report.  The continued deterioration of the U.S. crop diminishes the potential for massive increases in soybean exports that do not impact soybean crush profitability.  Brazilian production is forecast to be 5.3 percent higher than last year as higher export demand drove an increase in acreage.  Projected harvested acreage in Brazil sits at 91.2 million acres, up from 88.7 million acres last year.  Brazil’s soybean yield in 2018-19 came in at 48.5 bushels per acre.  The yield projection for the current crop is 49.5 bushels per acre.  Dry conditions and a slow start to planting in many areas may decrease the potential for a larger yield.  Argentine soybean production is forecast at 1.947 billion bushels, down a little over four percent from last year’s estimate.  The evolving nature of Argentine politics injects considerable uncertainty into future profitability for farmers in the region.  When considering the potential for the Brazilian crop, the market share of exports remains crucial in determining soybean export potential this marketing year.

Expanded soybean exports under the proposed trade agreement look probable.  The magnitude of this expansion may not be at the levels many hoped for when accounting for changing trade flows associated with South American export potential.  A substantial production shortfall from any of the major producing nations holds the potential for major changes to trade flows over the next year.

Discussion and graphs associated with this article available here:

Continue reading What Does a Trade Deal Promise for Soybean Exports?

Fall fertilizer considerations in 2019

Source: Emerson Nafziger, Univ. of Illinois

While this article is written for Illinois many of the concepts apply in Ohio.

The high number of prevented-planting fields in some areas, the late start to harvest, and the inability to apply P and K fertilizer as planned last fall or this past spring combine to raise a number of questions about fall application of P, K, and lime over the next few months.

Prevented-planting fields

If P and K fertilizers were applied last fall or this past spring but no crop could be planted, there’s no reason not to count all of the applied P and K as available for the 2020 crop. The same goes for any lime applied over the past 12 months. Any nitrogen (N) that was applied with MAP or DAP is likely no longer available, and shouldn’t be counted in the 2020 supply.

If the plan was to sample soil last fall or this spring to determine how much P, K, and lime to apply but that didn’t get done, these fields can be sampled now in preparation for fall or spring application. If the plan was to sample after the 2020 crop, there’s no reason to move that up to this fall; these nutrients didn’t (and won’t) go anywhere. By the same token, there’s no reason not to apply after two years based on estimated removal using the same P and K rates set to be applied a year ago. Unless a cover crop has been or will be harvested from a prevented-planting field this fall, removal will be zero.

Our most recent numbers to use for estimating P and K removal (see my Bulletin article with details) are 0.37 (.35 in Ohio) lb P2O5 and 0.24 (.20 in Ohio) lb K2O per bushel of corn and 0.75 (.79 in Ohio) lb P2O5 and 1.17 (1.14 in Ohio) lb K2O per bushel of soybean.


We mentioned last spring the concern about the “fallow syndrome” that’s been associated with having no crop in a field for an entire growing season. This problem, which appears as a phosphorus deficiency, has been more commonly seen in fields or parts of fields where water has stood for much of the season; it was reported in the Mississippi River bottomlands in 1994 following the flood of 1993, when water stood on parts of fields through much of the summer. If weeds or cover crops grew on prevented-planting fields for most of this summer, especially in August and September, the crop-friendly fungi (VA mycorrhizae, or VAM) that prevent this problem likely are still present, and there’s no cause for concern.

In low-lying spots where water stood into mid-summer, and in fields kept weed-free through the summer by tillage or herbicide, we can’t rule out a possible problem due to loss of VAM. There are commercial preparations of VAM that can be applied in-furrow to inoculate corn next spring. In most cases, it will be enough to make sure there’s adequate P close the seed so the crop can take it up as growth begin, after which VAM will start to regrow in the roots of the new crop. Growing a cover crop this fall will restart VAM growth this fall, and should rule out the need for any additional steps next spring.

A year without a crop is used deliberately in some dry regions to store water for the next crop, but is a novelty for most Illinois fields. So we don’t have much research to help predict what this might mean for the next crop: is “fallow” in 2019 more like soybean or more like corn in its effect on the 2020 crop? We think the answer is “neither” – that 2019 will instead be an “amnesty” year, in which any effects of the 2018 crop got canceled or at least minimized, leaving open the choice of crop in 2020. Wheat planted this fall can be expected to do well on fields where neither corn nor soybean grew in 2019, as long as we get rid of plants that can serve as a reservoir of insect-vectored diseases (see Nathan Kleczewski’s Bulletin article on this), take care not to plant too early, and provide enough P for the crop.

The extent to which weeds or cover crops grew and matured might influence how having no crop this year might affect next year’s crop. Any addition to the weed seed supply could complicate weed control going forward. Large quantities of mature (high-carbon, low nitrogen) residue produced this year may act much like corn crop residue, increasing the N requirement for a 2020 corn crop. Because weed or cover crop growth requires soil water, there may be a little less stored soil water next spring in fields where there was a lot of growth this year. But most fields that didn’t grow a crop this year are likely to have more water stored in the soil now, and should also have more mineralized N, both because less N was taken up by a crop, and because there is less residue whose breakdown ties up N. These increases may well diminish by next spring, but they still might be helpful to next year’s crop, whether that’s corn or soybean. In using the N rate calculator to set corn N rates in fields with no crop and minimal weed or cover crop growth this year, I suggest choosing soybean as the previous crop; in fact, with no removal of mineralized N from the soil by soybean this year, it might be appropriate to also set N rates for next year’s corn crop a little lower (within the MRTN range) than usual. In fields with a lot of residue present now, it might be more appropriate to select “corn” as the previous crop when using the calculator.

Fields with a crop in 2019

If neither soil sampling nor P and K application could be done as planned for the 2019 crop, the yield-based estimate of nutrient removal by this year’s crop can be added to the estimate of removal by crops grown since the last application. The urgency of the need to apply “catch-up” P and K depends on soil test levels the last time the field was sampled: if P and K levels are already high, there’s less concern about yield loss even if 2019 ends up being a “skipped” year of replacement. Yields in some fields will also not be as high in 2019 as they were in 2018, meaning less nutrient removal. But any of the immobile nutrients like P and K that were removed with harvest of any crop will need to be replaced at some point if soil test levels are to be maintained.

Other than less nutrient uptake in fields where yields are lower than expected this season, soil sampling and nutrient management can continue as usual in fields where a crop was grown this year. In the drier parts of Illinois, late-planted crops took up water (and matured or will mature) later than normal, although the total amount of water taken up is less where yields are lower. Where it’s dry enough to make it difficult to get a soil probe to the proper depth, we can expect soil samples to show more variability than usual, especially in K test levels. This is due both to variable depth of samples and to the effect of dry soils on K extractability. Samples taken from dry soils often show lower than expect soil test K levels because K cations get trapped in clay lattices. Test levels of pH and P are less affected than the K test by soil moisture before and during sampling. Dry soils are rare in the spring, and so soil test levels, especially of K, are more consistent when measured on samples taken in the spring.

Fertilizer application

Soils are currently dry enough to allow application of dry fertilizer materials over much of Illinois; the wettest part of the state is northwestern Illinois, where the crop still has to mature. Harvest started slowly in Illinois, but with the warm weather this week, it will accelerate quickly as long as it stays dry. The development of wet conditions could slow both harvest and fertilizer application that follows harvest, but soils in the drier parts of Illinois can take in an inch or two of rainfall without turning muddy or forcing much delay. Most people are anxious to start applying fertilizer after the delays and frustration in getting this done over the past year.

There has been a considerable amount of discussion about whether or not placing P fertilizer beneath the soil surface is a sound practice. The main reason for doing this is to keep the P in MAP or DAP, which is highly soluble, from dissolving and running down slopes and into streams in the event of heavy rain. How much of this might occur is affected by slope, permeability of the surface soil, how dry the soil is, how much crop residue is present, and the intensity of rainfall. Soils following soybean harvest are generally more permeable than following corn harvest, but corn leaves more residue. Tillage increases surface permeability, but also loosens soil to make it move more readily with runoff water. Drier soils can take in more water before runoff begins than can wet soils.

October and November are drier months, on average, than spring months, crops growing into the fall extract a significant amount of water from the soil thus leaving it drier, and high-intensity rainfall events are less likely in the fall. So overall, chances of getting high-loss conditions are lower in the fall than in the spring, but they aren’t zero. Surface-applied P will move into the soil under normal weather conditions, and will end up safe from direct loss (it can still move if soil runs off the field) by December. Most research has shown no yield benefit to subsurface P and K placement in the fall, and it is not clear that the added cost of subsurface placement will provide a positive return in most years and on most fields. In strip-till systems, however, where subsurface placement doesn’t add to the amount of surface soil disturbance, applying P and K beneath the strip while strip-tilling in the fall may be a cost-effective way to apply these nutrients.

Although we’ve found that the N in DAP tends to be available to the next year’s crop if DAP is applied after soils cool down to 50 degrees, applying MAP or DAP when soils are warm will allow much of the ammonium from these materials to convert to nitrate in the fall; once it’s nitrate it can move down with water into and through the soil, including to tile lines if there’s a lot of rainfall. Even if the N doesn’t move too far down in the soil in the fall before the soil freezes, it will have a head start when water begins to move through the soil in the spring. There can also be direct movement of ammonium (along with P) in surface runoff during heavy rainfall before the MAP or DAP has had a chance to dissolve and move into the soil.

While it may not be practical to hold off on applying MAP or DAP until soil temperatures fall to below 50 degrees, we should recognize that even though the amount of N in these fertilizers is relatively small, it can add appreciably to the N that moves to surface waters through drainage tile. One solution that has been suggested is to switch from using MAP/DAP as the P source to using triple-super-phosphate (TSP, 0-46-0) which contains no N. If TSP is available at about the same cost per pound of P as MAP or DAP, it would be a good source to use, especially for applications made before mid-October. The “free” N that comes with MAP or DAP is more likely to reach tile lines than the roots of next year’s corn crop if it’s applied when soils are warm in the fall. If it’s applied after soil temperatures reach 50 degrees or if it’s applied next spring, the N in MAP or DAP does contribute to the N supply for next year’s crop.

Continue reading Fall fertilizer considerations in 2019

Field Drying and Harvest Losses in Corn

Source: Peter Thomison, OSU (edited)

Late corn plantings and sporadic rain in some areas are not helping with field drying. Some growers are delaying harvest until grain moisture drops further. However, these delays increase the likelihood that stalk rots present in many fields will lead to stalk lodging problems (Fig. 1). Leaving corn to dry in the field exposes a crop to unfavorable weather conditions, as well as wildlife damage. A crop with weak plant integrity is more vulnerable to yield losses from stalk lodging and ear drop when weathering conditions occur. Additional losses may occur when ear rots reduce grain quality and can lead to significant dockage when the grain is marketed. Some ear rots produce mycotoxins, which may cause major health problems if fed to livestock.

Several years ago we conducted a study that evaluated effects of four plant populations (24,000, 30,000, 36,000, and 42,000 plants/A) and three harvest dates (early-mid Oct., Nov. and Dec.) on the agronomic performance of four hybrids differing in maturity and stalk quality. The study was conducted at three locations in NW, NE, and SW Ohio over a three-year period for a total of eight experiments. Results of this study provide some insight on yield losses and changes in grain moisture and stalk quality associated with delaying harvest. The following lists some of the major findings from this research.

Key Findings:

Continue reading Field Drying and Harvest Losses in Corn