source: Michael Staton, MSU Extension (edited), John Barker OSU Extension
 Results from 40 on-farm replicated trials conducted in Michigan from 2015 to 2018 build a compelling case for reducing soybean planting rates.
Michigan soybean producers have consistently identified planting rates as the highest priority topic to evaluate in on-farm replicated trials. Furthermore, the producers wanted to evaluate the effect of low planting rates on soybean yield and income. The two factors driving the increased interest in reducing soybean planting rates are seed cost and white mold. To help Michigan soybean producers make planting rate decisions, the SMaRT (Soybean Management and Research Technologies) program conducted a total of 40 on-farm replicated trials from 2015 to 2018. Please see Figure 1 for the trial locations.
Eleven planting rate trials were conducted each year from 2015 to 2017 and seven trials were conducted in 2018. Four target planting rates (80,00, 100,000, 130,000, and 160,000 seeds per acre) were compared at all but one location where the lowest rate was not included. Stand counts were taken to determine actual final plant stands at each location in all years. To calculate the income (gross income – seed cost) generated by each planting rate, we used the USDA projected prices and average seed costs for treated seed for each year. None of the varieties planted in the trials were straight line or thin line plant type and a complete seed treatment was used at 33 of the locations.
 Because we conducted the trials over four years, we learned how the planting rates performed over a range of growing conditions. Planting conditions were nearly ideal in 2015 but were much more challenging in 2016, 2017 and 2018 as evidenced by the average stand loss shown in Table 1. Statewide record yields were achieved in 2015 and again in 2016. However, yields declined significantly in 2017 due to excessive early rains and a lack of rain in August and September. Yields rebounded in 2018.
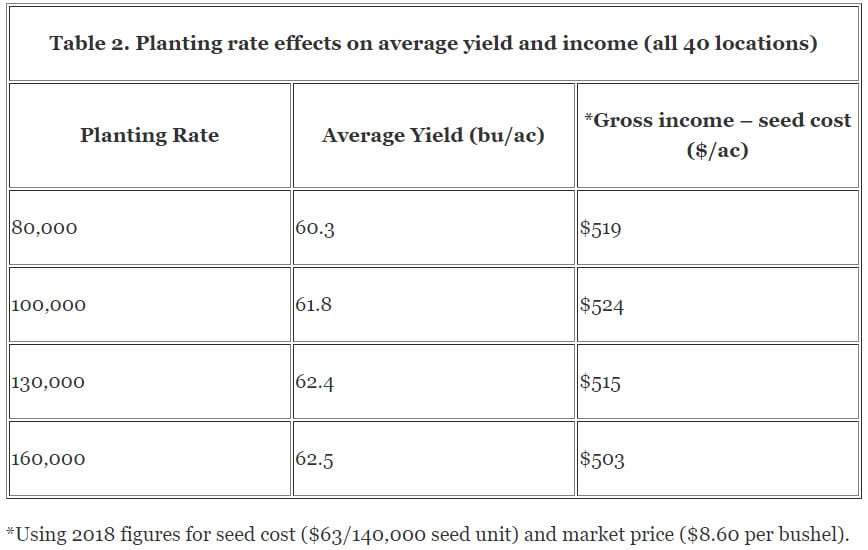
The effects of soybean planting rates on yield and income are shown in Fgure 2. The bars represent yield and the lines represent income. The figure clearly shows the year-to-year variability in yield and income. It also shows that the lowest two planting rates were the most profitable in 2015 and 2018 and the highest planting rate was the least profitable each year. Table 2 shows the average yield and income for all 40 locations.
 When all 40 sites were combined, the yields from the highest two planting rates were identical and they beat the 100,000 seeds per acre planting rate by less than one bushel per acre and the 80,000 rate by only 2.2 bushels per acre. The 100,000 seeds per acre planting rate generated the most income.
These results are very similar to the 2018 Knox County Soybean Seeding Rate Trials shown below.
Click here to see the 2018 Knox County data from plot #1
Click here to see the 2018 Knox County data from plot # 2

