Overview
This page contains information on an exploratory study of America’s public universities as seen through multiple lenses, including the distinction between land-grant and non-land-grant universities, flagship versus non-flagship universities, and universities operating under various Carnegie Classification tiers. The purpose of this page is to generate dialogue about the preliminary findings.

How the Principal Investigators Came Together
Stephen M. Gavazzi, a professor in the College of Education and Human Ecology at The Ohio State University, wrote a book with West Virginia University President E. Gordon Gee for Johns Hopkins University Press entitled Land-Grant Universities for the Future: Higher Education for the Public Good. As a follow-up to this book, he continues to pursue questions about what makes land-grant universities different than other public institutions of higher learning.
David V. Rosowsky completed six years as Provost and Senior Vice President at the University of Vermont and is taking a sabbatical before returning to the civil engineering department as Professor. He has been using his sabbatical year to engage in several writing projects, many of which are aimed at better understanding current and future issues facing America’s public universities.
Gavazzi and Rosowsky began to interact on a variety of social media platforms, and soon discovered many overlapping interests. Partnerships on several projects were discussed, with a keen eye toward grounding some of their conceptual ideas within cold hard data. And the database most likely to be used in their joint exploration was IPEDS, the Integrated Postsecondary Education Data System.
For that reason, Rosowsky reached out to the nearest IPEDS data expert he knew, who just happened to also be employed at UVM. That data expert was Alexander Yin, the Executive Director of UVM’s Office of Institutional Research, who has been using the IPEDS database to track UVM activities associated with improved retention and graduation rates, decreased time to degree, and the collection and reporting of post-graduation outcomes.
![]()
The Basics of the Study
Together, the three individuals leading this project began to discuss how the IPEDS database could be used to answer one of Gavazzi’s most pressing questions — how land-grant universities are different from other public universities – with an enlarged set of queries about other potential differences among the non-land-grant institutions. In other words, the questions not only surrounded the land-grant versus non-land-grant distinction, but also distinctions between flagship and non-flagship status, and among the different Carnegie Classification levels.
Also, there was another “within group” land-grant distinction they were interested in examining: were there differences between the 1862 and 1890 land-grant institutions? There were a variety of reasons to believe so, but that question also further concretized the need to examine a wider assortment of non-land-grant public institutions.
To make the comparisons more “apples to apples,” they decided to constrain their comparisons to those doctoral granting institutions that contained at least 10,000 students (by headcount). Within this truncated collection of public universities, they decided to focus on two key variables: 1) average revenue and expenditures related to educational costs; and 2) the percent of educational costs per student FTE covered by tuition and fees.
Methodology
All financial and student information was collected from the Integrated Postsecondary Education Data System (IPEDS) for the 2016-17 academic year. The criterion for institutions in the study were all public doctoral institutions with at least 10,000 students (headcount). This narrowed the number of institutions for the study to 173, where each institution was classified into one of eight categories (Table 1) using the 2015 Carnegie Classifications of doctoral institutions.
Using the financial revenue and expense categories in IPEDS,[1][2] the following variables were utilized or created for each institution:
- Tuition and fees per student FTE (tuition and fees after deducting discounts and allowances divided by student FTE);
- Federal dollars per student FTE (sum federal operating grants and contracts, appropriations, and non-operating grants divided by student FTE);
- State dollars per student FTE (sum of state operating grants and contracts, appropriations, and non-operating grants divided by student FTE);
- Local dollars per student FTE (sum of local operating grants and contracts, appropriations, and non-operating grants divided by student FTE); and
- Total education costs per student FTE (sum of instructional costs, academic support costs, student services costs, and scholarships and fellowships and expenses divided by student FTE).
Descriptive statistics were then used to examine the relationships between revenue and expenditures and the institutional categories.
Table 1: Descriptive Statistics of Institutional Categories and Student Size (2016-17)[3]
| Category | n | Average Student
Headcount |
Standard Deviation Student Headcount | Minimum Student
Headcount |
Maximum Student Headcount |
| Land Grant and Flagship | 30 | 36,600 | 19,794 | 12,693 | 106,328 |
| Land Grant, Not Flagship | 21 | 32,684 | 13,201 | 14,032 | 70,245 |
| Flagship, Not Land Grant | 20 | 34,963 | 13,093 | 13,267 | 67,935 |
| HBCU and Land Grant | 2 | 11,682 | 885 | 10,797 | 12,566 |
| HBCU, Not Land Grant | 2 | 10,930 | 256 | 10,674 | 11,185 |
| Not Flagship nor Land Grant nor HBCU (R1) | 29 | 41,616 | 19,498 | 19,834 | 118,390 |
| Not Flagship nor Land Grant nor HBCU (R2) | 43 | 24,990 | 7,930 | 10,011 | 43,018 |
| Not Flagship nor Land Grant nor HBCU (R3) | 29 | 20,461 | 7,649 | 10,087 | 44,790 |
| Total | 176 | 30,703 | 16,019 | 10,011 | 118,390 |
Table 2: Average Revenue and Expenditures related to Educational Costs of Public Doctoral Institutions (2016-17)
| Category | Avg.
Tuition and Fees per Student FTE |
Avg. Federal Dollars per Student FTE | Avg. State Dollars per Student FTE | Avg. Local Dollars per Student FTE | Avg. Educational Costs per Students FTE |
| Land Grant and Flagship | $12,758 | $6,781 | $11,884 | $260 | $22,494 |
| Land Grant, Not Flagship | $11,936 | $5,742 | $9,620 | $188 | $19,253 |
| Flagship, Not Land Grant | $13,410 | $7,856 | $8,480 | $283 | $24,310 |
| HBCU and Land Grant | $5,404 | $3,529 | $10,668 | $47 | $15,833 |
| HBCU, Not Land Grant | $6,967 | $3,177 | $7,045 | $12 | $15,985 |
| Not Flagship nor Land Grant nor HBCU (R1) | $11,689 | $6,069 | $8,215 | $104 | $22,958 |
| Not Flagship nor Land Grant nor HBCU (R2) | $9,801 | $1,904 | $6,711 | $36 | $17,525 |
| Not Flagship nor Land Grant nor HBCU (R3) | $7,327 | $791 | $6,273 | $35 | $13,382 |
| All Institutions | $10,791 | $4,405 | $8,365 | $131 | $19,525 |
Figure 1: Average Revenue and Expenditures related to Educational Costs of Public Doctoral Institutions (2016-17)
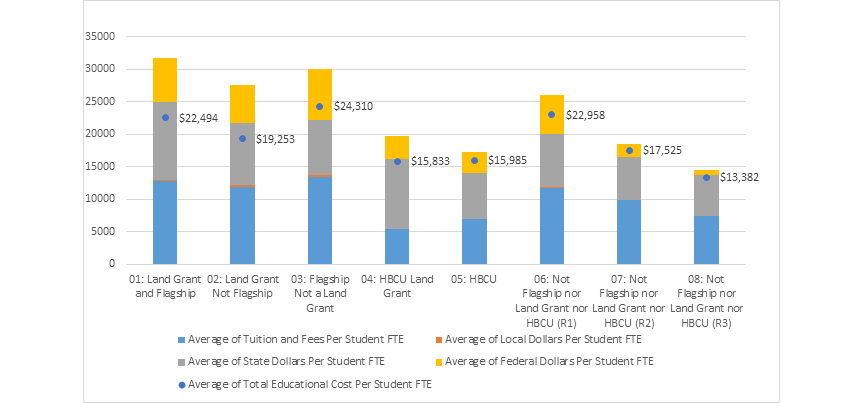
Table 2: Percent Educational Costs per Student FTE covered by Tuition and Fee per Student FTE
| Category | % Tuition and Fees Cover Educational Costs |
| HBCU and Land Grant | 35.0% |
| HBCU, Not Land Grant | 43.3% |
| Not Flagship nor Land Grant nor HBCU (R3) | 55.5% |
| Flagship, Not Land Grant | 56.6% |
| Not Flagship nor Land Grant nor HBCU (R1) | 57.3% |
| Not Flagship nor Land Grant nor HBCU (R2) | 58.3% |
| Land Grant and Flagship | 58.3% |
| Land Grant, Not Flagship | 64.3% |
| All Institutions | 57.8% |
Results
At present, we wish to focus attention on three main findings.
- Land grants, public flagships, and R1 regional public universities spend more per student FTE than HBCU’s and non-R1 regional public universities.
- HBCUs generate the lowest revenue per student FTE. While their state dollars per student FTE are comparable to non-HBCUs, the federal dollars per student FTE also are lower than non-HBCUs (although not as low as non-R1 regional public universities, likely a reflection of their lower research activity)
- Tuition and fees at HBCUs cover the lowest percentage of total educational costs (averaging less than 40%) per student FTE. All others (i.e., non-HBCUs) appear to be comparable (55%-58%) with the exception of land grant, not flagship institutions (64%), for reasons not immediately obvious, possibly because they have lower research expenditures and/or fewer professional programs (often full-tuition bearing).
Questions for Commentators
For starters, we want readers to share their criticisms of our methodology and/or assumptions.
We also are looking forward to hearing reader thoughts on additional analyses, provided the data are available. This could include different ways of looking at (parsing, grouping, etc.) the same data OR including additional data, schools, categories, etc.
We also want to hear reader suggestions for whether and how to include other available data sources (if there are any) to augment what we are able to get from IPEDS.
Finally, we are interested in reader thoughts on how these data and/or findings might be useful in their own work or spheres of influence. For example, work with legislatures, campus communications around strategic priorities/initiatives, admissions and aid decisions, role of Extension, broader service to State and citizens, etc.
Feel Free to Contact Us Directly!
If you do not wish to use the comment box on this page, please feel free to write to any or all of us!
Steve Gavazzi is at gavazzi.1@osu.edu
David Rosowsky is at David.Rosowsky@uvm.edu
Alex Yin is at Alexander.Yin@uvm.edu
Appendix A: Land Grant and Flagship
| Louisiana State University and AgrAlexander.Yin@uvm.eduicultural & Mechanical College |
| New Mexico State University-Main Campus |
| Ohio State University-Main Campus |
| Pennsylvania State University |
| Rutgers University-New Brunswick |
| The University of Tennessee-Knoxville |
| University of Alaska Fairbanks |
| University of Arizona |
| University of Arkansas |
| University of California-Berkeley |
| University of Connecticut |
| University of Delaware |
| University of Florida |
| University of Georgia |
| University of Hawaii at Manoa |
| University of Illinois at Urbana-Champaign |
| University of Kentucky |
| University of Maine |
| University of Maryland-College Park |
| University of Massachusetts-Amherst |
| University of Minnesota-Twin Cities |
| University of Missouri-Columbia |
| University of Nebraska-Lincoln |
| University of Nevada-Reno |
| University of New Hampshire-Main Campus |
| University of Rhode Island |
| University of Vermont |
| University of Wisconsin-Madison |
| University of Wyoming |
| West Virginia University |
Appendix B: Land Grant, Not Flagship
| Auburn University |
| Clemson University |
| Colorado State University-Fort Collins |
| Iowa State University |
| Kansas State University |
| Michigan State University |
| Mississippi State University |
| Montana State University |
| North Carolina State University at Raleigh |
| North Dakota State University-Main Campus |
| Oklahoma State University-Main Campus |
| Oregon State University |
| Purdue University-Main Campus |
| South Dakota State University |
| Texas A & M University-College Station |
| University of California-Davis |
| University of California-Riverside |
| University of Idaho |
| Utah State University |
| Virginia Polytechnic Institute and State University |
| Washington State University |
Appendix C: Flagship, Not Land Grant
| Indiana University-Bloomington |
| The University of Alabama |
| The University of Montana |
| The University of Texas at Austin |
| University at Buffalo |
| University of Colorado Boulder |
| University of Iowa |
| University of Kansas |
| University of Michigan-Ann Arbor |
| University of Mississippi |
| University of New Mexico-Main Campus |
| University of North Carolina at Chapel Hill |
| University of North Dakota |
| University of Oklahoma-Norman Campus |
| University of Oregon |
| University of South Carolina-Columbia |
| University of South Dakota |
| University of Utah |
| University of Virginia-Main Campus |
| University of Washington |
Appendix D: HBCU and Land Grant
| Florida Agricultural and Mechanical University |
| North Carolina A & T State University |
Appendix E: HBCU, Not Land Grant
| Jackson State University |
| Texas Southern University |
Appendix F: Not Flagship nor Land Grant nor HBCU (R1)
| Arizona State University |
| Florida International University |
| Florida State University |
| George Mason University |
| Georgia Institute of Technology-Main Campus |
| Georgia State University |
| Stony Brook University |
| SUNY at Albany |
| Temple University |
| Texas Tech University |
| The University of Texas at Arlington |
| The University of Texas at Dallas |
| University of Alabama at Birmingham |
| University of California-Irvine |
| University of California-Los Angeles |
| University of California-San Diego |
| University of California-Santa Barbara |
| University of California-Santa Cruz |
| University of Central Florida |
| University of Cincinnati-Main Campus |
| University of Houston |
| University of Illinois at Chicago |
| University of Louisville |
| University of North Texas |
| University of Pittsburgh-Pittsburgh Campus |
| University of South Florida-Main Campus |
| University of Wisconsin-Milwaukee |
| Virginia Commonwealth University |
| Wayne State University |
Appendix G: Not Flagship nor Land Grant nor HBCU (R2)
| Ball State University | The University of Texas at El Paso |
| Binghamton University | The University of Texas at San Antonio |
| Bowling Green State University-Main Campus | University of Akron Main Campus |
| Central Michigan University | University of Colorado Denver/Anschutz Medical Campus |
| Cleveland State University | University of Louisiana at Lafayette |
| East Carolina University | University of Maryland-Baltimore County |
| Florida Atlantic University | University of Massachusetts-Boston |
| Illinois State University | University of Massachusetts-Lowell |
| Indiana University-Purdue University-Indianapolis | University of Memphis |
| Kent State University at Kent | University of Missouri-Kansas City |
| Miami University-Oxford | University of Missouri-St Louis |
| New Jersey Institute of Technology | University of Nevada-Las Vegas |
| Northern Arizona University | University of New Orleans |
| Northern Illinois University | University of North Carolina at Charlotte |
| Ohio University-Main Campus | University of North Carolina at Greensboro |
| Old Dominion University | University of Northern Colorado |
| Portland State University | University of South Alabama |
| Rutgers University-Newark | University of Southern Mississippi |
| San Diego State University | University of Toledo |
| Southern Illinois University-Carbondale | Western Michigan University |
| Texas A & M University-Commerce | Wichita State University |
| Texas State University |
Appendix G: Not Flagship nor Land Grant nor HBCU (R3)
| Boise State University |
| California State University-Fresno |
| California State University-Fullerton |
| East Tennessee State University |
| Eastern Michigan University |
| Georgia Southern University |
| Idaho State University |
| Indiana State University |
| Indiana University of Pennsylvania-Main Campus |
| Lamar University |
| Louisiana Tech University |
| Middle Tennessee State University |
| Montclair State University |
| Oakland University |
| Rowan University |
| Sam Houston State University |
| San Francisco State University |
| Tennessee Technological University |
| Texas A & M University-Corpus Christi |
| Texas A & M University-Kingsville |
| Texas Woman’s University |
| The University of Texas Rio Grande Valley |
| The University of West Florida |
| University of Arkansas at Little Rock |
| University of Louisiana at Monroe |
| University of Nebraska at Omaha |
| University of West Georgia |
| Valdosta State University |
| Wright State University-Main Campus |
[1] For more information regarding the IPEDS revenue categories see: https://surveys.nces.ed.gov/ipeds/VisInstructions.aspx?survey=5&id=30085&show=all#chunk_1396
[2] For more information regarding the IPEDS revenue categories see: https://surveys.nces.ed.gov/IPEDS/VisInstructions.aspx?survey=5&id=30067
[3] Please Appendices A – G for institutions within each category