Lab 8
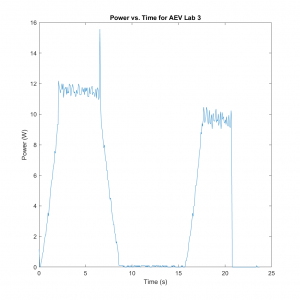
Power usage graphs for the AEV configuration intended for the first performance test.
Advanced Research and Development 1 (Lab 6 and 7)
Power usage graphs for the AEV during battery testing for advanced research and development. We made the AEV run at 40% power for a fixed distance of 4 feet across 4 separate trials. Based on the graphs, it was noted that there was little variation of power usage between the trials, indicating that the battery could be expected to perform to run consistently across trials.
Below is the power usage graph for one of the trials:
Lab 3
Energy vs. Distance Graph

For this graph, it shows the AEV’s energy use compared to distance traveled. The slope is constant throughout most of the run, meaning the energy required to move the vehicle along the track remains constant at roughly .39 Joules. It also shows that the energy required to get it moving was much more than once it go moving at a constant speed.
Energy vs. Time Graph
For this graph, it shows the AEV’s energy use compared to time (in seconds). At the beginning and in of the track run is when the AEV used the least amount of energy, and at the middle of the total time is when the most energy is used. The graph hits it’s peak at 6 seconds, when the vehicle was going from forward to backward movement.


