By Ben Brown, Department of Agricultural, Environmental and Development Economics, The Ohio State University- August 25, 2020
Click here to access complete article as PDF
Agricultural producers across the United States are periodically allowed to enroll in federal commodity programs offered through the Federal Government. These programs contribute to a public safety net protecting against variations in year to year revenue due to reductions in production, price or both. Since the 1930s, Congress has authroized a federal Farm Bill every 5-7 years providing a variety of programs to producers, agribusinesses, landowners, and consumers. Economic conditions, producer preferences, world integration, and political appetite have influenced the federal safety net over the last 90 years causing introduction, implemetnation, and in some cases repeal of programs. The current suite of Title 1. commodity programs authroized in The Agricultural Adjustment Act of 2018 (2018 Farm Bill) includes: two revenue protection programs for row crop producers through Agricultural Risk Coverage (ARC) and Price Loss Coverage (PLC) programs, Marketing Assistance Loans (MAL), and programs for dairy and sugar producers. In some cases an election must be made between programs to complete enrollment. This article estimates county based ARC and PLC payments for enrolled Ohio producers for the 2019 program year, which ends September 30, 2020. In the case payments are triggered, distribution to producers will happen later in 2020 calendar year.
Introduction
Enrollment dates for federal commodity programs depend on specifics in the implementing documents, but regularly occur every fiscal year. Election into programs does not have to match enrollment. For instance, the 2018 Farm Bill allowed producers one election period between ARC and PLC for 2019 and 2020 program years combined (September 1, 2019- March 15, 2020), but had two separate enrollment periods (program year 2019: September 1, 2019- March 15, 2020 and program year 2020: October 1, 2019- June 30, 2020). For 2021, 2022 and 2023 program years, enrollment and election periods will happen simultaneously (October 1- March 15). Producers will also be allowed to adjust their elections between ARC and PLC starting in the 2021 program year (October 1, 2020- March 15, 2021.) Payments are calculated and distributed at the conclusion of the program year.
The ARC program provides shallow loss revenue protection using yields and national Marketing Year Average (MYA) prices to calculate a historical revenue benchmark. Payments are triggered when the product of current year yields and the commodity specific national MYA price falls below 86% of the historical benchmark. Producers have the option between two versions of ARC: ARC-Individual (ARC-IC) and ARC-County (ARC-CO). Yields provided by invidual Farm Service Agency (FSA) farm numbers are used for ARC-IC; whereas, county area yields are used for ARC-CO. The PLC program is a shallow loss protection program using an nationwide effective reference price per commodity as the benchmark. PLC payments trigger when the national MYA price falls below the effective reference price. More information about ARC and PLC program mechanics can be found in The Ohio State Unviersity’s Guide to the 2018 Farm Bill Commodity Programs (Brown, Griffith, and Zoller, 2019).
Data and Methodology
The payment rates presented in this article are estimates calculated by the author as of the published date. Official ARC-CO and PLC payment rates are released by FSA typically in October of the following year. Payments to FSA farmer numbers enrolled in ARC-IC are individual to the farm and cannot be estimated on a county wide basis. Noteworthy, the 2018 Farm Bill blends ARC-CO yields across county lines based on share of acres enrolled by that FSA Farm in each county.
Yields
Historical yields (2013-2017) for ARC-CO are provided by FSA. The 2019 program year is the first-year historical yields were trend adjusted, as the 2014 Farm Bill used reported yields in the historical benchmark calculation. County yields used in this article for ARC-CO are author calculations using 2019 Risk Management Association (RMA) area yields weighted by irrigation practice. A previous article explains these yield estimates (Brown, 2020). County yields may differ from these estimates, as FSA reserves the right to adjust ARC-CO yields.
For the PLC program, the national payment rate per bushel is multiplied by the individual FSA farm yield on file. Producers have the option to update their FSA farm yields by commodity for program year 2020 and any future years or programs using these values up to September 30, 2020. More information on PLC Yield Updates can be found in the OSU Farm Bill Handbook. For program year 2019, PLC yields match FSA farm yields used under the 2014 Farm Bill.
National Prices
National MYA prices are not official for the 2019/20 marketing year for all commodities. Wheat has a marketing year that runs June 1- May 31, whereas corn and soybean have marketing years that run September 1- August 31. National MYA prices are calculated by multiplying the monthly commodity price received by producers and the percent of the crop estimated to have been marketed that month. The national MYA is often higher than producer prices in areas with relatively weak basis values and lower than producer prices in areas with relatively strong basis values. The estimated MYA prices used in this report are calculated by using National Agriculture Statistics Service reported prices for months available: June through May on Wheat and September through June for corn and soybeans. Futures prices with a national average basis adjustment are used for July and August in the case of corn and soybeans. All months are then multiplied by a 5-year average marketing weight. The estimated national MYA prices used for ARC and PLC are included in Table 1.
The 2018 Farm Bill created commodity specific effective reference prices building on the reference prices congressionally set in the 2014 Farm Bill. Effective reference prices for program year 2019 are included in Table 1.
Table 1. 2019 Effective Reference Prices and Estimated 2019-20 Market Year Average Prices
| 2018 Statutory Reference Price | 2019 Effective Reference Price | 2019/20 Market Year Average Price | PLC Payment Rate ($/bu.) | |
| Corn | $3.70/bu. | $3.70/bu. | $3.58/bu. | $0.12/bu. |
| Soybeans | $8.40/bu. | $8.40/bu. | $8.60/bu. | $0.00/bu. |
| Wheat | $5.50/bu. | $5.50/bu. | $4.61/bu. | $0.89/bu. |
2019 Corn ARC-CO and PLC Estimates
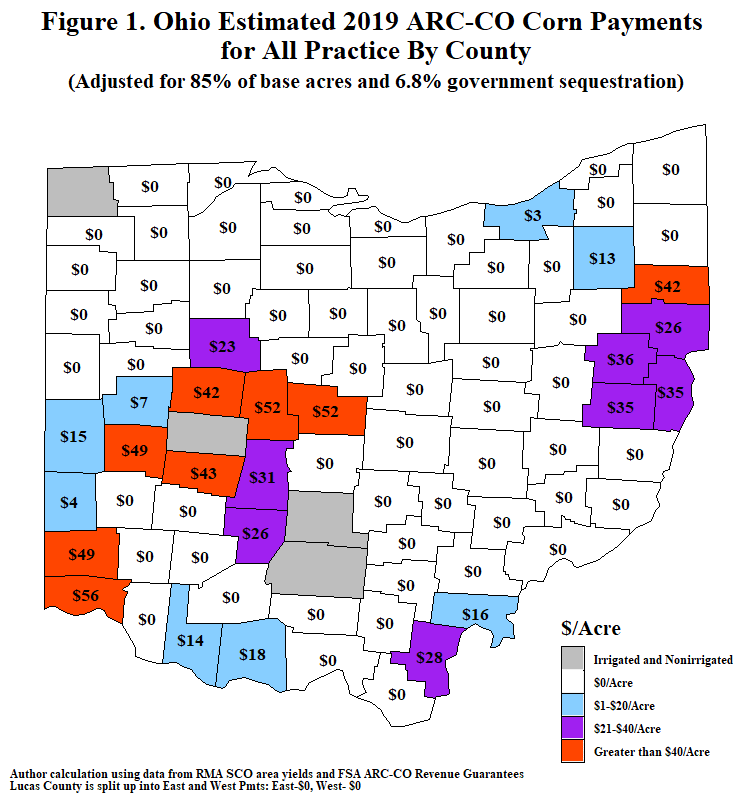
Figures 1, 2, 3, and 4 illustrate estimated corn ARC-CO and PLC payment rates per county. The payment rates listed have been adjusted to pay out on 100% of a producer’s eligible base acres. Without the adjustment, producers would need to multiply their eligible base acres by 85%. Payments have also been reduced by an anticipated government sequestration of 6.8%.
Illustrated in Figure 1 are the rates for Ohio ARC-CO corn payments for those counties with no separation in irrigation practices. As mentioned earlier, some counties have both an irrigated and nonirrigated ARC-CO program. Four Ohio counties have both an irrigated and nonirrigated corn program: Champaign, Pickaway, Ross, and Williams. The payment rates for these counties by irrigated and nonirrigated yields are illustrated in Figures 2 and 3, respectively. Thirty Ohio counties are expected to trigger ARC-CO corn payments with an average payment of $33/eligible corn base acre with a range of $0-$66 per acre.


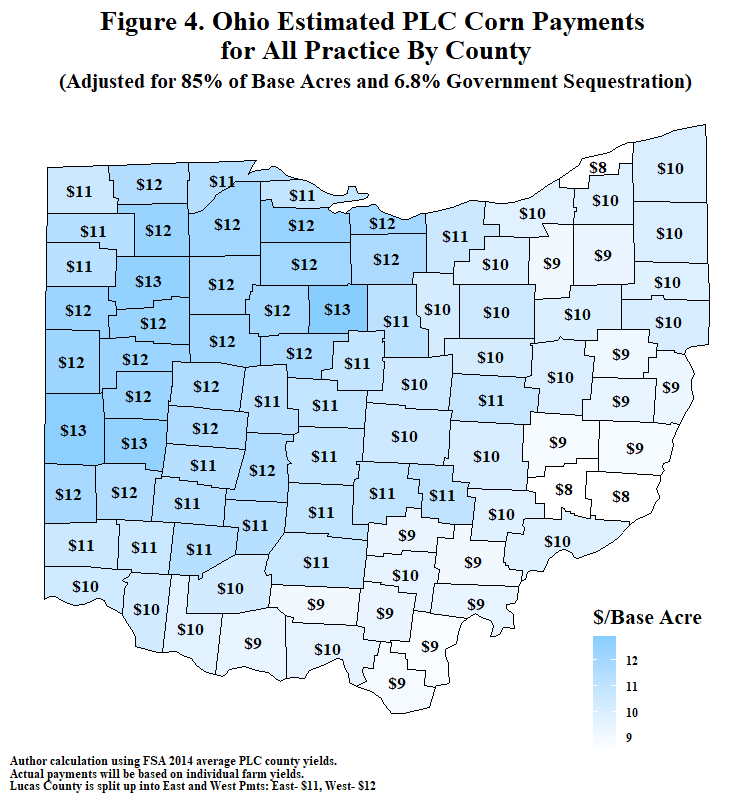
Ohio corn PLC estimated rates per county are illustrated in Figure 4. As a reminder PLC rates are sensitive to the MYA price as every $0.05 per bushel change in the MYA price translates to $8-$10 per acre. PLC rates are multiplied by the FSA farm yield instead of the county average yield used by the author. County average yields are meant to represent all farms in a county but will be low for some farm numbers and higher for others. With an estimated $0.12 per bushel payment triggered across the country, most Ohio producers should see a payment between $8-$13 per acre payments, a much smaller range in payments compared to ARC-CO. Ohio corn participation rates between ARC and PLC are not known, but 76% of producers nationwide elected PLC for program year 2019. University decision tools ubiquitously forecasted large 2020 program year PLC payments with few expecting 2019 program year payments. Reduction in ethanol production due to COVID-19 lowered the 2019/20 MYA price and increased the probability of PLC payments.
2019 Soybean ARC-CO and PLC Estimates
Figures 5, 6, 7, and 8 illustrate estimated soybean ARC-CO and PLC payment rates per county. Like corn, payments have been adjusted to apply on 100% of base acres and a 6.8% sequestration.
Illustrated in Figure 5 are the rates for Ohio ARC-CO soybean payments for those counties with no separation in irrigation practices. Eleven Ohio counties have both an irrigated and nonirrigated soybean program: Allen, Auglaize, Champaign, Hardin, Putnam, Seneca, Shelby, Union, Ver Wert, Williams, and Wyandot, represented in grey. The payment rates for these counties by irrigated and nonirrigated yields are illustrated in Figures 6 and 7, respectively. Fifty Ohio counties are expected to trigger ARC-CO soybean payments. Of those counties triggering payments, the average payment is $26/eligible base acre with a range of $0-$48. Three counties (Belmont, Monroe and Noble) did not have sufficient yield data or base acres enrolled in ARC-CO.


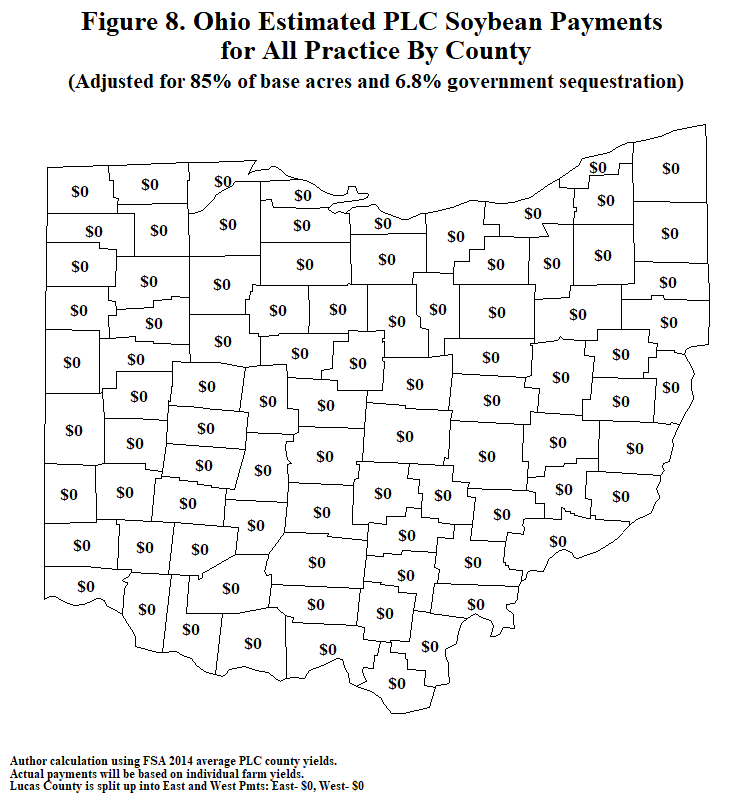
It is not likely soybeans will trigger a PLC payment in program year 2019. With an effective reference price of $8.40, the current forecasted MYA price of $8.60 is $0.20 above the required threshold. This will not be surprising to many producers as 14% of soybean base acres were enrolled in PLC, whereas 86% were enrolled in either ARC-CO or ARC-IC. During the Farm Bill election period, university decision tools did not forecast PLC payments in 2019 and only a small change of payments for program year 2020. Anecdotally, producers expressed a greater likelihood their county yields would come in lower than the historical benchmark for ARC-CO compared to the MYA falling below the effective reference price.
2019 Wheat ARC-CO and PLC Estimates
Figures 9 and 10 illustrate estimated wheat ARC-CO and PLC payment rates per county, respectively. Like corn and soybeans, payments have been adjusted to apply on 100% of base acres and a 6.8% sequestration.
Illustrated in Figure 9 are the rates for Ohio ARC-CO wheat payments. There are no Ohio counties that have both an irrigated and nonirrigated ARC-CO wheat program. County yields are weighted based on the share of irrigated and nonirrigated insured aces to create a yield for all practices. Seventy-three Ohio counties are expected to trigger ARC-CO wheat payments. Of those counties triggering payments, the average payment is $32/eligible base acre with a range of $0-$40. Twelve Ohio counties (represented in black) have missing yield data or do not have enrolled base acres of wheat for program year 2020.
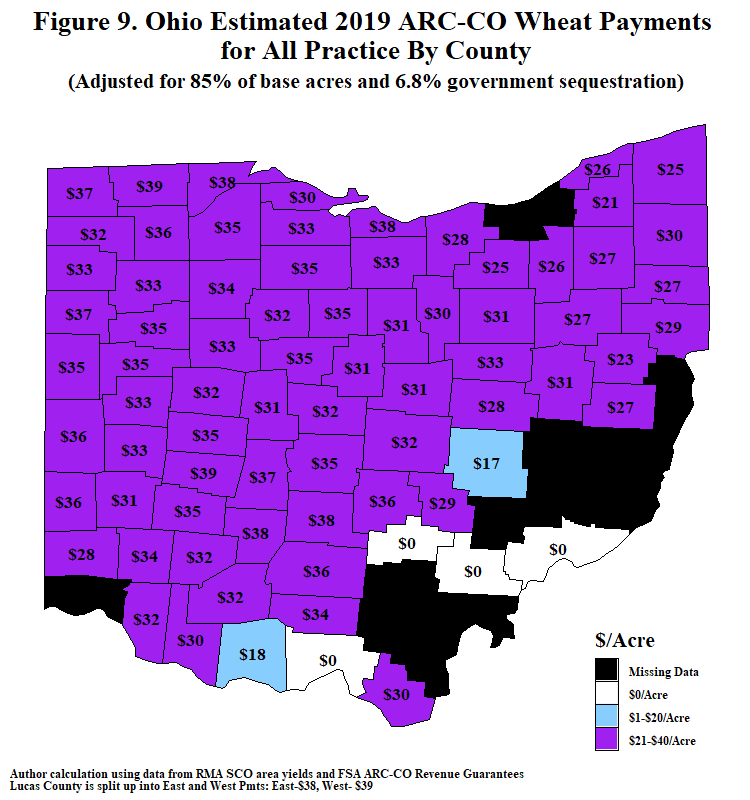

Figure 10 illustrates the estimated wheat PLC county payment rates. Given that the marketing year for wheat has concluded, it is all but certain the national MYA wheat price will fall below the effective reference price of $5.50 per bushel. The estimates used in this report estimate a national MYA price of $4.61/bushel while the World Agricultural Outlook Board in the August World Agricultural Supply and Demand Estimates forecast a MYA price of $4.58 per bushel. A $0.03 per bushel difference amounts to roughly a $1.60 per acre payment difference. The estimates for wheat payments between ARC-CO and PLC are similar in size. University decision aides forecasted a large PLC payment for program year 2019 and potentially for program year 2020. While there was the possibility wheat would trigger ARC-CO payments it was not as large as the probability for PLC. Nationwide 93% of producer chose PLC for eligible wheat base acres vs 7% for ARC.
Conclusion
This article estimates county level Agricultural Risk Coverage and Price Loss Coverage payment rates for program year 2019, which are expected to be announced by the Farm Service Agency later in calendar year 2020. These estimates are calculated using Risk Management Agency area yields and forecasted market year average prices in August of 2020.
- Yields and prices may differ from these assumptions, but these estimates should provide producers with an idea of cash flow from 2018 Farm Bill authorized programs.
- Farms with acres in multiple counties will have a blended ARC-CO yield for all enrolled acres within a specific commodity and FSA farm number. The entire data file with historical benchmarks is posted at go.osu.edu/farmbill2019
- National participation rates show producers favored PLC for corn and wheat, but ARC for soybean base acres.
- County corn payments are higher for ARC-CO than PLC, but not all counties are expected to trigger an ARC-CO payment. For program year 2019, all county units are expected to trigger a PLC payment while thirty county units out of ninety-three are expected to trigger ARC-CO payments.
- No county unit is expected to trigger a PLC soybean payment while fifty out of one hundred are expected to trigger ARC-CO payments.
- Wheat payment frequency and size are approximately the same between ARC-CO and PLC, but the majority of wheat base acres are enrolled in PLC.
- As a reminder, enrollment for the 2021 program year starts October 1, 2020 and ends March 15, 2020.
References
Brown, B. “Evaluating Ohio Yield Possibilities for 2019 Agricultural Risk Coverage County Level Payments.” AEDE Agricultural Report 2020:014, Department of Agricultural, Environmental, and Development Economics, The Ohio State University, August 25, 2020. https://aede.osu.edu/sites/aede/files/imce/images/2019%20Ohio%20RMA%20Yields.pdf
Brown, B., M. Griffith, C. Zoller. “The Ohio State University’s Guide to the 2018 Farm Bill Commodity Programs.” AEDE Agricultural Report 2019:012 Department of Agricultural, Environmental, and Development Economics, The Ohio State University, November 12, 2019. https://aede.osu.edu/sites/aede/files/imce/images/Farm%20Bill%20Decision%20Central%20Guide_0.pdf
United States Department of Agriculture- Farm Service Agency. “2019 Covered Commodity Contract Base Acres (and Percentage) on Enrolled Farms by Program by Commodity.” https://www.fsa.usda.gov/Assets/USDA-FSA-Public/usdafiles/arc-plc/2019/pdf/enrolled_base_2019.pdf
United States Department of Agriculture- Farm Service Agency. “2019 Effective Reference Price Calculations.” August 12, 2020. https://www.fsa.usda.gov/Assets/USDA-FSA-Public/usdafiles/arc-plc/2019/pdf/2019_ERP.pdf