By Ben Brown, Department of Agricultural, Environmental and Development Economics, The Ohio State University- August 10, 2020
Click here to read PDF version of article
The Agricultural Adjustment Act of 2018 (2018 Farm Bill) made minor structural changes to both the Agricultural Risk Coverage (ARC) and Price Loss Coverage (PLC) programs in relation to the Agricultural Adjustment Act of 2014 (2014 Farm Bill). However, one of the nonstructural changes made in the 2018 Farm Bill adjusts the primary yield sources in creating Farm Service Agency (FSA) yields for the ARC-County program. Starting with the 2019 program year, which runs from September 1, 2019- August 31, 2020 for corn and soybeans and June 1, 2019- May 31, 2020 for wheat, Risk Management Agency (RMA) yield data is the preferred data source in a cascading formula for FSA county yields, whereas National Agricultural Statistics Service (NASS) data previously severed as the primary source. Realizing FSA reserves the right to adjust county yields, area-based RMA yields can only estimate, not predict, final FSA county yields. This article reviews RMA area-based reported yields for the 2019 crop year in Ohio and compares them to county-based NASS survey yields released February 21, 2020.
Cascading Yield Preference
Considerable debate during the passage of the 2018 Farm Bill related to accuracy of county-based yields and yield differences between county yields for the ARC-County commodity program. FSA is authorized to make commodity program payments, but uses external agency yield data to create ARC-County yields. While both RMA and NASS report county-based yields, NASS yields are based on voluntary farmer-reported survey results, whereas, RMA county yields are based on farmer certified yields as completion of crop insurance contracts. Fraudulent crop insurance reporting is subject to criminal liability. Legislators perceive RMA data to be more accurate even though there is no statistical difference between the two data sets. After years of using NASS yields as a primary data source for FSA yields, Congress mandated FSA to use RMA yields. FSA holds the right to adjust RMA yields before setting 2019 ARC-County yields.
Two scenarios where FSA may adjust RMA yields before certifying county yields:
- there is a low number of insured acres in a county for the respective crop overweighting county yields on few acres and
- counties where RMA insured yields are significantly different than NASS reported survey yields.
Table 1. Cascading Method for Certified FSA Yields.
| 2014 Farm Bill | 2018 Farm Bill |
| 1. National Agricultural Statistics Service | 1. Risk Management Agency |
| 2. Risk Management Agency | 2. National Agricultural Statistics Service |
| 3. State Farm Service Agency Committee | 3. State Farm Service Agency Committee |
RMA and NASS yield data comprises approximately 90% of the historical base acres enrolled in ARC-County. The State FSA Committee uses any available data for the remaining 10%.
Area RMA Yields and Blended Irrigated and Non-irrigated Yields
Not all insured acres in a county for a specific crop are used to calculate county yields, as not all individual policies trigger an insurance claim. Yields are captured for area-based insurance policies to calculate potential revenue or yield policy indemnities. Area policies are not as popular as individual policies across the country, but policy participation varies. This study uses Supplemental Coverage Option yield data as the assumed RMA data source. Area-based RMA policies are also released by practice (organic, irrigated, following another crop, and others). The 2018 Farm Bill adjusted the ARC program by authorizing specific counties to have both irrigated and non- irrigated ARC-County eligible payments. For counties with one combined ARC payment rate a blended yield is used by weighting the share of acres in each practice. Figures 1, 3, and 5 illustrate the blended yield per county for Ohio. Figures 2, 4, 6 illustrate the percent change between RMA SCO yields and NASS survey yields. Shaded counties have NASS yields larger than one standard deviation either positive or negative.

According to RMA, Clinton County had the highest area yield at 193 bushels per acre, whereas Carroll County had the lowest area yield at 95 bushels per acre. NASS estimated the state corn yield to be 164 bushels per acre. Corn irrigation is a relatively minimal practice in Ohio compared to other corn producing states. Four Ohio counties do have both an irrigated and non-irrigated ARC- County payment: Champaign, Pickaway, Ross, and Williams. For 2019, there was no reported difference between irrigated and non-irrigated yields in any of the four counties.

Figure 2. illustrates percent change of NASS survey yields from RMA reported yields. Thirteen out of sixty-eight counties were greater than one standard deviation. Red and purple shadded counties are where RMA and NASS were noticably different in yield reports. These thirteen counties have the greatest likelihood of being adjusted before FSA certifies the county yield.
For soybeans, there were three counties where RMA did not have either insured soybean acres or enough data points to protect producer identification: Belmont, Monroe, and Noble. Clinton County had the highest soybean yield at 59 bushels/acre, where Coshocton had the lowest at 31 bushel/acre. Eleven Ohio counties receive sepearte ARC-County payment rates by practice- Allen, Auglaize, Champaign, Hardin, Putnam, Seneca, Shelby, Union, Van Wert, Williams, and Wyandott. Only four had different irrigated and non-irrigated yields as represented by Table 2.
Table 2. Irrigated and Non-irrigated Soybean Yields (bushels per acre).
| Practice | Champaign | Union | Williams | Wyandot |
| Irrigated | 53 | 49 | 56 | 49 |
| Non-irrigated | 44 | 43 | 50 | 47 |
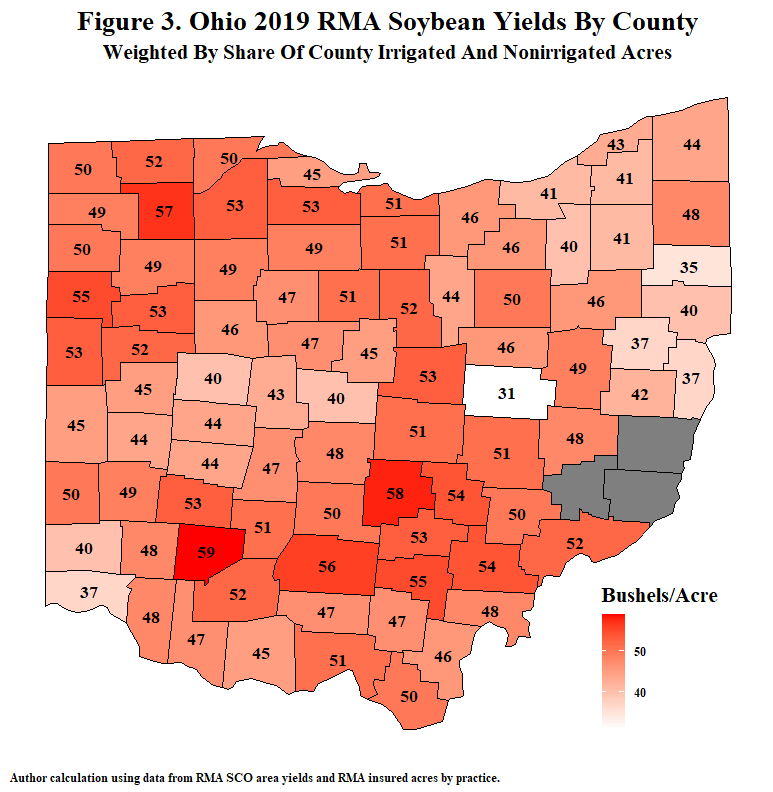
Figure 4. illustrates percent change of NASS survey yields from RMA reported yields. Grey shaded counties are counties were either NASS or RMA data was missing. Since, NASS yields are derived from a voluntary producer survey, a certain number of responses are required to generate an appropriate sample size. Frequent rains during the spring of 2019 delayed planting in parts of Ohio and some counties that normally have NASS soybean yields did not have enough observations to calculate a NASS yield, represented in Figure 4 by grey shading. Eleven Ohio counties had a NASS value that was greater than one standard deviation from the corresponding RMA yield. Most notable were Lawrence where the reported SCO RMA yield was 50 bu./acre and a NASS survey yield of 35 bu./acre for a deviation of almost 45%. Conversely, Coshocton County had an RMA yield of 31 bu./acre, but a NASS yield of 45 bu./acre and a nearly a 31% deviation.

Seventy-six Ohio counties had a reported RMA wheat yield in comparison to fifty-eight with NASS survey yields. Wheat yields were highest in Southwest and South Central Ohio and weakest in Northeast Ohio. Although, Fulton County in Northwest Ohio had the stronger wheat yield at nearly 70 bu./acre. Medina County had the smaller wheat yield at almost 28 bu./acre. Ohio does not have any counties with both an irrigated and non-irrigated wehat ARC-County payment.
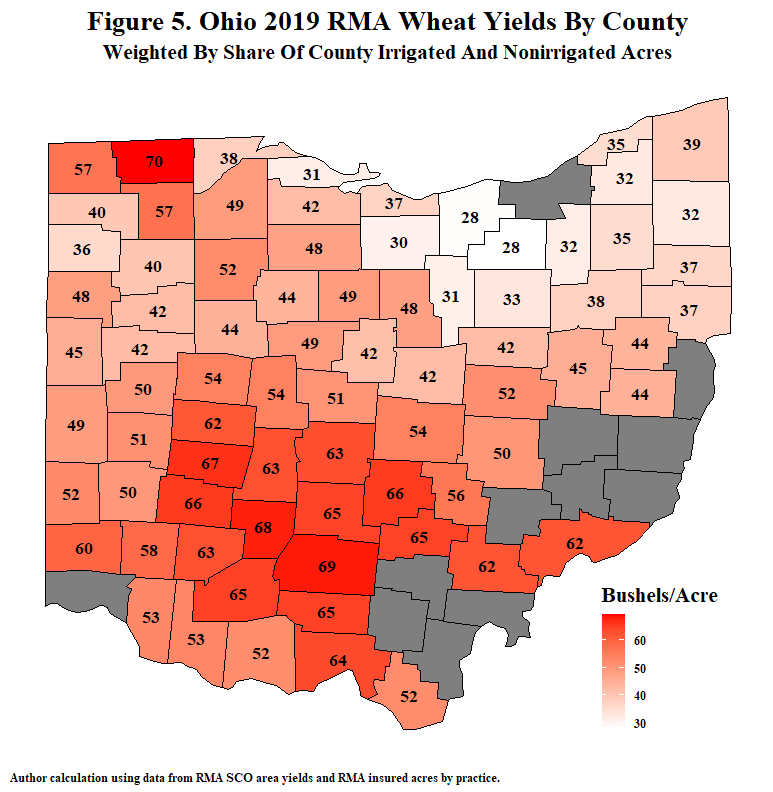
In comparison to corn and soybeans, wheat had the largest amount of Ohio counties where the NASS survey yield was outside one standard deviation at twenty-six counties and the largest percent deviations (Figure 6). It is likely the largest number of county adjustments to certified FSA yields will be for wheat. The majority of counties indicate NASS wheat yields are higher compared to RMA reported yields, foreshadowing a greater change of triggering ARC-county payments.
Conclusion
Final FSA yields and corresponding ARC-County payment rates will not be released to the public for several more weeks. However, the cascading yield discovery method established in the 2018 Farm Bill identifies RMA reported area yields as the first source for FSA county data. Using SCO area yields and weighting by share of irrigated and non-irrigated acres should be a good indication of FSA certified yields expected to be released in October. FSA does hold the right to adjust yields using other available data. Counties with a deviation greater than one standard deviation in NASS survey yields and RMA reported yields will be the most likely candidates for adjustments. County wheat yields are more likely to be adjusted than corn and soybeans.
References
United States Department of Agriculture- Farm Service Agency. “Agriculture Risk Coverage and Price Loss Coverage Program Handbook.” Page 5-131. October 28, 2019. https://www.fsa.usda.gov/Internet/FSA_File/1-arcplc_r01_a03.pdf
United States Department of Agriculture- National Agricultural Statistics Service. “Ohio Corn County Estimates 2019.” February 21, 2020. https://www.nass.usda.gov/Statistics_by_State/Ohio/Publications/County_Estimates/2019/2019_OH_corn_CE.pdf
United States Department of Agriculture- National Agricultural Statistics Service. “Ohio Soybean County Estimates 2019.” February 21, 2020. https://www.nass.usda.gov/Statistics_by_State/Ohio/Publications/County_Estimates/2019/2019_OH_soy_CE.pdf
United States Department of Agriculture- National Agricultural Statistics Service. “Ohio Wheat County Estimates 2019.” December 12, 2020. https://www.nass.usda.gov/Statistics_by_State/Ohio/Publications/County_Estimates/2019/2019_CE_Wheat_Ohio.pdf
United States Department of Agriculture- Risk Management Agency. “2019 County Supplemental Coverage Option Yields.” July 15, 2020. https://webapp.rma.usda.gov/apps/RIRS/SCOYieldsRevenuesPaymentIndicators.aspx