Corn Ear Rots: Identification, Quantification and Testing for Mycotoxins

By Pierce Paul OSU Extension

Ear rots differ from each other in terms of the damage they cause (their symptoms), the toxins they produce, and the specific conditions under which they develop. So, a good way to determine whether you do have a major ear rot problem this year is to quantify the disease in your field and get suspect samples tested for mycotoxins. And the best way to tell the difference among the ear rots is to know the types of symptoms they produce.

TRICHODERMA EAR ROT – Abundant thick greenish mold growing on and between the kernels make Trichoderma ear rot very easy to distinguish from Diplodia, Fusarium, and Gibberella ear rots. However, other greenish ear rots such as Cladosporium, Penicillium and Aspergillus may sometimes be mistaken for Trichoderma ear rot. Like several of the other ear rots, diseased ears are commonly associated with bird, insect, or other types of damage. Another very characteristic feature of Trichoderma ear rots is sprouting (premature germination of the grain on the ear in the field). Although some species of Trichoderma may produce mycotoxins, these toxins are usually not found in Trichoderma-affected ears under our growing conditions.

DIPLODIA EAR ROT – Diplodia causes a thick white mass of mold to grow on the ear, usually initiating from the base of the ear and growing toward the tip. Eventually the white mold changes to a grayish-brown growth and infected kernels appear glued to the husk. Infected ears are usually lightweight and of poor nutritional value. When infections occur early, the entire ear may become moldy. When infections occur late, only a fine web of fungal growth appears on and between the kernels.

Continue reading Corn Ear Rots: Identification, Quantification and Testing for Mycotoxins

Don’t forget to calibrate your yield monitor

By John Barker Ohio State Extension

Remember the old adage … Garbage in = Garbage out.  Many of us use our yield data to make additional management decisions on our farms such as hybrid or variety selection, fertilizer applications, marketing, etc.  Data from an uncalibrated yield monitor can haunt us for many years by leading us into improper decisions with lasting financial affects.  In today’s Ag economy we can ill afford any decision with adverse financial implications.

Monitoring yield

The two biggest reasons I usually hear for not calibrating a yield monitor are 1) I just don’t have time to do it or 2) I can’t remember how to do it without getting my manual out.  While I know it’s easy to criticize from “the cheap seats,” I would argue that this could be some of the most important time you spend in your farming operation each year.  Like many other tasks on our farm, the more we do it, the easier it gets. Yield monitor data has so much value!  This data provides a summary (in term of yield) of every single decision you made on your farm during the past year.


Below is a calibration checklist created by Dr. John Fulton and Dr. Elizabeth Hawkins.

Prior to Harvest

  • Back up data from the previous season, if not already completed.
    • Best practices:
      • Copy each season’s data to a unique folder labeled as the year and yield data.
      • Maintain several backup copies of the display/raw data in different locations in case it is lost, stolen, damaged, or modified.
      • Delete old files from the memory card or USB drive.
      • Delete old files from display memory if close to full.
  • Check any data cards or USB drives to be sure they work properly with your display.
  • Contact your local dealer or manufacturer to make sure that you have the most recent software and firmware upgrades for your yield monitoring and mapping system, the display, DGPS receiver, and other components. You can obtain information about these upgrades through your manufacturer’s website or by contacting technical support.
  • Check all cables, connections, and sensors for wear or damage. Ensure that wiring and harness connections are tight.
  • For clean grain elevator-mounted moisture sensor units:
    • Make sure the sensor is clean and not damaged.
    • Clear the clean grain elevator of old grain and debris.
    • Check to be sure the manual clean-out motor works on the moisture sensor.
  • Inspect the yield sensor:
    • For combines with a mass flow sensor (normally located at the top of the clean grain elevator):
      • Look for wear on the flow sensor’s impact or deflector plate and replace the plate if worn or damaged. There have been cases where a hole in the plate exists, greatly increasing the risk of inaccurate yield readings.
      • Look for any excessive wear on the grain elevator and missing or worn paddles.
      • Check to make sure that the spacing between the paddles and the top of the elevator meets the manufacturer’s requirements.
      • Ensure the clean grain elevator chain is tightened to manufacturer specifications.
    • For combines with an optical sensor (mounted on the side of the clean grain elevator):
      • Make sure the sensors are clean and not damaged.
      • Ensure the clean grain elevator paddles are not rubbing against sensors.
  • If you purchase a new or used combine with an existing yield monitor installed, double check to make sure it is installed properly. Especially check that the mass flow sensor is mounted securely.
  • If a grain cart with scales or a weigh wagon is used to weigh grain harvested for yield monitor calibration loads, double check that they are producing accurate weight data. Check weigh wagon weights against certified scales each season to ensure the load estimates are within a few percent and use the same scales throughout calibration.
  • Avoid running electrical wires next to the GPS antenna which may cause interference with the receiver signal. Running wires perpendicular to each other decreases the chance for electrical noise that may occur from other electronics.
  • The calibration operation will require accurate estimates of moisture content of the harvested grain. Portable moisture meters commonly used on the farm vary widely in terms of their estimate accuracy. If you are not certain of the accuracy of your grain moisture meter, take it to a local grain elevator that has a federally approved moisture meter and compare estimates on grain samples, preferably samples representing a wide range of grain moisture, e.g., 13 to 28 percent grain moisture content.
    • Document differences between your meter and the meter known to be accurate. As an example:
      • Your meter estimates 25 percent; accurate meter estimates 28 percent.
      • Your meter estimates 20 percent; accurate meter estimates 22 percent.
      • Your meter estimates 15 percent; accurate meter estimates 16 percent.
    • During the yield monitor calibration operation, use the documented moisture estimate differences to adjust the estimates of moisture made on grain sampled from the harvested calibration loads.
    • It is still recommended to always check moisture content estimates with a federally-approved moisture meter.

During Operation, Prior To Calibration

  • Start up combine and turn on the yield monitor display to check the following:
    • Display indicates everything is functioning correctly or is properly connected.
    • Memory card or USB drive is installed properly, if required.
      • Make sure there is proper communication between the data card and the in-cab display for those displays requiring a memory card to collect data; mostly older displays such as the Ag Leader PF series display. Usually an error message will appear on the display indicating there is no communication with the card.
    • DGPS receiver is providing a position and has differential correction (WAAS, SF1, SF2, RTX, or RTK).
      • Note: If purchasing a differential correction service, make sure your subscription runs through harvest.
  • Check and set header switch for starting and stopping of data collection.
    • Raise and lower the header to make sure the stop-height switch operates properly.
    • Automatic On/Off using the switch: Most yield monitors will step through the electronical setting of the start (header down position) and stop (header up position) positions for the switch during initial calibration. However, you may want to check annually or change when moving between corn and platform headers since these are operated at different heights.
    • Manual On/Off: Some yield monitors are equipped with a manual button that turns on and off data collection through the in-cab display. You may have to adjust the header height switch to accommodate the preferences of different operators during harvest.
  • Set row width according to number of rows for a row crop header or the appropriate width of a cutting platform header.
    • Some yield monitors have the option to use automatic swath width detection to adjust the swath width when overlap is detected. This feature can be helpful when harvesting point rows or near field edges; however, be aware it may not function properly if your DGPS source has a potential for large positional error (e.g. WAAS) or if there is signal interference or loss.
  • Engage the separator and observe the elevator speed on the in-cab display to make sure the shaft sensor is operating correctly. The clean grain elevator speed (e.g. RPM) is used as feedback for computing the yield estimate since speed controls the frequency of which grain from the elevator paddles impact the mass flow sensor.

Calibration

The yield estimate produced by a yield monitor is calculated from estimates made by multiple sensors. Each of these sensors must be calibrated in order for the yield estimate to be accurate. Consult your user manual to determine the sequence in which these calibrations should take place.

Mass-Flow Sensor Vibration Calibration

This calibration is used to document the effect of vibration when the combine is running. Follow the directions in your user manual to complete the vibration calibration. Be sure that:

  • The proper header is attached and in operating position (not resting on ground).
  • The combine is empty of grain.
  • The separator and header are engaged.
  • The combine is running at full RPM.

Temperature Calibration 

This calibration ensures accuracy of the grain moisture estimates made by the moisture sensor in the clean grain elevator. Most manufacturers suggest this calibration only be performed once at the beginning of the season.

  • Perform this calibration when the combine has been sitting for several hours and preferably in a shaded area. Ensure the combine and moisture sensors are empty of grain.
  • Estimate the air temperature using an accurate thermometer.
  • Adjust the temperature value reported by the display according to the user manual.
    • Some displays require you to simply enter the temperature reading from the thermometer, others require you to enter an offset value (usually the difference between the thermometer reading and the sensor reading).

Moisture Sensor “Calibration”

This “calibration” is necessary to ensure that the moisture sensor in the clean grain elevator accurately estimates grain moisture content, which in turn is used by the display to calculate “dry” grain yield based on the “dry” moisture value of your choice. The process is not a true calibration because it is based on a single comparison of the display’s estimate of grain moisture from a harvested load, with that estimated from a small sample of grain collected during the off-loading of grain to the wagon, grain cart, or truck.

  • Some manufacturers suggest that moisture “calibration” need only be performed once during the harvest season. Our experience suggests that the accuracy of a moisture sensor can change throughout the season as harvest grain moisture levels change. Check the accuracy of moisture sensor estimates routinely during the season.
    • Be aware that yield monitor displays differ in how they handle changes in grain moisture “calibration.” Some apply changes retroactively to previously harvested grain and others apply changes only to future harvested grain.
  • Reset the moisture offset in the display to zero.
  • Randomly collect grain from each calibration load to obtain a representative sample.
  • Measure the moisture of the grain samples with an accurate grain moisture meter.
  • Enter the difference between the display moisture estimate and the grain sample estimate into the display according to your user manual.
  • Repeat this calibration for each type of grain harvested.

Ground Speed Calibration

Many yield monitors today use GPS to determine ground speed, therefore there is no need for a ground speed calibration. If a mechanical speed sensor is being used as a backup, it should be calibrated. These calibrations are conducted by travelling a known distance through the field and timing how long it takes. When calibrating the ground speed sensor, use typical field conditions rather than a road or waterway. Tire slippage can create inaccuracy with calibration.

Mass Flow Sensor (Weight) Calibration

Proper calibration of the mass flow sensor is crucial to the accuracy of grain flow estimates and, ultimately, the yield estimates. The weight calibration process basically involves harvesting individual loads of grain and verifying the actual weight of the harvested grain with accurate scales. The actual weights of the individual loads are manually entered into the calibration screen of the display. Built-in software procedures then calibrate the display’s weight estimates to best match the scale’s estimates. Display manuals often suggest that calibration errors can be minimized to 5 percent or less. If best management calibration practices are followed, most modern displays can easily be calibrated to 1 percent error or less.

There are two common approaches used for calibration: a near-linear calibration and a non-linear calibration.

  • Near-linear calibrations require one or two calibration loads to generate a calibration line.
    • Many older yield monitors (primarily GreenStar™ displays prior to the S-series combines) use near-linear calibrations.
    • The Precision Planting YieldSense™ system typically requires a single load calibration procedure. It also provides an optional “True Up” feature for tweaking calibration accuracy later in harvest. Of note, the YieldSense™ Grain Property Kit that replaces one of the paddles on the clean grain elevator allows continuous adjustments of the calibration as grain conditions (e.g., test weight) vary.
  • Non-linear calibrations require four or more calibration loads that represent a range of anticipated grain flow rates to generate a calibration curve.
    • Use the number of calibration loads recommended by the manufacturer (commonly four to six calibration loads).

Regardless of the calibration method, the quality of the calibration loads is important. The following best practices can help ensure the calibration is accurate.

  • Calibration loads should be representative of the different grain flow rates (pounds per second or bushels per hour) that will be encountered. It is important to take the time to calibrate the mass flow or volumetric sensors over the full range of expected loads. Note that older GreenStar™ and the Precision Planting YieldSense™ systems follow a different process but regardless, it is good to understand this section.
    • Harvest calibration loads at different flow rates (low to high). The goal is to have each load harvested at a constant and consistent flow rate. Target flow rates can be achieved by:
      • harvesting each load with a full header at different speeds.
      • harvesting each load at a constant speed with different harvested swath widths.
  • When harvesting calibration loads, it is recommended to use loads between 3,000 to 8,000 pounds for most yield monitors. Precision Planting’s YieldSense™ manual does recommend 25,000-pound calibration loads or three 10,000-pound loads. This helps reduce the overall sensor error while calibrating.
  • Avoid starting calibration loads on turn rows, weed patches, or areas of major topography changes in the field.
    • Hillsides and rolling ground can impact calibration load data because of changes in how grain impacts the flow sensor.
    • If you are unable to avoid topographical changes make sure you get a good representation of loads going up- and downhill and side-to-side of a hill.
  • It is necessary to calibrate for each type of grain for each year.
    • Flow rates tend to be much higher when harvesting corn compared to soybeans or wheat.
    • Other grain characteristics that vary between different grain types can alter the reading produced by the mass flow sensor.
    • The dynamics of grain flow through a combine changes with wear and tear.
  • When conducting on-farm research trials or harvesting fields with multiple varieties, consider paying attention to large differences in moisture content; a two to three point swing in test weight between varieties. Again, having calibration curves for high and low moisture or high and low test weight will help collect quality data. Of note, the Precision Planting Grain Property Kit can help adjust yield estimates for swings in test weight within the YieldSense™ monitor.
    • For example, calibrate for regular corn and high oil corn separately due to the differences in test weight and moisture characteristics of the grain.
  • Calibrate for different moisture levels per type of grain.
    • For example, calibrate differently for corn below 20 percent moisture versus corn above 20 percent moisture.

During Harvest

  • Take good notes on field and operating conditions during harvest. This information will be helpful when reviewing yield maps after harvest. Capturing images with your smartphone, iPad, or similar device can be a simple way of collecting visual notes.
  • Correct any malfunctions or errors indicated by the yield monitor, including loss of DGPS signal. Make sure the display is actually collecting data. Sometimes one can manually switch off data collection on the display and forget to turn it back on for older model yield monitors.
  • Remove your memory card or USB drive from the display when not in use and back up data onto your computer and data storage devices frequently throughout the harvest season. A simple electrical shock from improper wiring or lightning can destroy data.
  • It is wise to perform periodic calibration loads throughout a lengthy harvest season to check or improve accuracy of the weight estimates. It is suggested to recalibrate if you observe:
    • more than a 5 percent difference in weight calibration errors,
    • 5 pound per bushel differences in grain test weight, or
    • temperature changes greater than 10 degrees.
  • Be sure to recalibrate after replacing yield monitor components or if changes are made to the elevator chain, paddles, or flow sensor during harvest.
    • Tightening the elevator chain, replacing old paddles, or changing the distance between the flow sensor and paddles changes the accuracy of the previous calibration.
  • If you run into problems with the monitoring equipment during harvest, check the troubleshooting information in the operator’s manual. Contact technical support if you are unable to solve the issue.
  • The use of telemetry or wireless data transfer offers the ability to transfer data automatically from the in-cab display to the “cloud.” Every OEM along with third party companies offer wireless data transfer technology improving the ability to seamlessly transfer data to the “cloud” providing backup for your data along with the ability to access online.

Converting Wet Corn Weight to Dry Corn Weight

By: R.L. (Bob) Nielsen Purdue University

Corn is often harvested at grain moisture contents higher than the 15% moisture typically desired by grain buyers. Wetter grain obviously weighs more than drier grain and so grain buyers will “shrink” the weight of “wet” grain (greater than 15% moisture) to the equivalent weight of “dry” grain (15% moisture) and then divide that weight by 56 to calculate the market bushels of grain they will purchase from the grower.

The two sources of weight loss due to mechanical drying are 1) the weight of the moisture (water) removed by the drying process and 2) the anticipated weight loss resulting from the loss of dry matter that occurs during the grain drying and handling processes (e.g., broken kernels, fines, foreign materials). An exact value for the handling loss, sometimes called “invisible shrink”, is difficult to predict and can vary significantly from one grain buyer to another. For a lengthier discussion on grain weight shrinkage due to mechanical drying, see Hicks & Cloud, 1991.

The simple weight loss due to the removal of grain moisture represents the greatest percentage of the total grain weight shrinkage due to drying and is easily calculated using a handheld calculator or a smartphone calculator app. In general terms, you first convert the “wet” weight (greater than 15% moisture) to absolute dry weight (0% moisture). Then you convert the absolute dry weight back to a market-standard “dry” weight at 15% grain moisture.

Concept:

  1. The initial percent dry matter content depends on the initial grain moisture content. For example, if the initial grain moisture content is 20%, then the initial percent dry matter content is 80% (e.g., 100% – 20%).
  2. If the desired ending grain moisture content is 15% (the typical market standard), then the desired ending percent dry matter content is 85% (100% – 15%).
  3. Multiply the weight of the “wet” grain by the initial percent dry matter content, then divide the result by the desired ending percent dry matter content.

Example:

  1. 100,000 lbs of grain at 20% moisture = 80,000 lbs of absolute dry matter (i.e., 100,000 x 0.80).
  2. 80,000 lbs of absolute dry matter = 94,118 lbs of grain at 15% moisture (i.e., 80,000 / 0.85).
  3. 94,118 lbs of grain at 15% moisture = 1681 bu of grain at 15% moisture (i.e., 94,118 / 56).

One take-home reminder from this little exercise is the fact that the grain trade allows you to sell water in the form of grain moisture… up to a maximum market-standard 15% grain moisture content (or 14% for long term storage). Take advantage of this fact and maximize your “sellable” grain weight by delivering corn grain to the elevator at moisture levels no lower than 15% moisture content. In other words, if you deliver corn to the elevator at grain moisture contents lower than 15%, you will be paid for fewer bushels than you otherwise could be paid for.

Related reading

Hicks, D.R. and H.A. Cloud. 1991. Calculating Grain Weight Shrinkage in Corn Due to Mechanical Drying. National Corn Handbook Publication NCH-61. https://www.extension.purdue.edu/extmedia/nch/nch-61.html [URL accessed Sep 2019]

Nielsen, RL (Bob). 2018. Corn Grain Test Weight. Corny News Network, Purdue Extension. http://www.kingcorn.org/news/timeless/TestWeight.html [URL accessed Sep 2018]

Pryor, Randy, Paul Jasa, & Jenny Rees. 2017. Plan Harvest to Deliver Soybeans at the Optimum Moisture. Cropwatch, Univ Nebraska Extension. http://cropwatch.unl.edu/2017/plan-harvest-deliver-soybean-optimum-moisture [URL accessed Sep 2019]

Considerations for 2019 Wheat Planting

By:  Andy Michel, Laura Lindsey, and Pierce Paul, Ohio State University

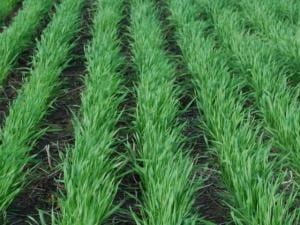
growing wheatWith the autumn rapidly approaching, wheat planting is likely to begin soon. Planting after the Hessian fly free date remains the best chance to avoid issues with insects and diseases, as well as helping ensure good agronomic quality.  Some benefits of the fly free date:

Hessian Fly: Adults of the Hessian fly lay eggs in emerging wheat. These eggs then hatch into small larvae that feed before spending the winter as a flaxseed. The early autumn feeding will stress the young wheat plant right before the winter, resulting in stunted and wilted plants.  Very little egg laying occurs after the fly free date, which helps to limit infestation. Wheat varieties with resistance against the Hessian are available, in addition to seed treatments, which can help limit damage.

Aphids: Two main aphids infest wheat in Ohio: the English grain aphid and the bird cherry-oat aphid.  These aphids rarely cause economic injury on wheat from feeding. However, they can transmit several viruses that can severely impact wheat including Barley Yellow Dwarf virus.  These aphids do not only feed on wheat, but several other grasses that serve as natural sources of viruses.  If wheat is planted too early, and emerges before the aphids overwinter or stop feeding, they can be early transmitters of viruses.  Although seed treatments could help kill the aphids, they may survive long enough to transmit the virus to the plant.  Any transmission in the autumn would likely serve as a local source in the following spring.

Other foliar diseases: Although not directly related to the Hessian Fly, planting after the fly free date also helps to reduce the early establishment of leaf diseases like Stagonospora leaf blotch and powdery mildew. Planting date is indirectly linked to spore production by fungi that cause these diseases and infection of young plants. The earlier you plant, the more spores are available, and the more suitable (warmer) conditions are for infection. Fall infections often leads to more damage and greater yield loss in the spring, especially of susceptible varieties are planted and not protected with a fungicide at Feeks 8 (flag leaf emergence). As conditions become cooler after the fly free date, pathogens that cause leaf diseases become last active, and as such, are less likely to infect plants.

Grain Drying Considerations this Fall

By: Kristina TeBockhorst and Shawn Shouse, Iowa State University Extension and Outreach

With delayed planting across the state in 2019, it is important to monitor crop development to determine unique grain drying needs this fall.

Potential challenges:

Corn damaged by a freeze before it has reached physiological maturity will create issues of low test-weight, low quality, and high moisture. Even without frost damage, corn that reaches maturity later in the year can still have issues of high moisture with less in-field drying between maturity and harvest. Corn infield drying rate decreases with air temperatures: in September, weekly drying is estimated at 4.5 moisture points per week, and in October, November, and December, this is reduced to 2.5, 1, and 0.5, respectively.

Sell wet corn “as is” or dry it?

Harvesting wet grain leaves you with a decision about drying grain yourself or paying others for drying. Consider your buyer’s moisture discount factor or drying charge and shrink factor, as well as your drying system cost and shrinkage loss when deciding whether to sell wet grain or dry it before selling. Consider an example where a seller has 56,000 pounds (1,000 wet bushels) of 20.5% moisture corn and current corn price is at $3.50 per bushel.

Selling wet grain “as is” with a moisture discount:

If the buyer is assessing a moisture price discount of 2.0% for each moisture point above 15%, the discount would be 5.5 moisture points times 2.0% for a total discount of 11%, making the discount $3.50 times 11%, or $0.39 per bushel. In this case, the seller would see a net revenue of $3,110, or $3.11 times 1,000 wet bushels.

Selling wet grain “as is” with a drying charge and shrink factor:

The buyer may instead use a combination of drying charge and shrink factor. If the buyer is charging a drying fee of $0.048 per wet bushel per point of moisture removed, the drying charge would be $0.048 times 5.5 moisture points times 1,000 wet bushels, or $264. If the buyer uses a shrinkage factor of 1.4% per point above 15%, this would reduce the seller’s bushels by 77 bushels, or 1.4% times 5.5 moisture points times 1,000 wet bushels, leaving 923 bushels of dry grain. The net revenue would be $2,967, or 923 bushels times $3.50 minus $264.

Drying on-farm before selling:

Consider the drying cost per bushel of your system as well as the shrinkage loss from the drying process.  Using the Ag Decision Maker spreadsheet Corn Drying and Shrink Comparison (A2-32) and a propane cost of $1.00 per gallon and electricity cost of $0.14 per kilowatt-hour, we can estimate a high temperature drying system cost of $0.030 per bushel per point of moisture removed. The drying cost would be equal to $165 ($0.030 times 5.5 moisture points times 1,000 bushels).

Drying shrinkage loss is mostly due to water loss, but also includes handling (dry matter) weight loss. A 56,000-pound load of 20.5% moisture corn consists of 11,480 pounds of water and 44,520 pounds of dry matter. After drying 5.5 moisture points there will be 52,376 pounds (44,520 pounds divided by 0.85). Handling loss from on-farm drying has been measured between 0.22% to 1.71% of wet bushel weight. Assuming a common handling loss of 1%, handling shrink is 560 pounds. Dry weight to sell is 51,820 pounds, or 925 bushels (52,376 minus 560). Also assume additional transportation costs of $0.01 per bushel per mile, which would be $40 to haul four miles to the on-farm drying system. The net revenue then becomes $3,033 (925 times $3.50 minus $165 minus $40). Also consider additional drying costs if planning to store more than 6 months at a lower moisture content.

This example is for illustration only. Ask your buyer for moisture discounts or drying charges and shrink factors. Use your actual costs for propane and electricity.

Estimate propane needs for a high temperature dryer by using the following equation: 0.018 gallons times bushels dried times moisture points dried. While 0.018 gallons is an average propane usage estimate, this value may range from 0.010 to 0.025 gallons per bushel per moisture point, depending on the drying system and outdoor temperature.

If harvest is delayed later into the fall, consider that the drying cost of a high temperature dryer increases by around 14% with every 20 degree decrease in average outdoor temperature.

Resources:

Frost Damage to Corn and Soybeans, PM 1635, Charles R. Hurburgh and Garren O. Benson, 2012.

High Moisture Corn Drying and Storage presentation, Kenneth Hellevang, 2014.

Soybean Drying and Storage, PM 1636, Charles R. Hurburgh, 2008.

Estimating the Cost for Drying Corn, A2-31, William Edwards, 2014.

Corn Drying and Shrink Comparison, A2-32, William Edwards, 2014.

Corn drydown: What to expect?

By: Peter Thomison OSU Extension

Corn growers may encounter slower than normal dry down this fall due to relatively cool weather conditions and late crop development. Corn will normally dry approximately 3/4 to 1% per day during favorable drying weather (sunny and breezy) during the early warmer part of the harvest season from mid‑September through late September. By early to mid‑October, dry-down rates will usually drop to ½ to 3/4% per day. By late October to early November, field dry‑down rates will usually drop to 1/4 to 1/2% per day and by mid November, probably 0 to 1/4% per day. By late November, drying rates will be negligible.

Estimating dry‑down rates can also be considered in terms of Growing Degree Days (GDDs). Generally, it takes about 30 GDDs to lower grain moisture each point from 30% down to 25%. Drying from 25 to 20 percent requires about 45 GDDs per point of moisture. In October, we accumulate about 5 to 10 GDDs per day. However, note that the above estimates are based on generalizations, and it is likely that some hybrids may vary from this pattern of drydown. Some seed companies indicate considerably lower GDDs for grain moisture loss, i.e. 15 to 20 GDDs to lower grain moisture each point from 30% down to 25% and 20 to 30 GDDs per point from 25% to 20%.

Past Ohio research evaluating corn drydown provides insight on effects of weather conditions on grain drying. During a warm, dry fall, grain moisture loss per day ranged from 0.76 to 0.92%. During a cool, wet fall, grain moisture loss per day ranged from 0.32 to 0.35%. Grain moisture losses based on GDDs ranged from 24 to 29 GDDs per percentage point of moisture (i.e., a loss of one percentage point of grain moisture per 24 to 29 GDDs) under warm dry fall conditions, whereas under cool wet fall conditions, moisture loss ranged from 20 to 22 GDDs. The number of GDDs associated with grain moisture loss was lower under cool, wet conditions than under warm, dry conditions.

Agronomists generally recommend that harvesting corn for dry grain storage should begin at about 24 to 25% grain moisture. Allowing corn to field dry below 20% risks yield losses from stalk lodging, ear drop, ear rots, insect feeding damage and wildlife damage.

“Ask the Expert” Area Seeks to Help Farmers Mitigate the Challenges of 2019 at this year’s Farm Science Review

By:  David Marrison, OSU Extension

Each year, faculty and staff of The Ohio State University address some of the top farm management challenges which Ohio farmers are facing during the “Ask the Expert” sessions held each day at the Farm Science Review at the Molly Caren Agricultural Center near London, Ohio.  The 20 minute “Ask the Expert” presentations at Farm Science Review are one segment of the College of Food, Agricultural, and Environmental Sciences (CFAES) comprehensive extension education efforts during the three days of the Farm Science Review which will be held September 17-19 in London, Ohio.

The 2019 growing season has particularly challenging for Ohio growers and producers due to the historic rainfall in Ohio. Twenty-seven of this year’s “Ask the Expert” sessions will feature discussions aimed at helping farmers mitigate the challenges faced by agricultural producers in 2019 and beyond.   Our experts will share science-based recommendations and solutions to the issues growers are facing regarding weather impacts, tariffs, and low commodity prices.   Producers are encouraged to attend one or more of the sessions throughout the day.

The sessions will take place in the Ohio State Area in the center of the main Farm Science Review exhibit area located at 426 Friday Avenue. The farm management sessions will be featured include:

Tuesday, September 17, 2019

“Tax Strategies Under the New Tax Law” presented by Barry Ward 10:00 – 10:20 a.m.

“Climate Smart- Weather, Climate & Extremes-Oh My!” presented by Aaron Wilson 10:20 – 10:40 a.m.

 “Before the Pearly Gates- Getting Your Farm Affairs in Order” presented by David Marrison 10:40 – 11:00 a.m.

“Crop Inputs & Cash Rent Outlook for 2020” presented by Barry Ward 11:00 – 11:20 a.m.

“Farm Stress-We Got Your Back” presented by Dee Jepsen 11:20 – 11:40 a.m.

“Farm Income Forecasts: Are Farmers Experiencing Financial Stress?”presented by Ani Katchova  12:20 – 12:40 p.m.

“How Much Money Stayed on the Farm? 2018 Ohio Corn & Soybean Production Costs” presented by Dianne Shoemaker  12:40 – 1:00 p.m.

“Where Are We on U.S. Trade Policy” presented by Ian Sheldon 1:00 – 1:20 p.m.

“Farm Accounting: Quicken or Quickbooks” presented by Wm. Bruce Clevenger  1:20 – 1:40 p.m.

“Commodity Markets – Finding Silence in the Noise” by Ben Brown 1:40 – 2:00 p.m.

Wednesday, September 18, 2019

“Climate Smart- Weather, Climate & Extremes-Oh My!” presented by Aaron Wilson 10:00 – 10:20 a.m.

“Solar Leasing Options” presented by Peggy Hall & Eric Romich 11:00 – 11:20 a.m.

 “Where Are We on U.S. Trade Policy” presented by Ben Brown 11:20 – 11:40 a.m.

“Crop Inputs & Cash Rent Outlook for 2020” presented by Barry Ward 12:00 – 12:20 p.m.

“Commodity Markets – Finding Silence in the Noise” by Ben Brown 12:20 – 12:40 p.m.

 Public Perception Risk: Building Trust in Modern Agriculture by Eric Richer 12:40 – 1:00 p.m.

“Farm Stress-We Got Your Back” presented by Dee Jepsen 1:00 – 1:20 p.m.

“How Much Money Stayed on the Farm? 2018 Ohio Corn & Soybean Production Costs” presented by Dianne Shoemaker 1:20 – 1:40 p.m.

 “Tax Strategies Under the New Tax Law” presented by Barry Ward 2:00 – 2:20 p.m.

 “Using On-Farm Research to Make Agronomic and Return on Investment Decisions” presented by Sam Custer 2:40 – 3:00 p.m.

Thursday, September 19, 2019

“Farm Stress-We Got Your Back” presented by Dee Jepsen 10:20 – 10:40 a.m.

“Tax Strategies Under the New Tax Law” presented by Barry Ward 10:40 – 11:00 a.m.

 “Solar Leasing Options” presented by Peggy Hall & Eric Romich   11:20 – 11:40 a.m.

 “Commodity Markets – Finding Silence in the Noise” by Ben Brown 11:40 – Noon

 “Crop Inputs & Cash Rent Outlook for 2020” presented by Barry Ward 12:00 – 12:20 p.m.

 “Where Are We on U.S. Trade Policy” presented by Ben Brown 12:40 – 1:00 p.m.

 “How Much Money Stayed on the Farm? 2018 Ohio Corn & Soybean Production Costs” presented by Dianne Shoemaker 1:40 – 2:00 p.m.

The complete schedule for the Ask the Expert sessions and other events at the 2019 Farm Science Review can be found at: https://fsr.osu.edu/

Additional farm management information from OSU Extension can be found at ohioagmanager.osu.edu or farmoffice.osu.edu

Unusual Ears Appearing in Corn Fields

By: Peter Thomison OSU Extension

Last week, I received reports of several ear oddities showing up in corn fields including the following:

Shortened husk leaves with normal ears protruding beyond the husks

Most corn fields have a few ears with exposed tips. In extreme situations, a high proportion of ears outgrow husks by 1/3 to 1/2. According to Aldrich et al., 1986, Modern Corn Production, observed this where “… extreme [drought] prevailed during the time of ear set with abundant rainfall and good growing conditions thereafter.”

With corn at so many different stages of growth in Ohio this year, it is likely that some corn was subject to heat and drought earlier in the season during husk formation followed by cooler and wetter conditions. Ears protruding beyond the husks are likely to be more susceptible to bird and insect damage followed by molds that may produce mycotoxins. It is advisable to harvest earlier and dry corn down to minimize these potential problems. Avoid hybrids prone to ear tip exposure. However, ear tip exposure problems may be more the result of environmental conditions or an interaction of a particular hybrid with environment than genetics per se.

https://u.osu.edu/mastercorn/files/2015/02/Exposed-Ear-Tip-2-1wdv47i-225x300.jpg

Fig. 1. Ears with exposed ear tips at maturity.


“Barbell” or “Dumbbell” Ears

Barbell ears (Fig. 2) are characterized by kernel formation at the base and tip of the ear but absent from the middle of the ear.

The barbell ears I have heard about this year were observed in sweet corn fields. Barbell ears have been associated with chilling injury during ear formation and seem to be more common in certain sweet corn genetic backgrounds. Some agronomists have suggested that low temperatures disrupt normal kernel development resulting in anomalous ear growth.

Barbell ears also appear to be a glyphosate injury symptom in non-GMO corn. It has been observed when non-GMO corn hybrids are sprayed with a low level of glyphosate in spray tank contamination.

Fig. 2.  Sweet corn ears exhibiting barbell deformity. Source: Kevin Black, 2019.

In 2016, agronomists at the University of Nebraska reported the widespread occurrence of dumbbell shaped ears and short husks in certain dent corn hybrids (https://cropwatch.unl.edu/2019/corn-ear-formation-issues). They concluded that the widespread nature of the symptoms suggests a weather-related stress event interacting with genetics and management practices. They also attributed the problem to loss of the primary ear node followed by development of a secondary malformed ear.

For more on ear development problems and others ear abnormalities, check the following: “Troubleshooting Abnormal Corn Ears” available online at http://u.osu.edu/mastercorn/

Changes on the Horizon for H-2A Temporary Agricultural Labor Rules

By: Evin Bachelor, Law Fellow, Agricultural and Resource Law Program

The U.S. Department of Labor (DOL) says that it has found a number of inefficiencies in the H-2A temporary agricultural labor visa program, and the department has a solution: change the program’s rules.  The DOL has proposed a number of administrative rule changes that it believes will make the approval process move along quicker, relieve burdens on U.S. farms, and create a more level playing field with regards to pay.  Before we talk about the rule changes, let’s recap what the H-2A program is.

H-2A is a visa program for seasonal agricultural laborers from other countries.

Labor shortages have plagued farms across the United States for decades.  Congress first created a visa program for non-immigrant labor in the early 1950s, but it wasn’t until 1986 that Congress established the H-2A visa program for temporary agricultural workers.  Under this program, farmers may apply to employ H-2A workers on their farm on a temporary or seasonal basis for up to a year, but may apply to renew the worker’s visa for up to three total years.

In order to hire H-2A workers, an employer must certify in an application to the DOL that there are not enough qualified domestic workers willing and able to perform temporary and seasonal agricultural labor.  In order to prove that there is not enough domestic labor, the farmer must demonstrate an effort to advertise the available work in the local area.

Further, the farmer must demonstrate to the DOL that employing foreign workers will not negatively affect the wages and working conditions of similarly employed U.S. workers.  In other words, a farmer can’t hire foreign labor because it’s cheaper.  A farmer is expected to pay the foreign workers the same as the farmer would pay domestic workers, based upon the higher of the DOL’s Adverse Effect Wage Rate, minimum wage, or prevailing wage.

What does the Department of Labor seek to change?

The DOL proposes to make several changes to the H-2A program’s administrative rules.  Some of these changes update the rules to reflect what is already happening, while some make slight changes to the program’s overall scope.

  • Mandate e-filing.  The DOL currently allows farmers to submit their applications online or in hard copy, but reports that 4/5 of applications are completed online.  A review by the DOL has found that online applications get completed more quickly, have fewer errors, and reduce costs relative to hard copy submissions.  Under the new rule, the DOL would require all applications to be completed online, unless the farmer has a disability or does not have internet access.
  • Allow e-signatures.  The DOL currently requires farmers to sign a hard copy of their applications and either scan the document into the application or mail it.  Under the new rule, the DOL would accept e-signatures as equal to handwritten signatures.
  • Subdivide the adverse effect wage rate based upon specific agricultural occupations.  In the previous section, we noted that the farmer must pay the foreign workers the same as he or she would pay domestic workers.  One way to determine that wage is to use the DOL’s Adverse Effect Wage Rate.  Currently, the DOL has one rate for a state or region based upon the combined numbers for field and livestock workers.  Under the new rule, the DOL would use Farm Labor Survey data to subdivide agricultural occupations in order to ensure that higher paying occupations, such as supervisors of farmworkers and construction laborers on farms, use an Adverse Effect Wage Rate that properly reflects the wages of those higher paying occupations, rather than one general rate for all agricultural workers.
  • Update the methodology for calculating prevailing wage standards.  Another way to calculate the minimum wages of H-2A laborers is to base their pay off of the prevailing wage.  The current method of calculating the prevailing wage, which has not been updated since 1981, requires in-person interviews of employers.  Under the new rule, the DOL would eliminate the in-person requirement and allow states to collect data using more modern methods.
  • Incorporate guidance letters regarding animal shearing, commercial beekeeping, custom combining, and reforestation occupations into formal rules.  When asked for an interpretation of its rules and policies, a federal agency may issue a guidance letter to the person seeking an interpretation.  These guidance letters are not necessarily binding, and have no general application beyond the person seeking the interpretation.  By incorporating the guidance into a formal rule, the interpretation holds the force of law.  The DOL identified these occupations as unique relative to other agricultural occupations, and created a special set of procedures to obtain H-2A laborers to work these types of jobs.
  • Expand the definition of “agriculture” to include reforestation and pine straw activities.  Currently, reforestation and pine straw occupations are only available for H-2B applications, which are for non-agricultural occupations.  Under the new rule, these activities would be eligible for the agricultural based visa.
  • Reduce the time an employer must allow a domestic worker to apply for a job to 30 days.  Currently, the DOL requires a farmer to hire all eligible, willing, and qualified U.S. workers who make themselves available to work until the half way point in the H2-A contract period.  This means that if a farmer has H-2A laborers working under a six-month contract, then the farmer must hire any eligible, willing, and qualified domestic worker during the first three months of the contract.  Under the new rule, the farmer would only have to leave such opportunity open to domestic workers for 30 days.
  • Allow an employer to stagger the entry of H-2A labor.  Sometimes a farmer does not need all of the H-2A labor to arrive at once, but rather needs some to start on one date and then others to start on a different date.  Currently, this would require the farmer to submit an application for each date on which the farmer needs H-2A labor.  Under the new rule, the farmer would be able to submit one application but stagger the start dates of his or her workers over the course of 120 days.  This 120-day clock begins on the day the first H-2A workers enter the U.S.

For more information about the proposed changes, visit the proposed rule’s entry on the Federal Register HERE.

The public may submit comments until September 24, 2019.

As part of the public rulemaking process, the DOL is seeking public input on the proposed rule changes.  Members of the public may submit written comments to the DOL until Tuesday, September 24, 2019.

You may submit a comment online (visit https://www.regulations.gov/) or by mail (send to Adele Gagliardi, Administrator, Office of Policy Development and Research, Employment and Training Administration, U.S. Department of Labor, 200 Constitution Avenue NW, Room N-5641, Washington, DC 20210).  When mailing comments, be sure to include the rule’s Regulatory Information Number (RIN): 1205-AB89

Corn Earworm in Field Corn; Watch for Molds

By: Kelley Tilmon, Pierce Paul, Andy Michel, OSU Extension

There have been recent reports of high corn earworm populations in certain grain corn fields. Corn earworm is a pest with many hosts including corn, tomatoes and certain legumes. In Ohio it is typically considered a pest of sweet corn rather than field corn, but this past week substantial populations have been found in certain field corn sites. Corn earworm moths are most attracted to fields in the early green silk stage as a place to lay their eggs. These eggs hatch into the caterpillars that cause ear-feeding damage, open the ear to molds, and attract birds. With a wide range of planting dates this year, different fields may be at greater risk at different times.

It is open to debate how well corn earworm can overwinter in most parts of Ohio, and the majority of our population probably immigrates each summer from more southern states. Weather fronts from the south can help carry influxes of moths our way. Compounding the problem, many of these southern moths are resistant to some of the Bt hybrids used against them in the past. Dr. Celeste Welty, OSU vegetable entomologist, maintains a trapping network for corn earworm in sweet corn which can be found here:

https://docs.google.com/spreadsheets/d/10gh3rHahdxLKkXQapGyEPxWsjHYRmgsezOoFHnwtyEo/edit#gid=0

Corn earworms are damaging as caterpillars laid by moths in the silks near the developing ear tip, and are all but impossible to find by scouting. They vary quite a bit in color – with individuals that are dark brown, brown, tan, green, or even pinkish. Typically only one caterpillar is found per ear but in heavy infestations more may be found. They enter corn ears at the tips where the majority of feeding occurs. This also opens the corn ear up to the potential development of ear rots. Unlike western bean cutworm caterpillars, corn earworm caterpillars do not spend any time out on the plant surface before migrating to the ears – they are protected in the ear structure from the beginning and so insecticide application does little good against the caterpillars. When corn earworm moths are immigrating, sweet corn growers rely on frequent sprays to kill adult moths, which is not economical in field corn.

The Bt protein Vip3A (in Viptera) is still deemed effective against corn earworm. For a current infestation in field corn, because chemical control is ineffective, the scouting emphasis should be on assessing mold and disease levels in infested corn.

Feeding sites or exit holes when the caterpillar matures and leaves the ear leave holes in the corn husk, which provide a potential entry wound for pathogens like Fusarium and Gibberella. Some of these organisms can then be a further source for mycotoxins, including Fumonisins and deoxynivalenol, also known as vomitoxin. In some cases, damaged kernels will likely be colonized by opportunistic molds, meaning that the mold-causing fungi are just there because they gain easy access to the grain. However, in other cases, damaged ears may be colonized by fungi such as Fusarium, Gibberella and Aspergillus that produce harmful mycotoxins. Some molds that are associated with mycotoxins are easy to detect based on the color of the damaged areas. For instance reddish or pinkish molds are often cause by Gibberella zeae, a fungus know to be associated with several toxins, including vomitoxin. On the other hand, greenish molds may be caused by Aspergillus, which is known to be associated with aflatoxins, but not all green molds are caused by Aspergillus. The same can be said for whitish mold growth, some, but not all are caused by mycotoxin-producing fungi.

So, since it is not always easy to tell which mold is associated with which fungus or which fungus produces mycotoxins, the safe thing to do is to avoid feeding moldy grain to livestock. Mycotoxins are harmful to animals – some animals are more sensitive to vomitoxin while others are more sensitive to Fumonisins, but it is quite possible for multiple toxins to be present in those damaged ears. If you have damaged ears and moldy grain, get it tested for mycotoxins before feeding to livestock, and if you absolutely have to use moldy grain, make sure it does not make up more than the recommended limit for the toxin detected and the animal being fed. These links provides more information on ear molds and mycotoxin contamination and identification:

https://agcrops.osu.edu/newsletter/corn-newsletter/2018-28/ear-rots-corn-telling-them-apart

https://ohioline.osu.edu/factsheet/plpath-cer-04