Late Summer Establishment of Perennial Forages

By Rory Lewandowski, Mark Sulc, OSU Extension

We are quickly approaching the second good opportunity of the year for establishing perennial forage stands, which is in the month of August. Most of us were not able to establish forages this spring, and many existing stands were damaged by the winter followed by the heavy rainfall this year. It is time to make preparations and be ready to plant perennial forage stands in the next few weeks.

Typically, the main risk with late summer forage seedings is sufficient moisture for seed germination and plant establishment. However, many parts of Ohio have adequate soil moisture from recent rains, and the outlook for the first half of August is for normal precipitation levels. Prepare now and be ready to take advantage of planting ahead of storm fronts as they occur in late July and early August.

Advantages to late summer forage establishment include the following: forage seedlings are not competing with the flush of annual spring and summer weed emergence/growth, soil borne root rot and damping off disease organisms that thrive in cool, wet soils are usually not an issue, and there may be fewer competing farm tasks than in the spring.

A very important consideration for seeding forages that is especially relevant this year is herbicide carryover restrictions. This will certainly be an issue to check on acres where corn and soybean herbicides were applied earlier this year in anticipation of planting, but rains prevented those crops from being planted. Before you consider establishing perennial forages on those prevented plant acres, please be aware that many grain crop herbicides have long rotation interval restrictions that will not allow safe planting of forages this year. The 2019 Ohio. Indiana, Illinois Weed Control Guide provides a summary table of herbicide rotation intervals for alfalfa and clovers (see http://go.osu.edu/herbrotationintervals).  Forage grasses are not included in that table, but any restrictions will be stated on the herbicide labels. So, be sure to double-check your herbicide application history against the rotation restrictions stated on the labels for the forages you want to establish.

No-till seeding in August is an excellent choice to conserve soil moisture for good germination. Make sure that the field surface is relatively level and smooth if you plan to no-till seed because you will have to live with any field roughness for several years of harvesting operations. Sclerotinia crown and stem rot is a concern with no-till seedings of alfalfa in late summer and especially where clover has been present in the past. This pathogen causes white mold on alfalfa seedlings. They become infected during cooler rainy spells in late October and November, the disease develops during the winter, and seedlings literally “melt away” in winter and early spring. It can be devastating where the pathogen is present. No-till is especially risky where clover has been present because the sclerotia germinate from a shallow depth. Early August plantings dramatically improve the alfalfa’s ability to resist the infection. Late August seedings are very susceptible, with mid-August plantings being intermediate.

In a no-till situation, minimize competition from existing weeds by applying a burndown application of glyphosate before planting. Using no-till when herbicide-resistant weeds are present, such as marestail in a previous wheat field, creates a very difficult situation with no effective control options, so tillage is probably a better choice in those situations.  

Post-emergence herbicide options exist for alfalfa to control late summer and fall emerging winter annual broadleaf weeds. A mid- to late fall application of Butyrac (2,4-DB), bromoxynil, Pursuit or Raptor are the primary herbicide options for winter annual broadleaf weeds. Fall application is much more effective than a spring application for control of these weeds especially if wild radish/wild turnip are in the weed mix.  Pursuit and Raptor can control winter annual grasses in the fall in pure legume stands but not with a mixed alfalfa/grass planting.  Consult the 2019 Ohio, Indiana, Illinois Weed Control Guide and always read the specific product label for guidelines on timing and rates before applying any product.

For conventional tillage seeding prepare a firm seedbed to ensure good seed-to-soil contact. Be aware that too much tillage depletes soil moisture and increases the risk of soil crusting. Follow the “footprint guide” that soil should be firm enough for a footprint to sink no deeper than one-half inch.  Tilled seedbeds do not need a pre-plant herbicide.

Finally, keep in mind the following factors to increase establishment success.

  • Soil fertility and pH: The recommended soil pH for alfalfa is 6.5 to 6.8. Forage grasses and clovers should have a pH of 6.0 or above. The minimum or critical soil phosphorus level for forage legumes is 25 ppm Bray P1 or 34 ppm Mehlich-3 and for grasses it is 15 ppm Bray P1 and 20 ppm Mehlich-3. The critical soil potassium level is somewhere between 100 and 125 ppm for many of our soils.
  • Seed selection: Be sure to use high quality seed of adapted, tested varieties and use fresh inoculum of the proper Rhizobium bacteria for legume seeds. “Common” seed (variety not stated) is usually lower yielding and not as persistent, and from our trials the savings in seed cost is lost within the first year or two through lower forage yields.
  • Planting date: According to the 15th edition of the Ohio Agronomy guide, planting of alfalfa and other legumes should be completed between late July and mid-August in Northern Ohio and between early and late August in Southern Ohio. Most cool-season perennial grasses can be planted a little later. Check the Ohio Agronomy Guide (see http://go.osu.edu/forage-seeding-dates).
  • Planter calibration: If coated seed is used, be aware that coatings can account for up to one-third of the weight of the seed. This affects the number of seeds planted in planters set to plant seed on a weight basis. Seed coatings can also dramatically alter how the seed flows through the drill, so calibrate the drill or planter with the seed going into the field.
  • Seed placement: The recommended seeding depth for forages is one-quarter to one-half inch deep. It is better to err on the side of planting shallow rather than too deep.

Do not harvest a new perennial forage stand this fall. The ONLY exception to this rule is perennial and Italian ryegrass plantings.  Mow or harvest these grasses to a two and a half to three-inch stubble in late November to improve winter survival.  Do not cut any other species, especially legumes.

Prospects for Soybean Demand

By Todd Hubbs, Department of Agricultural and Consumer Economics, University of Illinois “Prospects for Soybean Demand.” farmdoc daily (9):138

Uncertainty regarding soybean acreage and yield potential will continue to be significant factors in soybean price movements through harvest.  Without a severe crop shortfall, higher soybean prices rely on demand prospects over the next year.

Soybean crush slowed in the final quarter of the current marketing year.  The USDA lowered 2018-19 marketing year crush by 15 million bushels to 2.085 billion bushels in July.  Estimates of monthly soybean crush from the USDA through May totaled 1.58 billion bushels.  The NOPA crush report indicated a June crush of 148.8 million bushels.  For this marketing year, USDA monthly crush numbers have run approximately 6 percent above NOPA crush report estimates.  At this rate, June crush equaled 158 million bushels and brought the total crush for the first ten months of the marketing year to 1.734 billion bushels.  Crush during the last two months of the marketing year needs to total 350 million bushels to reach the USDA projection, on par with totals crushed in the previous year over the same period.

The USDA estimates soybean exports this marketing year at 1.7 billion bushels, down 434 million bushels from the 2017-18 marketing year.  As of July 25, exports totaled approximately 1.54 billion bushels.  Outstanding sales sit at 315 million bushels with 173 million bushels slated for China.  Export inspections need to average 30.2 million bushels per week over the remainder of the marketing year to hit the USDA estimate.  Inspections averaged 29.5 million bushels over the last four weeks.  The current pace of exports appears to be slightly below the pace to meet the USDA estimate.  Based on the latest consumption levels, ending stocks look certain to exceed one billion bushels at the end of August.

Soybean demand over the next year depends on China.  The current state of Chinese tariffs on U.S. soybeans and the continuing spread of African Swine Fever does not bode well for U.S. soybean exports.  Resumption of negotiations with China this week provides some hope for a resolution to the trade impasse.  China’s approval of goodwill purchases totaling approximately 110 million bushels offers some support for exports.  Chinese soybean purchases remain contingent on progress in negotiations.  Based on previous negotiation outcomes, a decent probability exists that tariffs stay in place through the next marketing year.

The outbreak of African Swine Fever in China last year led to the Chinese hog herd dropping nearly 20 percent in 2019.  Prospects of an additional 10 percent reduction in 2020 and a 30 percent drop in the sow herd indicate the current outbreak may take many years to resolve.  Reports from the World Organization of Animal Health (OIE) indicate the disease continues to spread in Asia and parts of Europe.  In Asia, reports of ongoing outbreaks of the disease in Vietnam, Mongolia, Laos, Cambodia and North Korea point toward a long-run continuation of the disease in the region.  Lower pork consumption, substitution from other protein sources, and pork imports look to take up the slack in Chinese pork production.  A rapid escalation of U.S. pork imports to China expected at the start of the year failed to materialize, but expectations of increased pork exports in the latter half of 2019 remain in place.  A larger herd in the U.S. supplying Chinese protein needs supports soybean crush.  However, reduced soybean exports to China due to lower feed demand and tariffs point toward another marketing year of weak exports.  The forecast for Chinese soybean imports during the 2019-20 marketing year come in near 3.2 billion bushels, up slightly from last year and around 260 million bushels less than seen before the disease outbreak.

In conjunction with the prospects of weak demand from the world’s largest soybean importer, soybean production in South America is forecast up 2.3 percent in 2020 at 6.8 billion bushels.  Brazil’s production forecast sits at 4.5 billion bushels, up 220 million bushels over the estimate for the 2018-19 crop.  Another good crop year in South America creates a highly competitive export environment in 2020.

The USDA projects the 2019-20 marketing year consumption levels for crush and exports at 2.115 and 1.875 billion bushels, respectively.  Large livestock herds look to support domestic soybean meal use despite the potential for lower soybean meal exports.  Expansion in biodiesel production supports soybean oil use from crush as well.  Reduced Chinese demand combined with larger South American soybean crops places the current export forecast in question.  Outstanding sales for the 2019-20 marketing year came in at 111 million bushels through July 18 and lagged last year’s total by approximately 250 million bushels.

The potential for a sharply lower soybean crop in 2019 remains a possibility.  Reduced yield potential due to late-planting and lower acreage point to a smaller crop.  A national average yield near 44.7 bushels per acre is necessary to reduce ending stocks to 500 million bushels under current acreage and consumption scenarios put forth by the USDA.  Under a lower demand scenario, the yield must fall further.  Pricing some new crop soybeans on rallies this summer may be prudent.

YouTube Video

Discussion and graphs associated with this article available here: https://youtu.be/meqzOF_OiJQ

A more normal pattern ahead into August

By Jim Noel (National Weather Service)

June and July together for Ohio will go down as 1-2 degrees warmer than normal and rainfall will go down on average as 100-175% of normal. However, details and timing matter. Looking at July only, rainfall will go down as 75-100 percent of normal over the southwest part of the state while the northern and east will down down as 100-150% of normal.

Average Temperature: Departure from Mean June 1, 2019 - July 27, 2019

Average Temperature: Departure from Mean June 1, 2019 – July 27, 2019

Accumulate Precipitation: Percent of Mean June 1, 2019 - July 28, 2019

Accumulate Precipitation: Percent of Mean June 1, 2019 – July 28, 2019

Over the next two weeks rainfall will be at or slightly below normal in the 1-2 inch range. Rainfall is expected into Tuesday July 30. After that rain event, the next will not occur until about August 6 or 7. The good news is temperatures will be close to normal over the next two weeks. There will be a burst of above normal temperatures this coming weekend though.

Accumulated Precipitation: Percent of Mean June 1, 2019 - July 28, 2019

Accumulated Precipitation: Percent of Mean June 1, 2019 – July 28, 2019

NOAA/Climate Prediction Center 6-10 Day Temperature Outlook

https://www.cpc.ncep.noaa.gov/products/predictions/610day/610temp.new.gif

NOAA/Climate Prediction Center 6-10 Day Rainfall Outlook

https://www.cpc.ncep.noaa.gov/products/predictions/610day/610prcp.new.gif

Two week rainfall totals are expected in the 1-2 inch range as attached graphic shows.

Rainfall Expected

Rainfall Expected

The outlook for August is near normal temperatures and precipitation.

USDA Releases Details About 2019 Market Facilitation Programs

 by Ben Brown, Ohio State University

The U.S.D.A. released details about the 2019 Market Facilitation Program (MFP) today. This is a continuation of the 2018 program designed to help offset market affects from retaliatory tariffs on U.S. agricultural products.

Key differences in 2019 compared to 2018

  1. Payments are based on planted acres not per bushel
  2. Each county has a different payment rate See the attached document (The first payment is 50% of this amount)
  3. Payment is split into three parts not two. 50% in the first round, 25% in the second and 25% in the third. Only the first round is guaranteed at this point.
  4. In 2018- adjusted gross income limit was set at $900,000. In 2019- AGI higher than $900,000 is eligible as long as 75% of the income comes from the farming operation. Producer hampered by this restriction in 2018 can retroactively file for 2018 when they sign up in 2019.

Here are the important takeaways so far-

  1. Sign-up will begin Monday July 29th and run through December 6th.  (Producers need to fill out form CCC-913 from the FSA office)
  2. Crops and livestock eligible include:
    1. Non-specialty- alfalfa hay, barley, canola, corn, crambe, dried beans, dry peas, extra-long staple cotton, flaxseed, lentils, long grain and medium grain rice, millet, mustard seed, oats, peanuts, rapeseed, rye, safflower, sesame seed, small and large chickpeas, sorghum, soybeans, sunflower seed, temperate japonica rice, triticale, upland cotton and wheat. (the sum of acres of these crops not exceeding 2018 acreage multiplied by 50% of attached county rates)
    2. Specialty crops- almonds, cranberries, cultivated ginseng, fresh grapes, fresh sweet cherries, hazelnuts, macadamia nuts, pecans, pistachios, and walnuts (multiplied by national or state payment rates per acre)
    3. Livestock- dairy and hogs. (Milk- $0.20/ hundredweight of milk registered through the Dairy Margin Coverage Program x 50%, Hogs- $11 per head of an inventory selected by the producer between April 1 and May 15, 2019 x 50%)
    4. Approved cover crops on prevented planting acres will receive $15 per acre as long as long as they are planted before August 1, 2019 x 50%.

All payments for the first tranche are 50% of the total payment rate and expected to be made in August.

More information is available at https://www.farmers.gov/manage/mfp

Crop Scouting a Delayed Crop

By: Clint Schroeder

The 2019 growing season continues to present new challenges for Ohio farmers. The late planting coupled with localized extreme weather events has changed the way we need to think about scouting for disease and pest issues in our crops.  The good news is that the late planting will delay the corn crop enough that we should not have to worry about Japanese Beetles feeding on corn silks at pollination time. The bad news is that we have had more time for spore counts to build up for foliar diseases like gray leaf spot, northern corn leaf blight, and common southern rust.  In a normal year we would look for disease pressure around tasseling, but this year we could start to see infection at the V8-V12 growth stages. If the hybrid is susceptible and conditions become favorable, high levels of infection at V8-V12 will result in greater and more rapid diseases development, and consequently, greater damage to the upper leaves before grain-fill is complete.  Research by OSU Extension since 2010 has shown that the ideal time to treat with a fungicide is at the VT/R1 even if there is presence of disease prior to that stage. Growers also need to be aware that there is a new foliar disease that showed up in Northwest Ohio in 2018. Tar spot is more likely to show up in no-till fields and can be identified by the raised circular black lesions.

It’s also time to scout for western bean cutworm (WBC) egg masses. I am currently monitoring two traps in Allen County and reporting those numbers to our state office.  Last week there was an average of 7 moths in the traps locally, but the state average was 25.3 moths per trap.  It will be interesting to see if the numbers continue to rise or if we taper off similar to 2018. WBC egg groups are often found on the upper leaf surfaces in clusters. The eggs are round and first appear white, then gradually turn a dark purple. Once eggs turn purple, they will hatch within 24 to 48 hours. If infestations exceed the threshold level, over 8% of plants having eggs or larvae, many insecticides are available to treat with. However, as with any ear-burrowing caterpillar pest, timing is critical. Insecticide applications must occur after egg hatch, or after tassel emergence, but before caterpillars enter the ear. If eggs have hatched, applications should be made after 95% of the field has tassel. If eggs have not hatched, monitor for the color change. To search for larval injury after it has occurred, search the corn for ears having feeding holes on the outside of the husks.

Figure 2. Average western bean cutworm (WBC) per trap in monitoring counties in Ohio for 2016 (blue), 2017 (red), 2018 (green) and 2019 (purple).

Average western bean cutworm (WBC) per trap in monitoring counties in Ohio for 2016 (blue), 2017 (red), 2018 (green) and 2019 (purple).

In soybeans we need to be scouting for insect pressure.  We’ve had a lot of Japanese Beetles present this year and they will do damage by eating the foliage of bean plants.  As a general rule of thumb treatments are warranted when defoliation exceeds: 40% prior to bloom, 15% from bloom to pod-fill, and 25% after pod-fill to plant yellowing. Another pest that we need to be looking for is the brown marmorated stink bug. Adults are speckled brown-gray with a white band on its antennae. There are dark and white bands around the edges of the abdomen, with the whitish markings appearing as triangles. Early nymphs have a dark head with an abdomen that is orange and red with black stripes down the middle. Later nymphs are brown with a white band on its antennae and strong white bands on its legs. The underside of the nymphs is characteristically white.

Adult brown marmorated stink bug. Brown marmorated stink bug nymph.

These bugs will damage soybeans by puncturing tissues with their piercing and sucking mouthparts, and then extracting plant fluids. They prefer to feed on the young pods and developing seed within.  This can cause significant yield loss as the seed will become shriveled and deformed. Scouting for this pest should ramp up as soybeans begin to flower.  Given the late planting we have experienced it might be possible that the insect pressure will require multiple insecticide treatments to protect yield potential.

For more information on these pests or any other things you might be seeing this year please contact us at 419-879-9108. I know in these conditions it is often times frustrating trying to decide on treatments for a crop that doesn’t have great yield potential.  I’d be more than happy to come out and talk about the threshold levels OSU Extension has set for treatments and the economics behind that. It is also important to remember that we need to be using our insecticides and fungicides responsibly to prevent not only resistance, but also negative public sentiment.


Converting between Mehlich-3, Bray P, and Ammonium Acetate Soil Test Values

By: Steve Culman, Meredith Mann, Stuti Sharma, Muhammad Tariq Saeed, Anthony Fulford, Laura Lindsey, Aaron Brooker, Libby Dayton, Branly Eugene, Randall Warden, Kurt Steinke, Jim Camberato, Brad Joern

The purpose of this fact sheet is to report the relationships between Mehlich-3, Bray P, and Ammonium Acetate soil test extractants in the Tri-State Region.

Summary of Findings

  • Soil samples in Ohio and Indiana were collected from a diverse range of fields and analyzed for Mehlich-3, Bray-P, and ammonium acetate extractable nutrients for phosphorus (P), potassium (K), calcium (Ca), and magnesium (Mg).
  • Mehlich-3 P values were highly related to, but 35 percent higher than Bray P values.
  • Mehlich-3 K values were highly related to, but 14 percent higher than AA-K values.
  • Mehlich-3 is a reliable extractant and will be the basis for updated fertilizer recommendations.

How to Convert Soil Test P and K Values

Background

The Tri-State Fertilizer Recommendations (Vitosh et al., 1995) are based on the Bray-P1 extractant for P and the ammonium acetate (AA) extractant for K, Ca, and Mg. This requires two different extractants to be independently analyzed to estimate plant-available P, K, Ca, and Mg. In the 1990s, soil test laboratories started using the Mehlich-3 soil test extractant, a universal extractant that provides multiple extractable nutrients from a single soil sample. Mehlich-3 increased efficiency, and today, nearly all commercial soil testing labs in this region use Mehlich-3 as the primary soil test extractant.

The updated Tri-State Fertilizer Recommendations will use the Mehlich-3 extractant as the new standard for fertilizer recommendations. Because of this, it is imperative that producers are able to convert back and forth from these different extractants.

To determine the relationships between extractants, we collected and analyzed 2,659 soil samples from a wide diversity of fields across Ohio and Indiana. Bray P1 and Mehlich-3 P were run on 2,323 soil samples using three different reputable labs, quantified both colorimetrically and on an ICP. Ammonium acetate and Mehlich-3 K, Ca, and Mg extracts were run on 1,537 soil samples using two different reputable labs. Mehlich-3 P values ranged from 3–1170 ppm, and Mehlich-3 K values ranged from 25–899 ppm. We examined relationships with all soil test values, but since our focus here is conversions for fertilizer recommendations, we focused on soil test values in the agronomic range. We used the upper limit of the drawdown range as our cutoff and analyzed relationships below this limit: less than 50 ppm for Bray P and less than 200 ppm for AA-K.

Phosphorus

Across all soils, Mehlich-3 P was closely related to Bray P, but extracted more P than the Bray extractant (Figure 1, left panel). After 300 ppm, the Mehlich-3 P extractant begins to extract proportionally more P than Bray P, suggesting the conversion reported here should not be used if values are above 300 ppm Bray P. When only soil test values in the agronomic range were considered (less than 50 ppm Bray P), the relationships were largely consistent with the full data set (Figure 1, right panel). However, using the agronomic range represents a more meaningful conversion, as high values have less influence on the blue trend line.

Table with Mehlich-3 P values on the Y axis, and Bray P1 on the X axisTable with Mehlich-3 P on the Y axis and Bray P1 on the X axis

Figure 1. Relationship between Bray and Mehlich-3 phosphorus with all soils (top panel) and with soils less than 50 ppm Bray P. The dashed blue line is the best fit trend line, while the solid black line is a 1:1 line.

To simplify the conversion from Bray P to Mehlich-3 P, the intercept was forced through zero so that users could convert by simply multiplying or dividing by a constant. This yielded very similar results to using the best fit trend line with an intercept. Within the agronomic range of <50 ppm, Mehlich-3 P extracted 35 percent more P than Bray P. To convert from Bray P to Mehlich-3 P, multiply Bray P by 1.35. To convert from Mehlich-3 P to Bray P, divide Mehlich-3 P by 1.35.

Note that this relationship is for Mehlich-3 P that is quantified by an ICP and Bray P that is quantified colorimetrically, by far the most common way these two extractants are quantified in commercial labs. If either extractant is quantified by a different means, these relationships will change (Table 1).

Table 1. Phosphorus extractant conversion factors. To convert from starting value to desired value, multiply starting value by corresponding conversion.
Starting Value Multiply By Desired Value
Bray-P (colorimetric) 1.35 Mehlich-3 P (ICP)
Bray-P (colorimetric) 1.03 Mehlich-3 P (colorimetric)
Bray-P (ICP) 1.20 Mehlich-3 P (ICP)
Bray-P (ICP) 1.05 Mehlich-3 P (colorimetric)

Equations based on soils with <50 ppm Bray P and the intercept forced through zero.

Potassium

Mehlich-3 K was highly related to AA-K (Figure 2, left panel). At levels above 300 ppm, AA extracted more K than Mehlich-3, suggesting the conversion should not be used if values are above 300 ppm. When only soil test values in the agronomic range were considered (less than 200 ppm AA-K), the relationships were largely consistent with the full data set (Figure 2, right panel). Mehlich-3 extracted on average 14 percent more K than AA. This percentage is much smaller than for phosphorus and many in the soil testing world consider these differences negligible. However, to be consistent, we provide conversions here. Within the agronomic range of <200 ppm, Mehlich-3 K extracted 14 percent more K than AA-K. To convert from AA-K to Mehlich-3 K, multiply AA-K by 1.14. To convert from Mehlich-3 K to AA-K, divide Mehlich-3 K by 1.14.

Table with results of soil test valuesResults of soil tests in agronomic range

Figure 2. Relationship between ammonium acetate (AA) and Mehlich-3 potassium with all soils (top panel) and with soils less than 200 ppm AA-K (bottom panel). The dashed blue line is the best-fit trend line, while the solid black line is a 1:1 line.

Calcium and Magnesium

Mehlich-3 Ca and Mg were also closely related to AA-Ca and AA-Mg (data not shown; all R2 over 97 percent). Conversion values are reported in Table 2.

Table 2. Potassium, calcium, and magnesium extractant conversion factors. To convert from starting value to desired value, multiple starting value by corresponding conversion.
Starting Value Multiply By Desired Value
Ammonium Acetate-K 1.14 Mehlich-3 K
Ammonium Acetate-Ca 1.15 Mehlich-3 Ca
Ammonium Acetate-Mg 1.24 Mehlich-3 Mg

Equations based on soils with <200 ppm AA-K and the intercept forced through zero.

Conclusions

Comparisons between these extractants have been reported in the past (Eckert and Watson, 1996) and are generally consistent with our findings. The analysis here included a much greater diversity of soils across two states than previous studies, making the findings overall more robust. Recent efforts in other corn belt states have also aligned with our findings (for example, Mallarino et al., 2013). Mehlich-3 P extracts 35 percent more P than Bray P. Mehlich-3 extracts more base cations than AA for K (14 percent), Ca (15 percent) and Mg (24 percent). Overall, the Mehlich-3 extractant is an appropriate and reliable soil test extractant for non-calcareous soils and will be the basis of updated fertilizer recommendations in the Tri-State Region.

References

Eckert, D.J., and M.E. Watson. (1996). Integrating the Mehlich-3 extractant into existing soil test interpretation schemes. Communications in Soil Science and Plant Analysis 27: 1237–1249.

Mallarino, A.P., J.E. Sawyer, and S.K. Barnhart. (2013). PM 1688 (A General Guide for Crop Nutrient and Limestone Recommendations in Iowa), Iowa State University, Ames.

Vitosh, M.L., J.W. Johnson, and D.B. Mengel. (1995). Tri-State fertilizer recommendations for corn, soybeans, wheat and alfalfa. Ext. Bull. E-2567. Michigan State University, East Lansing.

Watson, M. and Mullen, R. (2007). “Understanding Soil Tests for Plant-Available Phosphorus.” Ext. 3373. Ohio State University, Columbus. agcrops.osu.edu/sites/agcrops/files/imce/fertility/Soil_Tests.pdf

Septic System Care and Maintenance

By: Karen Mancl, Professor, Food, Agricultural and Biological Engineering and Brian Slater, Associate Professor, Environment and Natural Resources

Homes beyond the reach of a city sewer must treat and disperse wastewater on their lots. This household sewage treatment system requires regular care and maintenance just like other components of a home. A neglected system threatens public health and can result in financial losses to the property. In cities, a trained professional operator cares for the wastewater treatment system. For homes with household sewage treatment systems, the property owner is responsible for maintenance.

Household sewage treatment systems usually consist of a septic tank, a treatment system, and a dispersal system. The expected life of a properly maintained wastewater treatment system is around 20 years.

This fact sheet presents basic, regular maintenance required for all types of systems. Detailed information for an advanced treatment system or a complicated dispersal system can be obtained from the system installer or the local health department.

A homeowner can do three things to keep the system trouble-free and operating as designed for its full life span: conserve water, landscape carefully, and maintain the septic tank and its components.

Conserve Water

Using less water is the best thing a homeowner can do to maintain the household sewage treatment system. Systems are designed to handle 50–60 gallons per person per day of household sewage for a residential home. Adding more water than the design load can result in system failure. The following techniques can be used to conserve water:

  • Install water conserving fixtures such as low-flow shower heads and toilets, and front-loading washing machines.
  • Repair water leaks such as dripping faucets and toilet valves that don’t seal.
  • Space out water use. For example, avoid washing multiple loads of laundry on one day, and spread out bathing times throughout the day.

Landscape Carefully

Since the household sewage treatment system is buried in the yard, even seemingly innocent landscape changes can damage the septic system. Mark the system location and be careful when making lot improvements. The following suggestions will help prolong the life of your system:

  • Divert rainwater drainage away from the soil absorption system area. Downspouts, paved areas, and slopes can all deliver extra water to the area where the wastewater is being treated and dispersed. A typical septic system applies about 100 inches of extra water per year to a yard. This is in addition to the 40 inches per year of normal precipitation in Ohio.
  • Keep pavement, decks, vehicles, heavy equipment, and other solid objects off of the soil absorption system area. Heavy objects can compact the soil and close up larger soil pores, which reduces the amount of water that can move through the soil. Access for maintenance and repair is also limited if the system is covered.
  • Do not place additional soil fill over the system. Many of the system components are meant to be shallow to allow for air infiltration. If sewage is surfacing in the yard, covering it with fill does not work to solve the problem, and can actually make the situation worse. Surfacing sewage is a sign that the system is malfunctioning and needs repair or possible replacement.

Pump the Septic Tank and Clean the Filter

Septic tanks (Figure 1) are installed to separate and store solids from the sewage, which protects the soil and other treatment system components from clogging. If not maintained on a regular basis, solids can move out of the tank and cause system damage. Include the following septic tank maintenance:

  • Pump the septic tank on a regular basis. Table 1 shows the estimated time for septic tank pumping for different sized tanks and families.
  • Do not use biological or chemical additives in place of tank pumping. Sewage has adequate bacteria and enzymes, making additives unnecessary and in some cases harmful.
  • Do not use a garbage disposal. The extra solids fill up the tank, increasing the cost and frequency of maintenance.
  • Check the condition of the baffles or tees (Figure 1) when the tank is pumped. Baffles or tees are designed to improve the removal and retention of solids. They can crumble or fall off with time, or be accidentally damaged during pumping.
  • If your tank is equipped with an effluent filter to help capture and retain solids, remove and clean it on a regular basis (6–12 months, depending on use). Use a hose to clean the filter, washing the solids back into the septic tank. If a hose is not available, a spray bottle of water with a drop or two of detergent can be used to clean off the filter (Figure 2). Cleaning a severely clogged filter may require a brush in a bucket of soapy water.
  • Risers from the tank openings to the ground surface make future maintenance easier (Figure 1). Protect the tank lid from mower damage and replace broken lids. Always secure the lids to keep children and pets from accessing the tank.
  • Never enter a septic tank. The septic tank produces toxic gases that can kill a person in a matter of minutes. If someone has accidentally fallen in, call 911 then put a fan on top of the tank to blow in fresh air.
Table 1.  Estimated Septic Tank Pumping Frequency (in Years) for Different Size Tanks (Note: If a garbage disposal is used, more frequent pumping is required.) (Mancl, K. 1984. Estimating Septic Tank Pumping Frequency. J. of the Environmental Engineering Division ASCE. 110(1):283-285.)
Tank Size (gallons) Number of People in Household (Year-Round Residence)
1 2 3 4 5 6 7 8 9
500 5.8 2.6 1.5 1 0.7 0.4 0.3 0.2 0.1
750 9.1 4.2 2.6 1.8 1.3 1 0.7 0.6 0.4
1,000 12.4 5.9 3.7 2.6 2.0 1.5 1.2 1 0.8
1,500 18.9 9.1 5.9 4.2 3.3 2.6 2.1 1.8 1.5
2,000 25.4 12.4 8 5.9 4.5 3.7 3.1 2.6 2.2
2,500 31.9 15.6 10.2 7.5 5.9 4.8 4.4 4 3.0

Diagram of septic tank Cleaning effluent filter with soap and brush
Figure 1. Septic tank cross section. Effluent filters are required on new installations. Older tanks may not have filters. Figure 2. Clean septic tank effluent filters every 6–12 months. Hold the filter over the tank opening and clean with hose or spray bottle. For heavily clogged filters, clean with a brush and soapy water.

Professional Management

Few homeowners are prepared to operate and maintain a wastewater treatment system. In Ohio, professional service providers can perform this service. The providers are registered with the local health department and must participate in annual continuing education. For most household sewage treatment systems, an annual inspection with a small amount of maintenance can avoid a total system failure that would necessitate expensive and inconvenient system replacement.

The Ohio Noxious Weed Law – A Tool in the Prevention of Waterhemp and Palmer Amaranth

By: Mark Loux OSU Horticulture and Crop Science

Waterhemp and Palmer amaranth are both now listed on the Ohio noxious weed law, which means that landowners must take steps to control infestations and prevent further spread.  Since these are annual weeds, preventing spread is achieved by preventing plants from reaching maturity and producing seed.  This is the basis for our “No pigweed left behind” effort, for which the goal is to create an understanding that the only way to beat these weeds is to prevent seed.  Prevention needs to occur in any area that might be subject to infestation, such as roadsides, parks, conservation seedings, parks, etc, in addition to agricultural fields.  The entities managing these areas are responsible for recognizing and controlling infestations of waterhemp and Palmer amaranth, but this does not always occur.  Not everyone involved in crop production or land management is aware of the waterhemp/Palmer problem to begin with, and many managers are busy enough that preventing noxious weed problems has low priority.

Our advice is to pay attention to what’s happening in your area or in the areas that you farm, with the goal of becoming aware of new infestations early enough that plant maturity and seed can still be prevented, regardless of where they may be occurring.  We recommend as a first step contacting the land manager or owner to explain the issue, make them aware that they have an infestation, and request that action be taken.  However, where it’s not possible to have this conversation, or there is a refusal to take action, the Ohio noxious weed law can be used to try to force action.  A two-page summary of the noxious weed law that can be found here on the OSU Ag Law Blog, and also links directly to the law itself.

The basic idea here is that following an unsuccessful attempt to work with a landowner or manager, noxious weed issues should be reported to township trustees, and this must be done in writing.  The trustees then have the responsibility to deal with the issue, and the method for doing so varies depending upon what the land is used for and who is managing it.  If it’s necessary to use the noxious weed law, be sure to start the process early enough in summer, well before potential seed production.  There is a need to allow time for all of the steps in the process to occur, and for notifications to be received and acted on (or not).  Our experience is that not all landowners and managers will take action upon first notification, and in addition to action, their response to notification can include minimal response of protesting their need to act.  Waiting too late to start the process can result in lack of resolution of these issues in time to prevent plant maturity and seed production.  The noxious weed law has been used several times within the last two years to force managers to control Palmer amaranth, and could be used to accomplish the same for waterhemp, which was recently added to the list.  Consider the law a tool to prevent the establishment and spread of these weeds when other methods are ineffective.


Tax Planning in an Unusual Year – Prevented Planting Indemnity Payments, Market Facilitation Payments and Cost-Share Payments

by: Barry Ward, Leader, Production Business Management & Director, OSU Income Tax Schools

Prevented Planting Crop Insurance Indemnity Payments

With unprecedented amounts of prevented planting insurance claims this year in Ohio and other parts of the Midwest, many producers will be considering different tax management strategies in dealing with this unusual income stream. In a normal year, producers have flexibility in how they generate and report income. In a year such as this when they will have a large amount of income from insurance indemnity payments the flexibility is greatly reduced. In a normal year a producer may sell a part of grain produced in the year of production and store the remainder until the following year to potentially take advantage of higher prices and/or stronger basis. For example, a producer harvests 200,000 bushels of corn in 2019, sells 100,000 bushels this year and the remainder in 2020. As most producers use the cash method of accounting and file taxes as a cash based filer, the production sold in the following year is reported as income in that year and not in the year of production. This allows for flexibility when dealing with the ups and downs of farm revenue.

Generally, crop insurance proceeds should be included in gross income in the year the payments are received, however Internal Revenue Code Section (IRC §) 451(f) provides a special provision that allows insurance proceeds to be deferred if they are received as a result of “destruction or damage to crops.”

As prevented planting insurance proceeds qualify under this definition, they can qualify for a 1 year deferral for inclusion in taxable income. These proceeds can qualify if the producer meets the following criteria:

  1. Taxpayer uses the cash method of accounting.
  2. Taxpayer receives the crop insurance proceeds in the same tax year the crops are damaged.
  3. Taxpayer shows that under their normal business practice they would have included income from the damaged crops in any tax year following the year the damage occurred.

The third criteria is the sometimes the problem. Most can meet the criteria, although if producers want reasonable audit protection, they should have records showing the normal practice of deferring sales of grain produced and harvested in year 1 subsequently stored and sold in the following year. To safely “show that under their normal business practice they would have included income from the damaged crops in any tax year following the year the damage occurred” the taxpayer should follow IRS Revenue Ruling 75-145 that requires that he or she would have reported more than 50 percent of the income from the damaged or destroyed crops in the year following the loss. A reasonable interpretation in meeting the 50% test is that a farmer may aggregate the historical sales for crops receiving insurance proceeds but tax practitioners differ on the interpretation of how this test may be met.

One big problem with these crop insurance proceeds is that a producer can’t divide it between years. It is either claimed in the year the damage occurred and the crop insurance proceeds were received or it is all deferred until the following year. The election to defer recognition of crop insurance proceeds that qualify is an all or nothing election for each trade or business IRS Revenue Ruling 74-145, 1971-1.

Tax planning options for producers depend a great deal on past income and future income prospects. Producers that have lower taxable income in the last 3 years (or tax brackets that weren’t completely filled) may want to consider claiming the prevented planting insurance proceeds this year and using Income Averaging to spread some of this year’s income into the prior 3 years. Producers that have had high income in the past 3 years and will experience high net income in 2019 may consider deferring these insurance proceeds to 2020 if they feel that this year may have lower farm net income.

Market Facilitation Payments

When the next round(s) of Market Facilitation Payments (MFPs) are issued, they will be treated the same as the previous rounds for income tax purposes. These payments must be taken as taxable income in the year they are received. As these payments are intended to replace income due to low prices stemming from trade disputes, these payments should be included in gross income in the year received. As these payments constitute earnings from the farmers’ trade or business they are subject to federal income tax and self-employment tax. Producers will almost certainly not have the option to defer these taxes until next year. Some producers waited until early 2019 to report production from 2018 and therefore will report this income from the first round of Market Facilitation Payments as taxable income in 2019.

Producers will likely not have the option of delaying their reporting and subsequent MFP payments due to the fact they are contingent upon planted acreage reporting of eligible crops and not yield reporting as the first round of MFP payments were.

Cost Share Payments

Increased prevented planting acres this year have many producers considering cover crops to better manage weeds and erosion and possibly qualify for a reduced MFP. There is also the possibility that producers will be eligible for cost-share payments via the Natural Resources Conservation Service for planting cover crops. Producers should be aware that these cost-share payments will be included on Form 1099-G that they will receive and the cost-share payments will need to be included as income.

You are advised to consult a tax professional for clarification of these issues as they relate to your circumstances.

Japanese Beetle Treatment Guidelines

BY: John Obermeyer, Purdue Extension

News flash … Japanese beetle have been emerging and can be seen throughout the state on corn and soybean plants. OK, not that news worthy. How about … some areas of state are seeing tremendous numbers of beetles while some areas aren’t that excited. Again, old news, as this happens every year. Here is a headline sure to grab attention … Japanese beetle – their presence and damage is usually perceived worse than it is. Please refer to the following treatment thresholds.

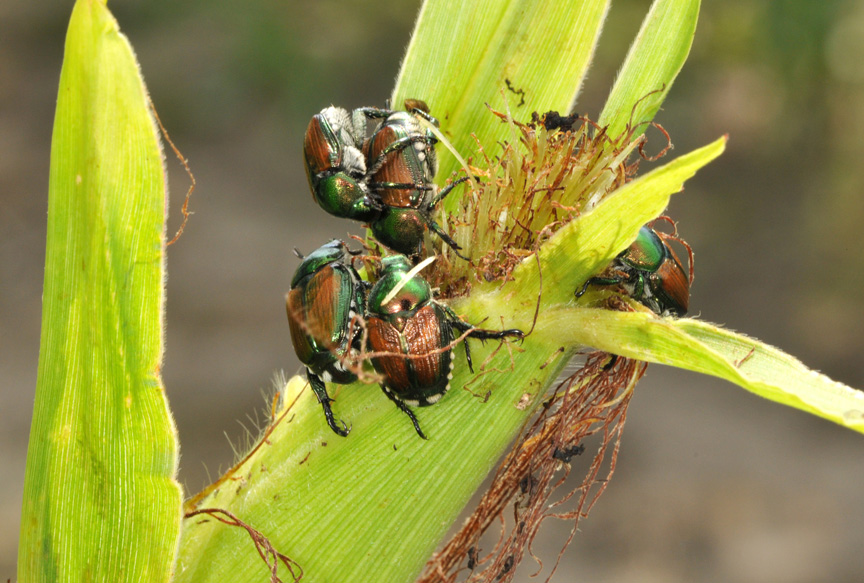
Field Corn: Japanese beetle feed on corn leaves, tassels, and silks. Generally, leaf and tassel feeding can be ignored. If beetles are present and feeding on corn silks, an insecticide should be applied only if on average the silks are being cut off to less than 1/2 inch before 50% pollination has taken place. This rarely happens on a field-wide basis. Don’t be overly excited by this pest’s tendency to clump on a few ears within an area and eat the silks down to the husks. With sufficient soil moisture, silks will grow from 1/2 to 1 inch per day during the one to two weeks of pollen shed. Silks only need to be peeking out of the husk to receive pollen. Besides, beetles are often attracted to silks that have already completed the fertilization process even though they are still somewhat yellow. Check for pollen shed and silk feeding in several areas of the field, Japanese beetles tend to be present only in the outer rows of the field. Don’t be influenced by what you think you may see from windshield surveys! Get out into fields to determine beetle activity. Be sure to walk in beyond the border rows before drawing any conclusions.


Japanese beetle “parties” on selected ears may give false impressions of pollination problems for the whole field

Japanese beetle “parties” on selected ears may give false impressions of pollination problems for the whole field.


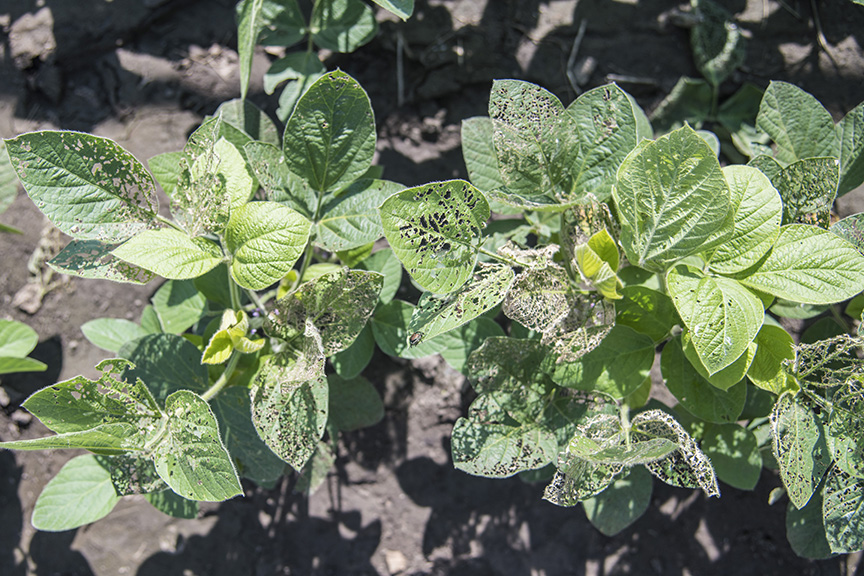
Soybean: Soybean plants have the amazing ability to withstand considerable leaf removal (defoliation) before yield is impacted. The impact of defoliation is greatest during pod fill because of the importance of leaf area to photosynthesis, and ultimately to yield. Therefore, approximately 15-25% defoliation from bloom to pod fill can be tolerated before yields are economically affected This defoliation must occur for the whole plant, not just the upper canopy. The beetles often congregate in areas of a field where they are first attracted to weeds such as smartweed. Typically, if economic damage occurs, it is only in these areas. Therefore, spot treatments should be considered. Don’t be overly alarmed by these bright, iridescent beetles that feed on the top canopy of the soybean plants. Consider that as they feed their defoliation allows for better sunlight penetration into the lower plant canopy!


Japanese beetle will move to new feeding locations, notice how the new growth of these plants have very little damage

Japanese beetle will move to new feeding locations, notice how the new growth of these plants have very little damage.


Kill the beetles to prevent grubs?: Japanese beetle develop from grubs that fed on organic matter and/or the roots of plants last fall and this spring. Therefore, it seems logical that killing adult beetles one year should prevent grub damage the next. At least some farmers have explained this to me to justify sub-economic damage in a field. However, it simply doesn’t work that way. Entomologists for decades have been trying to understand this fickle creature. Basically, the adults feed, mate, and lay eggs when and where they want to. The grubs are just as unpredictable. Research attempts to correlate grub presence to crop damage have been inconclusive. Damage does occur, but we are just not usually able to predict when or assess how much. Consider that each beetle mates and lays eggs several times during its oviposition period. To prevent egg laying in a field, one would need to treat multiple times during July and August, which is not economic or practical. If you are wondering, seed-applied insecticides, i.e., Poncho and Cruiser, provide some suppression of white grubs