Highlights of Highland County Agriculture Virtual Reality Video

For those of you who were unable to attend the Highland County fair, below you will find the virtual reality video that was shown. The video highlights several Highland County farms and a variety of agricultural production practices, as well as a prominent community event.

Special thanks to White Clover Farm, Karnes Orchard and Starlite Dairy for allowing their farms to be recorded for the project.

White Clover Farm near Hillsboro, Ohio.

Dr. James Linnie owns and operates White Clover Farm, a grassfed beef operation located outside of Hillsboro, Ohio. Dr. Linnie started the farm in 2005 while he was working part-time as a gastroenterologist. Today, Dr. Linnie’s business consists of a herd of 100 percent grassfed beef that are rotated every few days to fresh pastures. The scene shown in the VR video is of Dr. Linnie moving his cattle from one section of the pasture to another. If you compare the two pastures in the video, you can clearly see the difference between which pasture the cattle have been grazing and the pasture they are going to be grazing. In fact, the cattle had only been gazing in the previous pasture for 24 hours.

Karnes Orchard

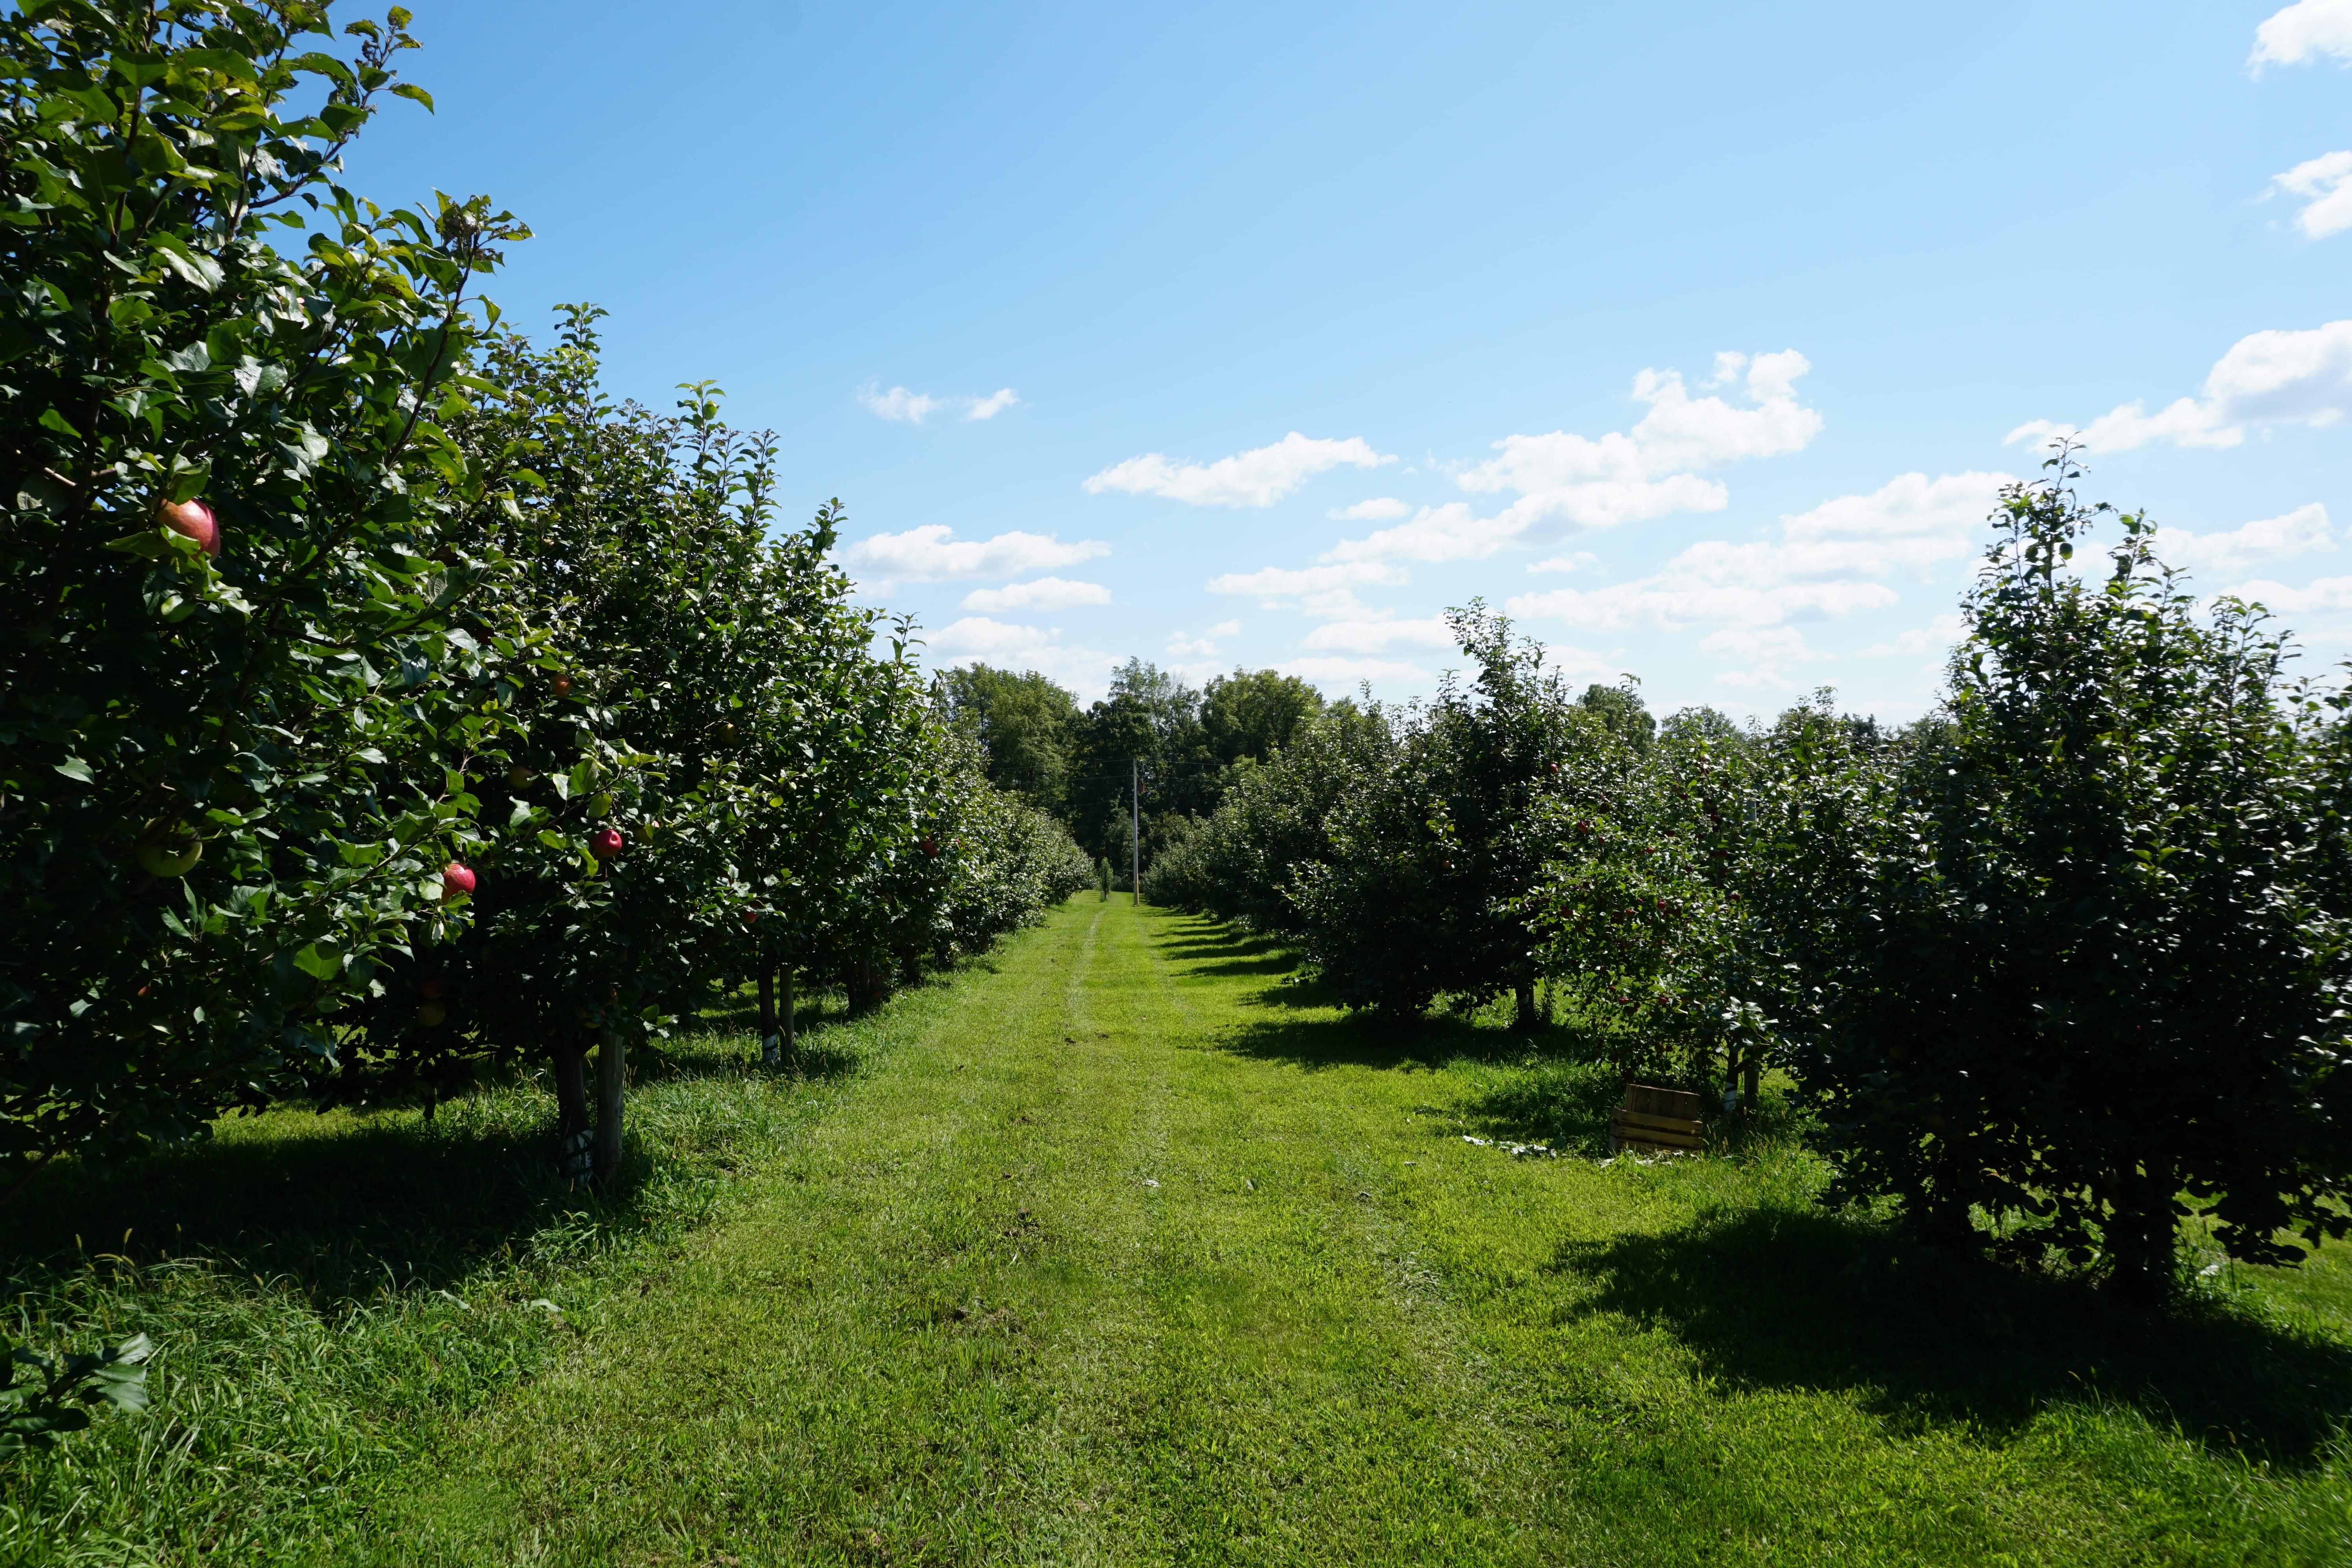
The Karnes family has a history of having an orchard on their family farm since 1876. In March of 2012, the Karnes family replanted 2,200 fruit trees and in 2013 planted an additional 2,000 trees for a wider selection of fruits. Karnes Orchard now raises over 30 varieties of apples, pears, plums, peaches, and cherries. In addition to fresh fruits, fresh apple cider is available in the Karnes Orchard Market seasonally. The scene filmed in the VR video shows picking Honey Crisp apples in the orchard as well as the washing, sizing, and packaging process.

Starlite Dairy

Starlite Dairy is owned and operated by Tom and Janet Shawhan near Marshall, Ohio. At Starlite Dairy, the cows are milked twice a day. During optimal weather conditions, a cow can produce an average of 80 pounds of milk a day. The milking parlor at Starlite Dairy holds 16 cows at a time and it takes between 6 to 8 minutes to complete the milking process.


Highland County Sheep Lead

Back row: Grace Matthews, Brenna Wright, Lana Grover, Emma Yochum, Kallie Posey, and Sara Newsome.
Front row: Emelia Roehm, Evelyn Roehm, Kinlee Case, Eloise Roehm, Ella Brown, and Katie Cook


Brooke Beam, PhD

Ohio State University Extension, Highland County

Agriculture and Natural Resources/Community Development Extension Educator

September 12, 2018


I want to congratulate all of the participants of the Highland County Fair. I had the pleasure of viewing many of the livestock shows and assisting with the junior fair sales. I was impressed with the professionalism and courtesy the participants showed their peers and the judges. In particular, the sheep lead sticks out in my mind because I was a multi-year participant as a youth in this contest. I participated in the sheep lead at the county, state, and national level for over ten years. Without fail, every time I participated the temperature would be the hottest of the fair, which for the sheep lead really means something.

In typical sheep lead fashion, the Highland County Sheep Lead occurred on one of the hottest days of the Fair when the high was 91°F. Why is the heat important to consider when considering the sheep lead, you ask? It is important because all of the participants must wear predominantly wool apparel for the contest.

The sheep lead is unique in the sense that it combines both a livestock and fashion show together to highlight the sheep industry. Each participant must model their outfit and show their sheep while maintaining poise and grace. Lambs must be breeding sheep or market lambs that are trained to be shown by a halter. The combination of livestock and fashion is a treat for many spectators.

The sheep industry in the United States changed after World War II. Synthetic fibers replaced the use of wool in many instances and caused a shift in the market for lambs to be driven by meat production. According to the USDA, there were only 150,000 sheep in Ohio in 2003, which was a decrease of over 50 percent of the sheep population in Ohio from 1975. Although at the Highland County Fair Sheep Lead this year there were several first-year participants in the contest.

While the sheep industry has declined in size, there are opportunities for individuals to become involved in the sheep industry. The Southeast Ohio Sheep and Goat School covers a multitude of topics for beginning and experienced herdsmen, ranging from parasites to reproduction.  For more information about the Southeast Ohio Sheep and Goat School contact Christine Gelley at gelley.2@osu.eduor 740-732-5681. Another opportunity is the Ohio Statewide Sheep Shearing School being held on Friday and Saturday, September 14-15 at the Dave Cable Farm (10491 Canal Road, Hebron, OH 43025). For more information about the Ohio Statewide Sheep Shearing School contact Roger High at 614-246-8299.

If you are interested in participating in next year’s sheep lead, the contest is open to all ages. For more information about the 2019 Highland County Fair Sheep Lead Contest contact Diane Keltner.


Upcoming Events:

Beef Quality Assurance Trainings:

  • Thursday, September 13, 2018, 6:30 P.M., Producers Stockyards, Hillsboro
  • Thursday, October 25, 2018, 6:30 P.M., Producers Stockyards, Hillsboro

Call your local Ohio State University Extension Office to register for the date and location of the BQA training of your choice. The Highland County Extension Office can be reached at 937-393-1918.

Tickets for the 2018 Farm Science Review are now available at the Highland County Extension Office. Tickets purchased at the Highland County Extension Office are $7, tickets will be $10 at the gate. Children 5 and under are free.

Ag Tax Issues Webinar to be hosted at Clermont County Extension

Image result for agriculture tax osu.edu

Tax practitioners, farmers and farmland owners are encouraged to connect to the Ag and Natural Resources Income Tax Issues Webinar on Dec. 17 from 9 a.m. to 3 p.m. The event is sponsored by Ohio State University Extension and participants can attend the webinar at host locations throughout Ohio or connect at home or office.

The webinar focuses on issues specific to farm tax returns related to agriculture and natural resources, and will highlight key regulations of the Tax Cuts and Jobs Act related specifically to those income tax returns.

The program is an intermediate-level course for tax preparers whose clients include farmers and rural landowners. Farmers who prepare and file their own taxes will also benefit from the webinar.

Topics to be discussed during the webinar include:

New Section 199A 20% Pass-Through Deduction

Learn how pass-through business owners (most all businesses except those organized as C-Corps) can qualify for this new deduction

Farm Loss Deduction Limits

Review the special rules and limits that apply to farm losses and farm net operating losses.

Depreciation of Farm Assets

Discuss new rules impacting the depreciation and expensing of farm assets. Also review the impact of the elimination of IRC § 1031 like-kind exchange treatment for personal property on farm trades.

Farm and Ranch Tax Elections

Identify general rules applicable to making and revoking elections allowed to farm businesses.

Section 199A and Agricultural and Horticultural Cooperatives

Define the new tax law applicable to sales by patrons through cooperatives.

Farm Lease Income and the QBI Deduction

Application of the QBI Deduction to farm lease income.

Entity Considerations

Review entity planning considerations for farm clients necessitated by the new tax law.

Involuntary Conversions:

Involuntary conversions may be the result of a condemnation, a sale under a threat of condemnation, sales of livestock due to weather conditions, or a casualty. The webinar will describe the tax rules associated with these dispositions.

Taxation of Wetland Mitigation Credits

Discuss how wetland mitigation credits are created and how credits might be taxed upon sale or disposition by farmers and ranchers.

Commodities Futures and Options Contracts

Review the tax implications of hedging transactions and options contracts.

Non-Cash Transactions

Identify some of the common challenges associated with non-cash transactions—such as commodity gifts and wages, bartering, and non-cash patronage dividends—and discusses their tax consequences.

Tax Implications of Payments from Energy Companies

Explore the tax treatment of various payments that a landowner or mineral owner may receive from oil and gas exploration, drilling activity, or from wind or solar energy produced on his or her land.

Case Study with Forms

Presentation with a typical farm client and walk through form preparation for that client’s tax return.

The cost for the one-day school is $150, and applications have been made for the following continuing education credits:

  • Accountancy Board of Ohio, CPAs (6 hours)
  • Office of Professional Responsibility, IRS (6 hours)
  • Supreme Court of Ohio, Attorneys (5 hours)

Registration includes the Agricultural Tax Issues workbook. The deadline to register is Dec. 6 to ensure participants will receive the workbook in the mail before the workshop. The live webinar, which will also feature a real-time Q-and-A, can be viewed at several host locations statewide and will include lunch.

Participants also have the option to view the webinar from home if unable to attend a host location.

For those who choose not to attend at a host location, a web address for the webinar will be sent in advance of the Dec. 17 presentation.

Host locations include:

  • Auglaize County, OSU Extension Office, 208 S. Blackhoof St., Wapakoneta
  • Clermont County, OSU Extension Office, 1000 Locust St., Owensville
  • Miami County, OSU Extension Office, 201 W. Main St., Old Courthouse, Troy
  • Putnam County, OSU Extension Office, 1206 E. Second St., Ottawa
  • Wayne County, Fisher Auditorium, 1680 Madison Ave., Wooster
  • Wyandot County, Elks Lodge, 320 E. Wyandot Ave., Upper Sandusky

More information on the workshop, including how to register, can be found at go.osu.edu/agissuesreg

Contact Barry Ward at 614-688-3959, ward.8@osu.edu or Julie Strawser at 614-292-2433, strawser.35@osu.edu with questions.

Tips for Calibrating Grain Yield Monitors – Maximizing Value of Your Yield Data

By Elizabeth Hawkins, John Fulton and Kaylee Port


Calibrating grain yield monitors at harvest can be confusing and time consuming for a combine operator. However, improperly calibrated yield monitors can generate erroneous data that becomes useless or difficult to interpret. Taking the time to calibrate a yield monitor properly pays off when it comes to using yield map data for post-harvest analyses or supporting crop management decisions based on your yield data. Most importantly, quality yield data is required when using yield maps to quantify field results and address questions around profitability.

The first step is to become familiar with your yield monitor and its components. Information provided by your dealer or manufacturer through on-site support, training sessions, user manuals, and online information are all ways to learn about your yield monitor and its components. Today, there exists a substantial amount of information online including quick start guides and tips for calibrating grain yield monitors. Each yield monitor has a specific calibration method which is outlined in the manufacturer’s owner operation manual. In order to maximize the benefits of your yield monitor, this publication outlines several tips to collect quality yield map data and relevant information around setup and calibration before you head to the field.

Yield Monitoring File Formats

Prior to using a yield monitor, it is important not only to understand how to utilize it to collect data during harvest, but also to recognize the file formats and directories created to store the data. Recognizing the files becomes important when transferring yield data from the combine or sharing with a precision ag or data service provider. Table 1 outlines file formats created by the yield monitor display to store yield data. The type of data file has changed over the years as new in-cab displays have been offered.

Table 1. File Formats Generated by Various Yield Monitor Displays.
Company In-cab Display / System File Format
Ag Leader YM2000, PF3000 and PFAdvantage *.yld
Insight *.ilf
Integra, InCommand and newer *.agdata (individual files represent a field)
AGCO FieldStar II TaskData.xml
Case AFS AFS Pro600 and Pro700 *.yld;*.vy1 Hierarchy of file directories, typically beginning with an upper level file directory named for the date it was created… 141119M7.cn1\…
CLAAS CEBIS Quantimeter .dat
John Deere GreenStar 1 GreenStar 2 and newer *.gsd; *.gsy *.ver Hierarchy of file directories, typically beginning with an upper level file directory like…  GS3_2630\harvest\RCD…
New Holland Intelliview *.vyg, *.vy1, *.yld
Precision Planting 20/20 *.dat Data can be synchronized continuously to the “cloud” through Climate FieldView.
Topcon YieldTrakk ISOXML

Prior to Harvest

  • Back up data from the previous season, if not already completed.
    • Best practices:
      • Copy each season’s data to a unique folder labeled as the year and yield data.
      • Maintain several backup copies of the display/raw data in different locations in case it is lost, stolen, damaged, or modified.
      • Delete old files from the memory card or USB drive.
      • Delete old files from display memory if close to full.
  • Check any data cards or USB drives to be sure they work properly with your display.
  • Contact your local dealer or manufacturer to make sure that you have the most recent software and firmware upgrades for your yield monitoring and mapping system, the display, DGPS receiver, and other components. You can obtain information about these upgrades through your manufacturer’s website or by contacting technical support.
  • Check all cables, connections, and sensors for wear or damage. Ensure that wiring and harness connections are tight.
  • For clean grain elevator-mounted moisture sensor units:
    • Make sure the sensor is clean and not damaged.
    • Clear the clean grain elevator of old grain and debris.
    • Check to be sure the manual clean-out motor works on the moisture sensor.
  • Inspect the yield sensor:
    • For combines with a mass flow sensor (normally located at the top of the clean grain elevator):
      • Look for wear on the flow sensor’s impact or deflector plate and replace the plate if worn or damaged. There have been cases where a hole in the plate exists, greatly increasing the risk of inaccurate yield readings.
      • Look for any excessive wear on the grain elevator and missing or worn paddles.
      • Check to make sure that the spacing between the paddles and the top of the elevator meets the manufacturer’s requirements.
      • Ensure the clean grain elevator chain is tightened to manufacturer specifications.
    • For combines with an optical sensor (mounted on the side of the clean grain elevator):
      • Make sure the sensors are clean and not damaged.
      • Ensure the clean grain elevator paddles are not rubbing against sensors.
  • If you purchase a new or used combine with an existing yield monitor installed, double check to make sure it is installed properly. Especially check that the mass flow sensor is mounted securely.
  • If a grain cart with scales or a weigh wagon is used to weigh grain harvested for yield monitor calibration loads, double check that they are producing accurate weight data. Check weigh wagon weights against certified scales each season to ensure the load estimates are within a few percent and use the same scales throughout calibration.
  • Avoid running electrical wires next to the GPS antenna which may cause interference with the receiver signal. Running wires perpendicular to each other decreases the chance for electrical noise that may occur from other electronics.
  • The calibration operation will require accurate estimates of moisture content of the harvested grain. Portable moisture meters commonly used on the farm vary widely in terms of their estimate accuracy. If you are not certain of the accuracy of your grain moisture meter, take it to a local grain elevator that has a federally approved moisture meter and compare estimates on grain samples, preferably samples representing a wide range of grain moisture, e.g., 13 to 28 percent grain moisture content.
    • Document differences between your meter and the meter known to be accurate. As an example:
      • Your meter estimates 25 percent; accurate meter estimates 28 percent.
      • Your meter estimates 20 percent; accurate meter estimates 22 percent.
      • Your meter estimates 15 percent; accurate meter estimates 16 percent.
    • During the yield monitor calibration operation, use the documented moisture estimate differences to adjust the estimates of moisture made on grain sampled from the harvested calibration loads.
    • It is still recommended to always check moisture content estimates with a federally-approved moisture meter.

During Operation, Prior To Calibration

  • Start up combine and turn on the yield monitor display to check the following:
    • Display indicates everything is functioning correctly or is properly connected.
    • Memory card or USB drive is installed properly, if required.
      • Make sure there is proper communication between the data card and the in-cab display for those displays requiring a memory card to collect data; mostly older displays such as the Ag Leader PF series display. Usually an error message will appear on the display indicating there is no communication with the card.
    • DGPS receiver is providing a position and has differential correction (WAAS, SF1, SF2, RTX, or RTK).
      • Note: If purchasing a differential correction service, make sure your subscription runs through harvest.
  • Check and set header switch for starting and stopping of data collection.
    • Raise and lower the header to make sure the stop-height switch operates properly.
    • Automatic On/Off using the switch: Most yield monitors will step through the electronical setting of the start (header down position) and stop (header up position) positions for the switch during initial calibration. However, you may want to check annually or change when moving between corn and platform headers since these are operated at different heights.
    • Manual On/Off: Some yield monitors are equipped with a manual button that turns on and off data collection through the in-cab display. You may have to adjust the header height switch to accommodate the preferences of different operators during harvest.
  • Set row width according to number of rows for a row crop header or the appropriate width of a cutting platform header.
    • Some yield monitors have the option to use automatic swath width detection to adjust the swath width when overlap is detected. This feature can be helpful when harvesting point rows or near field edges; however, be aware it may not function properly if your DGPS source has a potential for large positional error (e.g. ,WAAS) or if there is signal interference or loss.
  • Engage the separator and observe the elevator speed on the in-cab display to make sure the shaft sensor is operating correctly. The clean grain elevator speed (e.g., RPM) is used as feedback for computing the yield estimate since speed controls the frequency of which grain from the elevator paddles impact the mass flow sensor.

Calibration

The yield estimate produced by a yield monitor is calculated from estimates made by multiple sensors. Each of these sensors must be calibrated in order for the yield estimate to be accurate. Consult your user manual to determine the sequence in which these calibrations should take place.

Mass-Flow Sensor Vibration Calibration

This calibration is used to document the effect of vibration when the combine is running. Follow the directions in your user manual to complete the vibration calibration. Be sure that:

  • The proper header is attached and in operating position (not resting on ground).
  • The combine is empty of grain.
  • The separator and header are engaged.
  • The combine is running at full RPM.
Temperature Calibration 

This calibration ensures accuracy of the grain moisture estimates made by the moisture sensor in the clean grain elevator. Most manufacturers suggest this calibration only be performed once at the beginning of the season.

  • Perform this calibration when the combine has been sitting for several hours and preferably in a shaded area. Ensure the combine and moisture sensors are empty of grain.
  • Estimate the air temperature using an accurate thermometer.
  • Adjust the temperature value reported by the display according to the user manual.
    • Some displays require you to simply enter the temperature reading from the thermometer, others require you to enter an offset value (usually the difference between the thermometer reading and the sensor reading).
Moisture Sensor “Calibration”

This “calibration” is necessary to ensure that the moisture sensor in the clean grain elevator accurately estimates grain moisture content, which in turn is used by the display to calculate “dry” grain yield based on the “dry” moisture value of your choice. The process is not a true calibration because it is based on a single comparison of the display’s estimate of grain moisture from a harvested load, with that estimated from a small sample of grain collected during the off-loading of grain to the wagon, grain cart, or truck.

  • Some manufacturers suggest that moisture “calibration” need only be performed once during the harvest season. Our experience suggests that the accuracy of a moisture sensor can change throughout the season as harvest grain moisture levels change. Check the accuracy of moisture sensor estimates routinely during the season.
    • Be aware that yield monitor displays differ in how they handle changes in grain moisture “calibration.” Some apply changes retroactively to previously harvested grain and others apply changes only to future harvested grain.
  • Reset the moisture offset in the display to zero.
  • Randomly collect grain from each calibration load to obtain a representative sample.
  • Measure the moisture of the grain samples with an accurate grain moisture meter.
  • Enter the difference between the display moisture estimate and the grain sample estimate into the display according to your user manual.
  • Repeat this calibration for each type of grain harvested.
Ground Speed Calibration

Many yield monitors today use GPS to determine ground speed, therefore there is no need for a ground speed calibration. If a mechanical speed sensor is being used as a backup, it should be calibrated. These calibrations are conducted by traveling a known distance through the field and timing how long it takes. When calibrating the ground speed sensor, use typical field conditions rather than a road or waterway. Tire slippage can create inaccuracy with calibration.

Mass Flow Sensor (Weight) Calibration

Proper calibration of the mass flow sensor is crucial to the accuracy of grain flow estimates and, ultimately, the yield estimates. The weight calibration process basically involves harvesting individual loads of grain and verifying the actual weight of the harvested grain with accurate scales. The actual weights of the individual loads are manually entered into the calibration screen of the display. Built-in software procedures then calibrate the display’s weight estimates to best match the scale’s estimates. Display manuals often suggest that calibration errors can be minimized to 5 percent or less. If best management calibration practices are followed, most modern displays can easily be calibrated to 1 percent error or less.

There are two common approaches used for calibration: a near-linear calibration and a non-linear calibration.

  • Near-linear calibrations require one or two calibration loads to generate a calibration line.
    • Many older yield monitors (primarily GreenStar displays prior to the S-series combines) use near-linear calibrations.
    • The Precision Planting YieldSense™ system typically requires a single load calibration procedure. It also provides an optional “True Up” feature for tweaking calibration accuracy later in harvest. Of note, the YieldSense™ Grain Property Kit that replaces one of the paddles on the clean grain elevator allows continuous adjustments of the calibration as grain conditions (e.g., test weight) vary.
  • Non-linear calibrations require four or more calibration loads that represent a range of anticipated grain flow rates to generate a calibration curve.
    • Use the number of calibration loads recommended by the manufacturer (commonly four to six calibration loads).

Regardless of the calibration method, the quality of the calibration loads is important. The following best practices can help ensure the calibration is accurate.

  • Calibration loads should be representative of the different grain flow rates (pounds per second or bushels per hour) that will be encountered. It is important to take the time to calibrate the mass flow or volumetric sensors over the full range of expected loads. Note that older GreenStar and the Precision Planting YieldSense™ systems follow a different process but regardless, it is good to understand this section.
    • Harvest calibration loads at different flow rates (low to high). The goal is to have each load harvested at a constant and consistent flow rate. Target flow rates can be achieved by:
      • harvesting each load with a full header at different speeds.
      • harvesting each load at a constant speed with different harvested swath widths.
  • When harvesting calibration loads, it is recommended to use loads between 3,000 to 8,000 pounds for most yield monitors. Precision Planting’s YieldSense™ manual does recommend 25,000-pound calibration loads or three 10,000-pound loads. This helps reduce the overall sensor error while calibrating.
  • Avoid starting calibration loads on turn rows, weed patches, or areas of major topography changes in the field.
    • Hillsides and rolling ground can impact calibration load data because of changes in how grain impacts the flow sensor.
    • If you are unable to avoid topographical changes make sure you get a good representation of loads going up- and downhill and side-to-side of a hill.
  • It is necessary to calibrate for each type of grain for each year.
    • Flow rates tend to be much higher when harvesting corn compared to soybeans or wheat.
    • Other grain characteristics that vary between different grain types can alter the reading produced by the mass flow sensor.
    • The dynamics of grain flow through a combine changes with wear and tear.
  • When conducting on-farm research trials or harvesting fields with multiple varieties, consider paying attention to large differences in moisture content; a two to three point swing in test weight between varieties. Again, having calibration curves for high and low moisture or high and low test weight will help collect quality data. Of note, the Precision Planting Grain Property Kit can help adjust yield estimates for swings in test weight within the YieldSense™ monitor.
    • For example, calibrate for regular corn and high oil corn separately due to the differences in test weight and moisture characteristics of the grain.
  • Calibrate for different moisture levels per type of grain.
    • For example, calibrate differently for corn below 20 percent moisture versus corn above 20 percent moisture.

During Harvest

  • Take good notes on field and operating conditions during harvest. This information will be helpful when reviewing yield maps after harvest. Capturing images with your smartphone, iPad, or similar device can be a simple way of collecting visual notes.
  • Correct any malfunctions or errors indicated by the yield monitor, including loss of DGPS signal. Make sure the display is actually collecting data. Sometimes one can manually switch off data collection on the display and forget to turn it back on for older model yield monitors.
  • Remove your memory card or USB drive from the display when not in use and back up data onto your computer and data storage devices frequently throughout the harvest season. A simple electrical shock from improper wiring or lightning can destroy data.
  • It is wise to perform periodic calibration loads throughout a lengthy harvest season to check or improve accuracy of the weight estimates. It is suggested to recalibrate if you observe:
    • more than a 5 percent difference in weight calibration errors,
    • 5 pound per bushel differences in grain test weight, or
    • temperature changes greater than 10 degrees.
  • Be sure to recalibrate after replacing yield monitor components or if changes are made to the elevator chain, paddles, or flow sensor during harvest.
    • Tightening the elevator chain, replacing old paddles, or changing the distance between the flow sensor and paddles changes the accuracy of the previous calibration.
  • If you run into problems with the monitoring equipment during harvest, check the troubleshooting information in the operator’s manual. Contact technical support if you are unable to solve the issue.
  • The use of telemetry or wireless data transfer offers the ability to transfer data automatically from the in-cab display to the “cloud.” Every OEM along with third party companies offer wireless data transfer technology improving the ability to seamlessly transfer data to the “cloud” providing backup for your data along with the ability to access online.
Table 2. List of Various Yield Monitors by Company.
Company Product Name Website
Ag Leader 2000, PF Series, InSight, EDGE, Versa, Integra, Compass, InCommand agleader.com
AGCO FieldStar II / See FUSE technology agcocorp.com or agcotechnologies.com
Case IH Advanced Farming Systems (AFS) caseih.com
CLAAS Quantimeter claasofamerica.com
John Deere GreenStar deere.com
New Holland Intelliview, FM-1000, FM-750, (See Precision Land Management) newholland.com
Precision Planting YieldSense™ precisionplanting.com
Topcon YieldTrakk topconpositioning.com or rdstec.com

This publication was originally published by Nathan Watermeier in 2004.

Visit the Ohio State University’s Precision Agriculture Web Site precisionag.osu.edu for additional Precision Ag information.

Retrieved from: https://ohioline.osu.edu/factsheet/anr-8