2015 Ed Tech Year in Review

Last week, the Ed Tech Unit shared a snapshot of data and other information from August – December 2015 with Administrative Cabinet members. Browse through the brief slide deck below to see how 2015 Tech Use and Skills Survey data was used to address the needs of the organization, how many OSUE professionals received assistance during this time period from an Ed Tech and the type of assistance they received, as well as Ed Tech initiatives for 2016.

The 2016 Organizational Tech Use & Skills Survey will be emailed January 29th!

Web-Based Survey Workshop December 14th!

Get a jump start on your 2016 program planning by participating in an upcoming workshop offered by the Program Development and Evaluation unit December 14th. The hands-on workshop will cover:

  • Web-based survey best practices
  • Basic features of LimeSurvey and Qualtrics
  • Guided survey development

This workshop will take place in Columbus. Registration is now open – sign up soon, as these workshops fill up quickly!

Web based survey training flyer_December 2015

Contact Debby Lewis with any questions.

Digital Scholarship is Getting the Attention it Deserves

Eric Stafne, Extension Professor from Mississippi State University, has posted a very interesting and thought-provoking 5-part series on the eXtension Educational Technology Learning Network’s blog this week. In this series, he discusses his favorite definition of digital scholarship, how digital technology and scholarship best connect, outlines barriers to digital scholarship and offers solutions to how Extension can address these barriers.

I encourage everyone in Extension who is interested in traditional media, digital media, and scholarship, as well as the future of academic content, to read this series and offer your input on the digital scholarship blog posts. You can also Tweet your reaction and thoughts using the #EdTechLN hashtag and be part of the conversation.

Click here to access the entire digital scholarship blog post series by Eric Stafne. 

During the entire month of May, the #EdTechLN is shining the spotlight on digital scholarship and its impact on Extension. Next week’s #EdTechLN TweetUp (May 7th at 2:00pm EST) will focus on this topic. You can join and follow the TweetUp by going to: twubs.com/edtechln  If you’d like to take a look at the last TweetUp discussing digital scholarship, which focused on “Traditional Pubs. vs. Digital Content” you can access the summary here.

It should also be noted that we’re addressing digital scholarship questions and issues here in Ohio. The Extension Promotion and Tenure Committee is working hard to discuss solutions to how we define quality digital media and content.  A handout presented to the P&T Committee to begin this discussion is below:

PT-Committee-Handout-Digital-Scholarship-1804j39.pdf.

Quick Byte: What is an Internet Meme?

Merriam Webster defines a meme as an “idea, behavior, style, or usage that spreads from person to person within a culture”. With the introduction of the popular world wide web in the 1990’s, the meme morphed into a more specific ideal of how information was exchanged through online interaction.

The First Internet Meme

Think about the way that information is communicated online, or even with text message today. How do you convey emotion? The emoticon. These “faces” were popular in how people transitioned from face to face or conversation over the phone. Unable to see the emotions of the person typing meant there had to be a way developed that communicated how someone felt, otherwise something serious could be taken lightly, or something aimed to be lighthearted might be taken seriously. The first emoticons the :- ) and :- ( have stayed popular in use as they are simple, easy to remember, and convey needed emotion in communication.

picture-cat-internet-memeThe Rise of Image Memes

Today there are images. While they existed before “I can has cheezburger” http://icanhas.cheezburger.com/ exploded to popularity of the meme. From that time on, memes have taken on different popular culture. Today, we see meme’s almost as quickly as we learn about the news or popular culture that they relate to. The I can has cheezburger meme has led to more cat pictures with funny sayings, often trying to give a human-like facade to cats. The idea of relating an animal to human problems has been popular with almost every animal imaginable.



4680932ee7e483f1a4e929f4cb15e2e2 The Angry Cat

Often with meme’s they will feature the same image with different saying or text on them. The angry cat comes to mind with this type of meme. Her little angry face is the same, but the words change (for the record, the angry cat is a female and named Tadar Sauce).


 Keep Calm & Carry On

download

An example of a popular recent meme is the “Keep Calm and Carry On” Often replicated and changed to fit popular culture. The original was a World War 2 poster that the British used. Designed to be put in public places, such as transportation the idea was that the poster would only be hung up if the Germans invaded Britain.  Since that invasion never happened, the poster was never put out publicly. (for more information on this poster please visit this site on the history behind it (http://www.keepcalmandcarryon.com/history/) The image to the left is a depiction of all of the original posters used by Britain during the war.


Below is an example of meme that has taken this British poster and gave it popular culture with the hit by Kansas, Carry on Wayward Song.

7bf0ccaf2d9cbd6aec61f311378788a7


So What Does this Mean?

69a1aba67c2c0255e0c98351dfc09b9fSo what does this mean for you and Extension? Well, it depends. Understand that at any time you have something that could become a meme. Popular culture can often be unpredictable, but there are many ways to bring a meme to the internet population in a way that would make it funny AND educational.  In 4-H memes are often warm fuzzy moments for alumni, honoring parents, or volunteers. The idea is that there are so many people who support 4-H that they will share those photos and more and more people will be exposed to it.  An example of this is the graphic to the left. The graphic is visually pleasing, has the clover on it, and is aimed at those camp counselors and campers that we take to 4-H camp every year. The more that put this picture on their social media accounts, the more people are exposed to the 4-H brand.

The same can happen for any area. If there is just a snippet of information that someone wants to get out to the public, a meme may be the way to do it! Maybe something about hand washing, or something about gardening practices could be popular with many people on social media. With sites like Pixabay for graphics, and a graphic editing program as simple as paint, a meme can be born!

Ideally the graphics we could put out would have the college branding attached to them. The branding attached would give Extension as well as Ohio State exposure to the public as a place of resource in their communities. While putting together a meme may seem just like extra work, the ability to grab someone’s attention is a visual way online is worth the reach and interaction you can gain.

Think about what you could contribute to the online world with meme’s. What important information might you be able to share? A fun example to look over is the http://heckyeaheducationalmemes.tumblr.com/  While based upon English education, you can see why it would work to have small snippets of information to share.

As always, if you have questions, please let me know by leaving a comment or emailing me at gottke.4@osu.edu.

signaturefirstonly


Reporting Your Good [Tech] Work: Facebook Impact

One of the most commonly asked questions during this time of the year the past several years has been: “How do I report my social media and/or tech use in my work?” While we still do not have official step-by-step guidelines on how to do this in RiV, there is helpful information on where to report most tech-related work in RiV, as well as suggestions on what should be reported. This information is below:

  1. Where in RiV to report your Facebook efforts:
  • If Facebook presence is part of a program, then impact data should be included under that Program.
  • If Facebook presence is separate from any program or project, then it should be reported under “Multi-media, Databases, and Websites” as a website

3.  What data to report:

  • Reach
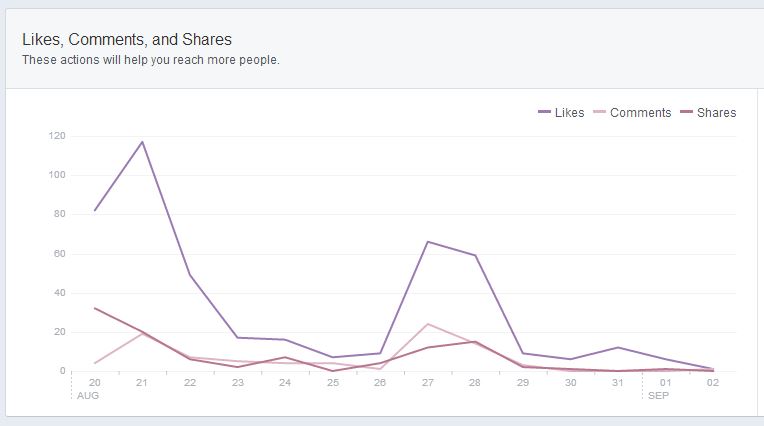
  • Engagement (post clicks, likes, comments & shares). This can be reported as general “engagement” or you can separate out post clicks, likes, comments, and shares and report those separately.
  • Audience demographics (optional)
  • Detailed information from posts that had the most reach and/or engagement (optional)

4.  Where to find the data to report:

  • Facebook fan page Insights (find the link on the admin panel of your page) ***see yellow arrows in the image below***
  • The handy visual graphs of your Insights only go back about 3 months. To retrieve a year’s worth of data, you will need to download your data by clicking on “Export Data” up on the right-hand corner of the Insight page. Choose the dates you need (1/01/2013 – 12/30/2013 if you are exporting for the entire year). You will want to choose “Page Level Data”. Then click on “Download”.
  • This will download your data in an Excel spreadsheet format. Highlighted below are columns – “Daily Page Engaged Users” and “Daily Total Reach” – you will want to total (“Sum” tool in Excel) and report in RiV. Both of these columns are included in the “Key Metrics” tab (1st Tab in the Spreadsheet). Don’t forget to also report your total number of page “likes”.

  • You may also wish to report demographic information regarding your Facebook audience. This information can be found in an easier-to-use and view format in your Facebook page insights. On your Insights page, click on “People” (under yellow arrow in the image below). This tab will show you who your page fans are – who “likes” your page. You can view gender, age, and location demographics from this tab. I would suggest adding the percentages of each of these to your RiV report.

  • One final piece of data available to you that you may want to include in RiV is the impact of Facebook posts that did particularly well. The image below is of a post from the FCS Facebook page on Thanksgiving that reached a large amount of people (when compared to normal posts on that page).  I would suggest reporting the topic, type of post (text, photo, etc.), reach, post clicks, and engagement level for one or two of the posts over the last year that had the most impact/engagement.

After you’ve gone through the above steps for your Facebook data, your RiV report description may look something like this:

“The OSU Extension Family & Consumer Sciences Facebook page had a total of 591 fans by December, 2013. Eighty-five percent of page fans were female, with 13% being male. Most page fans live in the city of Columbus, Ohio. Seventy five updates were posted to the Facebook page in 2013 and reached over 121,000 people. More than 25,000 people engaged with the page’s posts. One post that was particularly well received, wished followers a Happy Thanksgiving and was posted during National Family Week. It provided tips on how to enjoy a Thanksgiving meal with family and reached nearly 375 people, had 6 click-throughs, and engaged 23 users who liked, commented, or shared the post.” 

Of course, the amount of impact data you can garner from the Facebook Insight Excel sheet is mind-boggling, so the sky is the limit on how much additional data you could report in RiV… but the above “template” will provide the basic impact information needed to show your efforts and impact in an online environment. I really hope this “how-to” is helpful!

If you’ve already been reporting your technology-related work in RiV, how have you reported it? Share your insights so that others can benefit! Comment also if you have questions about how to report your Facebook work in RiV that this post may not have answered. I’m happy to help!

We’ll post two more “how-to’s” for your blogging efforts and Twitter efforts soon.

Happy RiV reporting! 😉

~Jamie


Tech, Social Media & RiV… Help is On the Way!

As any Extension professional knows who includes social media and other technologies into their programming, it’s that these tools aren’t easy to report in RiV at the end of each month…. (okay… each year!) This is an issue many of us have found ourselves in the past several years. We’re using (relatively) new tools, doing great things with them, and the reporting system isn’t keeping up. How to gauge impact from technology use, and then report that impact, is a topic our Ed Tech Team has been working on over the past couple months. We’ve been in contact with Debbie Lewis, as well as members of the Promotion & Tenure committee, to begin putting together easy-to-use guidelines, or at least tidbits of information for everyone in the organization to use during end-of-the-year reporting.

Here is what we know so far:

  • There IS a correct way to gauge and report social media impact, especially if you have a business page or fan page. If social media use is PART of a program, you should include reach and engagement data (post clicks, likes, shares, comments, etc.) under that particular program in RiV. If social media use is not part of a specific program, it still needs to be reported under “Programs”, but by itself separately. Additionally, if you write blog posts, that information should be reported under “Creative Works”. (We’ll post more detailed information on how to do this in December.)
  • There IS a way to get analytics and/or impact data with each social media tool. Some tools provide this information much easier than others. Facebook for example, provides mind-boggling amounts of data in their “Insights” for business and fan pages. Twitter impact data, however, is harder to gauge if you’re not using a social media manager platform for analytics (i.e. Hootsuite or Sprout Social).
  • It DOES help to have a tech or social media strategy in place before diving in. When our intended outcomes or impact are documented early on, it’s easier to track impact for reporting purposes. If you’re not sure where to begin, list 2 or 3 goals or outcomes for your tech or social media use and then track how you’re fulfilling those goals over the next few months.
  • Our Ed Tech team is working hard to assist with how to properly document and report technology and social media use for P&T purposes, and we will be offering our recommendations to the P&T committee.
  • If you are struggling trying to figure out how to report what you’re doing, you’re not alone. This has been an on-going issue since URS turned into OSU:Pro and OSU:Pro gave way to RiV… all while many of us began working very, very differently. It’s become not about how the reporting system is going to adapt to how we’re working (it will never be able to keep up), but more about where can we report activities to accurately get credit for things we are doing?

What to look for in December:

  • A series of EdgeU Tech Blog posts on how to report social media and technology use and impact in RiV
  • Updates on technology use and how to report/document for the P&T process
  • Based on the responses we received from the organization-wide Social Media Survey (we’ll share those results soon), there will be two different social media workshops offered in each EERA next year – a “Basics” workshop and an “In-Depth” workshop. Both workshops will provide information on how to find, document, and report social media use. Dates and locations of each workshop will be announced at Annual Conference.

In the meantime, please consider attending one of the RiV Webinars via Carmen Connect offered in the coming weeks. The next session is today (11/19) at 1:00pm. Additional dates and times are listed below:

  • November 20 – 10 am to noon – CarmenConnect
  • December 3 – 10 am to noon – Columbus, 4-H Center, Multi-Media Room (second floor)
  • December 11 – 9 am to noon – Ag Administration Building, Room 5 – geared for promotion / tenure candidates


~Jamie