Ben Brown
Department of Agricultural, Environmental, and Development Economics
The Ohio State University
February 15, 2019
The agricultural industry is a global economy with buyers (consumers), sellers (producers) and traders. In the United States, producers of corn have a comparative advantage- the ability to produce it cheaper per unit or at higher quality- over most other parts of the world. However, genetics, changes in weather patterns, land limitations, politics and global gross domestic product affect quantities of production and consumption.
Long-term trade projections for U.S. corn published by the Economics Research Service of the USDA look positive due to the expected rise in world GDP and population; however, increases in competition from other exporting countries continue trending toward a decrease in United States’ share of world exports. Trade negotiations between the U.S. and China are in the middle of a 90-day trade truce, which ends the beginning of March. It is uncertain what, if any, resolution will surface before or at the deadline. In December 2018, commodity indices declined before the previous trade deadline, but rallied at the announcement of the 90-day extension. Long-term projections include a continuation of current policies, accounting for tariffs from Mexico, the European Union, Mexico and Canada.
The USDA World Production Report, published February 8, 2019, puts the size of the 2018/19 world corn crop at slightly more than 43 billion bushels. With production in the United States estimated at 14.4 billion bushels, any reduction in world supply will come from Brazil’s short season corn crop.
Long-term trade estimations for world corn continue to see growth, with corn trade expected close to 163 million metric tons in 2018/19, up from 147 million metric tons in 2017/18. This increase in trade comes from expected strong corn production in Argentina and Brazil after last year’s drought.
Figure 1: World Corn Exports

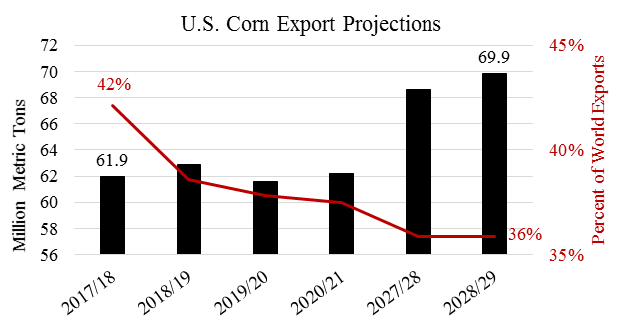
Figure 1 illustrates world corn exports for marketing year 2017/18 through projections for 2028/29. The U.S. remains the largest exporter of corn to the world and increases almost 8 million metric tons or 13% by the end of the projection period. Major changes in corn export absolute values (million metric tons) come from Brazil (20.3), Argentina (8.8), and Ukraine (10.3). Percentage growth shows emerging producers like Europe (234%) increasing their exports from a relative low position. Growth in exports from these countries threaten the share of U.S. global corn trade. Figure 2 shows the growth in U.S. corn exports projected, but also the declining share of global corn trade.
Figure 2: U.S. Corn Exports

U.S. corn exports are projected to rise from almost 62 million metric tons (2.4 billion bushels) to almost 70 million metric tons (2.7 billion bushels) and show the continued growth in production and demand for U.S. corn abroad.
Associated with every seller (exporter) there has to be a buyer (importer). With the growth in world exports, there is also a growth in world imports to make the accounts balance. Mexico remains the largest purchaser of corn at 16.2 million metric tons (638 million bushels) with an estimated growth of 7 million metric tons (276 million bushels) by 2028/29. Currently, Mexico represents roughly 11% of the global corn trade. Regarding corn imports, a larger number of countries buy relatively smaller amounts of product compared to the smaller number of exporters who sell larger quantities of product. For exporters, the U.S., Brazil and Argentina represent 73% of the world total. Still the small importing corn countries represent a significant role in world trade. Figure 3 illustrated world share of corn imports and growth through 2028/29.
Figure 3: World Corn Imports

Growth (million metric tons) in Mexico (7.1) accompanied by Vietnam (6.1), Egypt (5.1), South Africa (5), Iran (3.2), and China (3.2) make up the majority the of estimated world import increase through 2028/29.
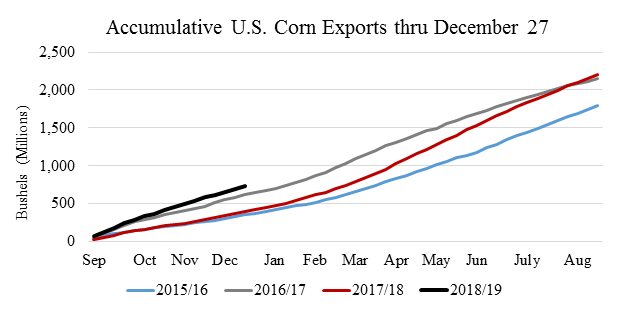
Looking at U.S. corn exports for the current marketing year, (September 1, 2018 through August 31, 2019), corn exports started strong compared to past marketing years, but have slowed the past few weeks. The government shutdown that started December 22, 2018 and ran through January 25, 2019 has delayed corn export data, but weekly totals through the end of December are available and represented by Figure 4.
Current USDA estimates place U.S. corn exports for marketing year 2018/19 at 2.45 billion bushels up from 2017/18 at 2.438 billion bushels. Through the last week of December, corn exports came in 53% higher than the same week a year earlier. However, the rate of exports slowed in December. To meet the USDA estimate, the export volume for the next 35 weeks would need to average 47 million bushels a week. The weekly average in December came in at 38 million bushels per week. This does not mean the U.S. cannot meet the estimated export volumes, but increases in weekly sales will have to match the increase seen in 2015/16 during the second half of the marketing year.
The potential for increased sales in the second half of the marketing year look limited at the current time. Outstanding sales for the current marking year sit close at just over 512 million bushels. This is 15% below the three-year average, which includes marketing years 2015/16 and 2017/18, noted as having strong exports in the second half of the year. Exports in 2017/18 benefited from a low U.S. corn price, driven down by retaliatory tariffs on U.S. soybeans from China and a 14.4 billion bushel crop.
Figure 4: U.S. Corn Exports

Growth early in the current marketing year occurred thanks to some of the same countries mentioned above as being large key markets for future world trade. U.S. corn exports to Mexico were up 69 million bushels from a three-year historical average. Other areas of strong growth in U.S. corn exports were to Japan (56 million bushels), Korea (43 million bushels), Taiwan (23 million bushels), and Columbia (19 million bushels). Sustained values within these countries and growth from other areas will be needed to meet the USDA estimate.
Due to the lapse in federal funding, weekly trade information provided by the Foreign Agricultural Service of USDA is only current through the last week of December. However, grain inspections through February 7 indicated that corn exports are averaging 37. 4 million bushels each week to start 2019. In December, federal inspections were roughly 7.4% below USDA export values weekly. Assuming this margin holds, weekly sales could be equal to 40.1 million bushels, still well below the average needed to hit USDA’s estimate for 2018/19. An export value of 2.425 billion bushels seems more likely at the current time.
The future of U.S. corn exports look strong in future years supported by growth in domestic production and growing desire for corn consumption abroad. Increases in international competitors continue to decrease the U.S. percentage in world corn trade. Corn exports started strong for marketing year 2018/19, but will need to increase pace to meet the current USDA estimate of 2.45 billion bushels.
References
United State Census Bureau. “Weekly Export Inspections”, February 7, 2019.
United States Department of Agriculture-Economic Research Service. “Long-Term Term Trade Projections”, February 14, 2019.
United States Department of Agriculture- Foreign Agricultural Service. “Exports Sales Query”, February 15, 2019.
United States Department of Agriculture- World Agricultural Board. “World Agricultural Supply and Demand Estimates, WASDE-578, February 8, 2019.


