The Accidental Geographer

I unknowingly began my journey into the field of geography when I stepped off a boat in the Peruvian Amazon in 2018. I spent the summer living and working on a small biological station run by an NGO called Project Amazonas.

Sreya Juras holding a paca that belonged to a teacher in a village nearby the biological station

At the time, I was a molecular genetics major but my transformative experience in the Amazon led me to switch to international development upon returning to OSU. My time in the Amazon showed me a great deal about the influence of space and place in small rural societies. Years later, I am now pursuing graduate work in the field of geography with my research interests informed by what I learned there.

I graduated from OSU in the Spring of 2021 and obtained a degree in international development studies with minors in environmental science and Spanish, as well as research distinction in geography. In my third year of university, I became involved with the Department of Geography as a research assistant. This was my first time being exposed to geography and the more I learned the more passionate I became about this field. I conducted research with Alvaro Montenegro to understand the pre-historic presence of South American sweet potatoes in Polynesia. Working with Dr. Montenegro allowed me to engage with academic research for the first time. We conducted lab work in Derby Hall and worked with a graduate student, John Temmen who ran GIS simulations which functioned contemporaneously. I began communications with the two in the fall of 2019, began lab work in early 2020 and completed and defended my undergraduate thesis in the spring of 2021.

Photo of sweet potato experiment set up in lab in Derby Hall

For this, I was awarded the McKenzie/Brecher Undergraduate Scholarship from the Byrd Polar and Climate Research Center. Additionally, I was awarded the Undergraduate Research / International Research Grant from Ohio State’s Arts and Sciences Honors Program. I presented this research at the East Lakes American Association of Geographers conference in October of 2020 in which I won first place in the undergraduate presenter category. Finally, I successfully defended my thesis the Spring of 2021 and graduated with research distinction in geography. Currently, I am working for the American Association of Geographers, further familiarizing myself with the field of geography.

In looking toward the future, I want to research climate adaptation and resilience in Latin America. The driving factor in this decision are the experiences I had living in the Peruvian Amazon and the lessons I learned while conducting research within the geography department.  I intend to focus my adaptation research on the necessity of migration, and I plan to research how climate-driven migrations from rural communities in Latin America will unfold in the coming years.


Sreya Juras

Bachelor of Science 2021

Environmental Sciences, International Studies, and Spanish with a minor in Development Studies

Then and Now

When I was invited to blog about “then and now”, I thought about historian David McCullough’s statement: “One might also say that history is not about the past. If you think about it, no one ever lived in the past… They lived in the present.” If then is made in the now as McCullough seems to suggest, now is also a piece of then. It is in this spirit that I see then, my time at OSU in the late 1980s and early 1990s, as a source of inspiration to the making of a protean career, and a piece of now as an economic geographer.

The “boundaried” career is centered on the organization, the university.  The tenure institution focuses academics on the needs and requirements of the university early on in an individual’s career.  In the 1990s, the old social contract gave way to newer forms of social contracts arising from downsizing and the emergence of smaller and innovation-driven firms.  Such instability also occurred in academia with adjunctivization.  The less predictable work organization resulted in greater instability for the employee but the protean career also sneaked up on me.

When I graduated from The Ohio State University (OSU) in the 1990s, I was confronted with such instability. Fewer academic positions were available and quantitative economic geography was on the decline.   Unlike other students of Emilio Casetti’s (my dissertation adviser), many of whom were assuming illustrious careers in major departments, I had graduated from OSU without a publication because I had spent my time in the Economics and Sociology departments expanding my understanding of international trade and Asia. The lure towards interdisciplinarity is a big piece of now. Graduating without a publication was not my biggest challenge.  Speaking the language of the expansion method was.  I decided early on to write my papers differently, focusing on the research question than the methodology. The first paper was a hit and was subsequently selected as a classic for a regional science volume.  I went on to publish more expansion method pieces despite warnings of doom from colleagues. Part of such early adaptability was honed from animated arguments with Edward Taaffe, Nancy Ettlinger and Kevin Cox, and the audacity to pry apart Larry Brown’s hot off the press “Place, Migration and Development in the Third World”. But one of the biggest resources, graduate students in Derby Hall, fomented a training ground that was to last a lifetime. Some rejected objectivism and forced me to reflect on my intellectual biases. Others tempted me with the lure of emerging geospatial technology. Enlarging boundary has allowed me to cross disciplinary and epistemological aisles, publish using a wide range of methodological tools, and enjoy a protean career as an economic geographer.

Then was a time of learning to embrace methodological pluralism, and now is a piece of then as such pluralism has continued to define my scholarly work. This centennial celebration has provided an opportunity for reflections, OSU being the place where I began my journey across boundaries. Congratulations on your centennial anniversary.

Jessie Poon, Professor, University at Buffalo (SUNY),

Co-Editor, Environment & Planning A,

Chair, Regional Studies Association

City’s Municipal Service Requests May Help Identify “Hotspots” for Opioid Use and Overdoses

Background

Opioid use disorder and overdose deaths is a public health crisis in the United States. In the year of 2019, over 70% of all drug overdose deaths involved an opioid, including prescription opioids, heroin, and synthetic opioid like fentanyl (National Institute of Drug Abuse, 2021). Ohio is among the states hit hardest by the “opioid epidemic” with the rise in the misuse and abuse of prescription opioid pain relievers like OxyContin and Fentanyl and non-prescription opioids like heroin. Franklin County, which includes City of Columbus and the surrounding suburbs, experienced 547 drug overdose deaths in 2019 the largest number of any region in the state, and representing a 14.9% increase over the previous year (Ohio Department of Health, 2020).

There is increasing recognition that crisis’s etiology is rooted in part by social determinants such as poverty, isolation and social upheaval. This places attention on the health effects of upstream social factors such as economic, education, and demographic that shape downstream factors such as behavior, economic stability, stress levels, support networks, neighborhood and physical environment, and access to healthy food and health care. Limiting research and policy interventions is the low temporal and spatial resolution of publicly available administrative data such as census data. A lack of timely, high-resolution data hampers research into the neighborhood social determinants of opioid use disorder. We explore the use of nontraditional municipal service requests (also known as “311” requests) as high resolution spatial and temporal indicators of neighborhood social distress and opioid misuse. These are public data that are frequently updated (in many cases, daily) and have high spatial resolution (latitude and longitude).

Results

We analyze the spatial associations between georeferenced opioid overdose event (OOE) data from emergency medical service responders and 311 service request data from the City of Columbus, OH, USA for the time period 2008–2017. We find 10 out of 21 types of 311 requests (abandoned vehicles, animal complaints, code violation, law enforcement, public health, refuse trash litter, street lighting, street maintenance, traffic signs, and water sewers drains) spatially associate with OOEs and also characterize neighborhoods with lower socio-economic status in the city, both consistently over time. We also demonstrate that the 311 indicators are capable of predicting OOE hotspots at the neighborhood-level: our results show code violation, public health, and street lighting were the top three accurate predictors with predictive accuracy as 0.92, 0.89 and 0.83, respectively.

Figure (a) shows the actual spatial distribution of OOE hot spots and cold spots in Columbus, 2017. The remaining maps show the three most accurate predictors based on predict accuracy: code violation (b), public health (c) and street lighting (d). Figure also shows the three most inaccurate predictions: traffic signs, street maintenance, and waters sewers drains in Fig. e–g, respectively. (Li et al., 2020)

Implications 

The results from this study support the view that opioid crisis is rooted in social and neighborhood distress. We show such spatial characteristics can be used along with 311 data itself to predict the trends of opioid overdose hotspots when OOEs data is not available. Since 311 requests are publicly available and with high spatial and temporal resolution, they can be effective as opioid overdose surveillance indicators for basic research and applied policy. It is worth mentioning that our research is not a predictive policing tool. An appropriate use is to help think strategically about where to allocate outreach, programs and resources to at-risk individuals and how to alleviate the underlying social and environmental stressors in our city.

Yuchen Li, PhD Candidate

Department of Geography

The Ohio State University

References

Li, Y., Hyder, A., Southerland, L. T., Hammond, G., Porr, A., & Miller, H. J. (2020). 311 Service Requests As Indicators of Neighborhood Distress and Opioid Use Disorder. Scientific Reports, 10(1), 1–11. https://doi.org/10.1038/s41598-020-76685-z

National Institute of Drug Abuse. (2021). Overdose Death Rates. Retrieved May 13, 2021, from National Institute on Drug Abuse website: https://www.drugabuse.gov/drug-topics/trends-statistics/overdose-death-rates

Ohio Department of Health. (2020). 2019 Ohio Drug Overdose Data: General Findings. Retrieved from https://odh.ohio.gov/wps/wcm/connect/gov/0a7bdcd9-b8d5-4193-a1af-e711be4ef541/2019_OhioDrugOverdoseReport_Final_11.06.20.pdf?MOD=AJPERES&CONVERT_TO=url&CACHEID=ROOTWORKSPACE.Z18_M1HGGIK0N0JO00QO9DDDDM3000-0a7bdcd9-b8d5-4193-a1af-e711be4ef541-nmv3qSt

Diversity, Complexity, and Development of the Microbiome

The microbiome—the collection of microbes in a habitat or body—is currently an object of interdisciplinary excitement. In this view of microbes as the essential building blocks of life, ideas about disease are refigured. Dysbiosis names this new notion of disease as the dysregulation of microbial ecologies. The concept is Greek for difficult living, but taken in terms of microbial ecologies, dysbiosis refers to an overall dysregulated composition. The connection to the Anthropocene is explicit: loss of microbial diversity is about an epoch of planetary loss. Starting with the paleo Anthropocene, then the industrial revolution and ultimately the mid 20th century Great Acceleration, each of these periods demarcate disruptions that not only alter the external environment but also the (internal) human environment. Shaped by delivery methods, feeding practices, and antibiotic doses—development of the human gut microbiome is linked to its assembly at birth. After birth, environmental and social conditions continue to press upon its composition.


The microbiome is presented as a “post-racial” view of life that emphasizes plasticity over fixity and ecology over genes. This is considered post racial because it is not about differences between humans as species types. Rather microbiome research centers the nonhuman and difference as internal variability, which is presented as a disruption of anthropocentrism. Secondly, difference is not about inferiority but about improvement. Microbes aren’t just disease vectors or lower orders, they are the conditions of possibility for creating all forms of complexity. Difference and diversity is linked to increased fitness.

In turn, microbiome research presents itself as long removed from both the heydays of the racial pseudoscience of natural types—and the 20th century science of genetic reductionism. But, I argue the history of scientific racism is not reducible to ideas about the fixity of natural types, differences as inferiority, and anthropocentrism. Before the gene—the germ was posed as the material embodiment and reproductive force of life as models of evolution became accepted in mainstream Western science across the 19th century. It was with ideas about the germ–posed as the seed that developed into the whole organism, the tiny animal itself, and the tissues or cells that made up the body–that life not only became a distinct object of knowledge, but one which required intervention in order to improve inevitable trajectories away from degeneration. With ideas about reproduction at the scale of the generation, the germ linked aging and disease, as decline over the individual lifespan or developmental time, to civilizational decline or collapse, as evolutionary time.

Ideas about nature’s plasticity were linked to ideas about the relation between hybrid fertility and shared ‘missing’ origins, whereby the womb, or the reproductive capacities, of enslaved African American women, became the raw material for a cross-species understanding of the pliability of body-environment relations. By extending literature on the convergence of medical and agricultural notions of the germ in 19th century Europe—epitomized by Darwin—to the threat emancipation posed to the planter-physician dyad in America, I argue that ideas about nature’s plasticity were yoked to the racist anxiety and fetish over mulatto fertility. In the US, hybrid fertility was explicitly entangled with the reproduction of captive labor, which simultaneously were the means for improvement as capital accumulation for the national economy (and Southern politics) and the means for threatening the boundary of whiteness.

I argue it is precisely where many find excitement and hope – i.e. ideas about nature’s plasticity—that contemporary microbiome science continues to traffic in this eugenic relation between ideas of improvement and degeneration. Dysbiosis presents all difference as situated along a continuous spectrum of westernization. Here certain contemporary lifestyles are not just associated with increased microbial diversity but as such are posed as ancestral, a prelapsarian ideal stuck in time, a lost missing link. Recent scholarship has demonstrated this way race re-emerges in the idea of the “noble savage”. Deemed more “natural” and thus “vanishing,” scholars have critiqued how particular microbiomes figured as universal collective heritage become subject to bioprospecting projects.

Figure 1 Source: Gupta, Vinod et al. 2017. Geography, Ethnicity or Subsistence-Specific Variations in Human Microbiome Composition and Diversity. Frontiers in Microbiology.

I extend these critiques of microbiome science by also unpacking the racialized distinction that emerges between anxiety around the “degenerating” gut and the desiring subject of “regeneration” or the “rewilded” gut. This illustrates how race is also posed as an internal threat, as microbiome science focuses on the perils of “bad,” low socioeconomic status neighborhoods. The argument is that “the very same factors related to the total lived experience of socioeconomic disadvantage” are the “risk factors for dysbiosis” (Prescott & Logan). In this view, environmental crisis becomes an urban-industrial threat, as racialized neighborhoods disrupt microbial ecologies and threaten human extinction.

I link both biocentric fetishization of indigeneity as wilderness and the biocentric anxiety around the city and urban degeneration to the project of making whiteness universal. Dysbiosis, and the ideal of eubiosis, figures whiteness as the universal condition of the post-human, which is constituted by the awareness of being microbial ecologies all the way down. Here racial anxiety about the perils of westernization and the desire to become the non-Western Other are given scientific legitimacy in the form of microbial plasticity. This recapitulates the universal subject of whiteness, not through externalization of the racially marked other but through regulating internalization as either degenerative or as improving. I argue this scientific legitimacy is a form of biocentrism, which grounds notions of civilizational advancement in nature itself.

Figure 2 Source: Dominguez-Bello, Maria, Knight, Rob, Gilbert, Jack and Martin Blaser. 2018. Preserving microbial diversity. Science.


Ariel Rawson, PhD Candidate

Department of Geography

The Ohio State University

Agricultural Risks to Changing Snowmelt

Snowpacks store cold water in winter, which is later melted in warmer spring months to produce streamflow. Historically, irrigated agriculture has relied on snowmelt runoff as an important seasonal water supply in many regions across the world, such as the western United States.

However, Climate change has already begun to change the spatial and temporal patterns of snowmelt runoff — causing a decreasing magnitude of snowfall and earlier melting of snowpacks. Consequently, irrigated agriculture, which has been depending on snowmelt runoff happening with a certain magnitude, at a specific time, and in a given location, are exposed to potentially important risks under a warming climate.

Although such changes in snowmelt-derived water resources are often cited as a key threat to irrigated agriculture and global food security, previous studies have focused on annual changes in runoff, without resolving the sub-annual changes in water supply and crop-specific water demand.

To characterize such risks, we differentiate surface water supply from three sources: snowmelt runoff, rainfall runoff, and alternative water supply such as inter-basin water transfer. Comparing monthly surface water supply with surface water demand under both the historical climate (1985-2015) and predicted warming scenarios (2°C and 4°C above pre-industrial conditions), we identify where irrigated agriculture has been mostly depending on snowmelt runoff in the past 30 years. Also, we find basins in high-mountain Asia (the Tibetan Plateau), central Asia, central Russia, the western U.S., and the southern Andes are particularly vulnerable to decreasing snowmelt availability in crops’ growing seasons due to a future warming climate.

Therefore, these most risky basins will require increasing additional water supplies by increasing inter-basin transfer, pumping additional groundwater, or consuming water required for other uses. Notably, providing those additional water supplies may sometimes cause additional environmental and social problems, thus improved irrigation practices or crop switching may be needed to ensure food security under changing snowmelt.

Yue Qin

Assistant Professor, Department of Geography

The Ohio State University

Uncertainty Problems and Census Data: The 2020 Census & Exurbanization Example

Last year, I had opportunities to learn about the 2020 Census from a research seminar and a professional meeting to promote Complete Count of the 2020 Census. As you may have heard already, there are some new characteristics in the 2020 Census as below (U.S. Census Bureau, n.d.-a, n.d.-c, n.d.-b):

  • The 2020 Census will be the first to offer options for internet and phone responses.
  • There will be a greater reliance on technology to prepare for and execute the count.
  • The 2020 Census will update its Master Address File (MAF) and ensure that every living quarter in the U.S. is included in the census universe by collaborating with state and local governments and using aerial imaging software.
  • For enhanced enumeration, Census takers will be equipped with smart devices, and data will be collected digitally in real-time.
  • There are no questions about citizenship on the 2020 Census.
  • Responses for the Census will never be shared with agencies of immigration or law enforcement.
  • The country is experiencing a period of heightened fear and deliberate misinformation.

Potential Uncertainty in the 2020 Census

Most of the characteristics above seem to be helpful to produce more accurate Census data. On the other hand, there might be some potential uncertainty in the 2020 Census data. First, there are some challenges to being counted on the Census data, including language barriers, mistrust in government, privacy/cybersecurity concerns, physical barriers such as inaccessible multifamily units, untraditional living arrangements, and lack of reliable broadband or internet access. Second, there may exist hard-to-count (HTC) groups for the Census, including children under five years old, racial and ethnic minorities, limited English proficiency households, immigrants, renters and residents who often move, alternative or overcrowded housing units, gated communities and publicly inaccessible multifamily units, persons displaced by natural disasters, persons experiencing homelessness, young mobile adults, and single-parent headed households (The City of Stillwater, Payne County, OK, n.d.). Thus, the 2020 Census may provide enhanced accuracy of the data and also uncertain data for some criteria of the Census.

Example of Uncertainty in Visualizing Exurbanization

Due to the potential uncertainty in the Census data, some geographic inquiries that utilize the Census data may reveal the uncertainty problems, such as visualizing the location of exurban areas. Simply speaking, the exurban areas have characteristics between urban and suburban areas. There are multiple different definitions of exurbanization in literature, and the location of certain exurban areas on maps may vary depending on the definition (Ban & Ahlqvist, 2009). In specific, you can visualize the exurbanization of certain areas by using the Census data, geospatial data, and fuzzy-set approach (Ban & Ahlqvist, 2009; Fisher, 2000; Wechsler et al., 2019; Zadeh, 1965), and could create a map that represents different degrees of exurbanization (Figure 1). In Figure 1, the degree of exurbanization of Los Angeles County, CA is visualized based on the definition of exurbanization in (Daniels, 1999). According to Daniels (1999), the exurban areas are defined using value ranges of some attributes, including population, distance from a major urban center, commuting distance, and population density. The definitions of Daniels (1999) themselves include semantic uncertainty due to the vagueness and the ambiguity (see Ban & Ahlqvist (2009) for details). However, in this blog, we will focus on the population attribute of the exurbanization definition. As mentioned above, the potential uncertainty in 2020 Census data may introduce another type of uncertainty, the error (Fisher, 2000). Most of the definitions of exurbanization use the population attribute (Berube et al., 2006). It is likely that the results of the visualization of exurbanization may present uncertainty in the locations of exurban areas.

Figure 1. Visualization of the degree of exurbanization of Los Angeles County, CA based on the exurban definition from Daniels (1999). (A) shows boundaries of exurban areas in crisp, non-fuzzy membership and (b) in the fuzzy-set membership (reproduced from Figure 16.5 of Wechsler et al. (2019)).

There would exist other geographical inquiries that might introduce uncertainty when dealt with the 2020 Census data. What would be the examples? Then how could the uncertainty problems be resolved? Things to ponder remains, and indeed, the initial process of thinking could be definitely uncertain.


References

  1. Ban, H., & Ahlqvist, O. (2009). Representing and negotiating uncertain geospatial concepts – Where are the exurban areas? Computers, Environment and Urban Systems, 33(4), 233–246. https://doi.org/10.1016/j.compenvurbsys.2008.10.001
  2. Berube, A., Singer, A., Wilson, J. H., & Frey, W. H. (2006). Finding Exurbia: America’s Fast-Growing Communities at the Metropolitan Fringe. 48.
  3. Daniels, T. (1999). When City and Country Collide: Managing Growth In The Metropolitan Fringe. Island Press.
  4. Fisher, P. (2000). Sorites paradox and vague geographies. Fuzzy Sets and Systems, 113(1), 7–18. https://doi.org/10.1016/S0165-0114(99)00009-3
  5. The City of Stillwater, Payne County, OK. (n.d.). Historically Hard to Count Populations. Retrieved November 30, 2020, from http://www.paynecountycensus.org/page/home/your-community-s-info/historically-hard-to-count-populations
  6. US Census Bureau. (n.d.-a). About the 2020 Census. The United States Census Bureau. Retrieved November 30, 2020, from https://www.census.gov/programs-surveys/decennial-census/2020-census/about.html
  7. US Census Bureau. (n.d.-b). Census.gov. Census.Gov. Retrieved November 30, 2020, from https://www.census.gov/en.html
  8. US Census Bureau. (n.d.-c). What Is the 2020 Census? 2020Census.Gov. Retrieved November 30, 2020, from https://2020census.gov/en/what-is-2020-census.html
  9. Wechsler, S., Ban, H., & Li, L. (2019). The Pervasive Challenge of Error and Uncertainty in Geospatial Data: Volume Eight (pp. 315–332). https://doi.org/10.1007/978-3-030-04750-4_16
  10. Zadeh, L. A. (1965). Information and control. 8(3), 338–353.

Hyowon Ban

Class of 2009, Associate Professor

Department of Geography

California State University, Long Beach


Locating the Rural Forested Community; Aka When Bugs Bunny Saved the Day

In 2012, about a dozen people began meeting at the Socio-environmental Synthesis Center (or SEYSNC) in Annapolis, MD, as part of a new project: Rural Forest Communities at a Tipping Point? Trends & Actionable Research Opportunities. We were a group of researchers spanning the social and environmental sciences from Virginia, Maine, Oregon, Ohio, Wisconsin, Quebec, and elsewhere, and we were interested in a seemingly straightforward, yet in practice elusive, concept of the rural forested community. We knew from the work we conducted in forested regions of the US and Canada that these areas had experienced dramatic employment shifts, out of extractive industries like timber or mining, manufacturing jobs in textile mills, and other activities that had previously made more intensive use of the land.

We were particularly interested in forested ecosystems that had experienced some regrowth and restoration of a variety of plant and animal species, and understanding how loss of traditional industries, burgeoning new industries like tourism, “green” manufacturing, or call centers seeking cheaper land and labor costs, were intersecting with new demographic trends, like exurban or second-home migrants.

We wanted to know which rural forested communities were able to offset job losses as traditional industries waned, while managing new threats to forests in the form of parcelization and forest fragmentation, climate change, coordination of forest management, invasive species and pests, among other factors. We had big questions we wanted to answer: if rural community and forestry futures were intertwined, in what ways were communities working to maintain or enhance these joint prospects? Were certain types of economic strategies (pursuing tourism over manufacturing) better or worse for the community or the forest? Our collective experience in studying small field sites across North America, and our transdisciplinary orientation, was to provide a rich foundation for answering these questions.

What follows is a story about data. Well, it’s really about teamwork, interdisciplinarity, measurement, accuracy versus precision, and how cartoons once came to our proverbial rescue.

Lesson 1: Collaboratively define a research object

We had assembled an intrepid disciplinary team of around a dozen ecologists, remote sensing specialists, environmental economists, rural sociologists, and geographers, among others. We all agreed in principle about the threats to rural forested communities in North America, and eagerly discussed similarities and differences among our regions. However, when it came down to specifying exactly what the defining characteristics of rural forested communities might be, and what data we would use to identify them spatially (what is rural? What is a forest? What is a community??), we were in trouble.

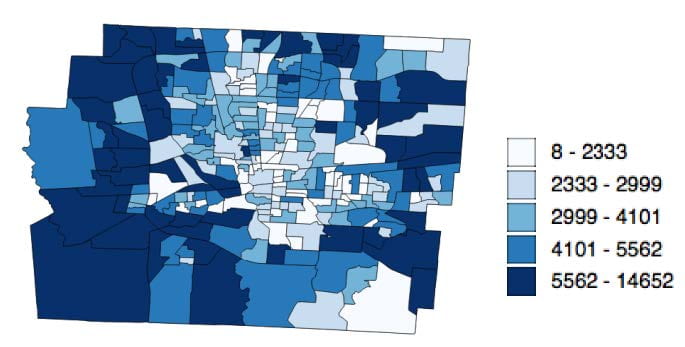
Figure 1: Locating the rural forested counties of the U.S. (Bell et al. 2019).

We argued that the word “community” means something specific in ecology, yet remains vague or contradictory across the social sciences. We argued that the Census counts record someone’s residence, not their place of work, and commuting relationships vary regionally and across the urban-rural continuum. How do we precisely map which forest is used by which people? How much vegetation cover should there be to define a forest, in such an ecologically diverse place as the continental U.S., even? There is no clear geographic definition of what constitutes a rural forested community. But we needed to operationalize data – census data on population, economic census data on employment and occupation, land-cover datasets for information on forest extent, etc.

People are mobile and drive for miles to harvest or hike in wooded areas. Trees are stationary, yet their benefits to people and animals extend beyond the boundaries of the forest. There will always be a spatial mismatch (Bell 2005) in assimilating data from ecological and social systems, and we were likely to underbound (leave out areas that fit our conceptual understanding of these places) or overbound (include areas that didn’t really fit with what we want to study) our identification of actual rural forested communities.

The more we discussed how we were going to measure this idea we had, this concept that we knew existed in the “real world,” the more we began to struggle. We began to brainstorm terms that might capture the idea. Of course, being scientists, we wanted clever acronyms for those terms.

The suggestion came up to identify a placeholder, such as a name or object that would be easy to remember, to communicate effectively until we figured out exactly what we wanted to call this phenomenon. Voices got louder. The tone got more heated. Scribbles were madly filling up the white board. We were at an impasse. I sat back, observing some of the chaos.

“George!”, I said, “Why don’t we just call it George!”

A dozen heads snapped around to look quizzically at me. I had just thought about the Abominable Snowman in Bugs Bunny. When Bugs misses that left turn at Albuquerque and ends up in the Himalayas (neocolonial problems with this representation aside), the Snowman picks him up as a pet, and says, “My own little bunny rabbit, I will hug him and squeeze him, and name him George.”

So we agreed to use the placeholder George, to stand in for this concept that we could all imagine but could not agree how to measure, so that we could move on to develop our larger conceptual framework, and all the factors we wanted to consider (Morzillo et al. 2015, van Berkel et al. 2018): roads, governing institutions, ecological conditions, political economy, etc. We got a lot of mileage out of simply invoking the name George, over and over and over.

Lesson 2: Know when to “lump” and when to “split”

Ultimately, we realized that our big group had substantive tensions in focus. The ecologists, broadly, were most interested in forest resources in situ, focusing more directly on the people, and the houses, that were in the midst of or on the edge of those forests. The social scientists on the other hand, were most interested in the function of the community rather than individual plots of land: how were local institutions navigating big structural economic changes, and how were community strategies for development differentially experienced by residents?

Eventually, we broke the puzzle into two pieces – understanding the extent, spatial patterns and regional variations across these forested regions (van Berkel et al. 2018), and hypothesizing how differing local characteristics correspond with trajectories of change (decline, tourism, new types of production) (Morzillo et al. 2015).

There is a literature about “lumpers vs. splitters” (Endersby 2009); i.e., whether scientists tend to be more comfortable with broad generalization, or whether more specificity, and more categories or exemplars, are necessary to capture finer-scale variation. I have been in several interdisciplinary teams in my 20-year career, and have experienced this phenomenon multiple times. What’s most interesting to me as a researcher and teacher is that no perfect theory and no perfect dataset can ever solve this conundrum. It is fundamentally a social one, that requires interpersonal communication and understanding. And, like all good inquiry, it depends on the research question.

Lesson 3: Specialize as needed

Ultimately, our SESYNC group, which was assembled from several existing projects, tag-teamed the two foci: alternatively, looking at settlements within forested pixels (van Berkel et al. 2018), versus forests within 100 miles of communities (Munroe 2019).

A somewhat smaller plucky band: the rural sociologist, the human dimensions expert, the two most open-minded economists I have ever known, and myself, have continued to forge ahead. This subset, when we received funding from the USDA National Institute of Food and Agriculture, continued to refine our definition of rural forested communities, a region we now refer to as Eunice.

Figure 2: The (smaller) interdisciplinary team in Logan, Ohio. Photo Credit: Kymber Anderson

What were the lessons of this experience? Well, anyone can claim to be a quarterback on Monday morning, so take these as intended. What I personally learned is the following:

  • Don’t shy away from tough conversations. It’s not impolite to disagree about concepts or data.
  • Focus on what you can agree on, and what you can’t.
  • Be willing to change, follow the inspiration of the moment.
  • Be generous ex post (you’ll note we were generous with coauthorship).

In the endnotes of our first published paper, we have an acknowledgement to “George.”


Acknowledgements

I’d like to thank my close group of collaborators, Kathleen Bell, Chris Colocousis, Mindy Crandall, Anita Morzillo and the rest of the SEYSNC team, past and present. All errors herein are my own.

Darla Munroe

Professor & Chair

Department of Geography

The Ohio State University


Links

http://www.sesync.org/

https://www.sesync.org/rural-forest-communities-tipping-point-trends-and-actionable-research-opportunities

https://portal.nifa.usda.gov/web/crisprojectpages/1009211-biodiversity-ecosystem-services-and-the-socioeconomic-sustainability-of-rural-forest-based-communities.html

https://en.wikipedia.org/wiki/Hugo_the_Abominable_Snowman

References

  • Bell, K. P. (2005). Spatial analysis and applied land use research. Land Use Problems and Conflicts, 118.
  • Bell, Kathleen P., Mindy Crandall, Darla K. Munroe, Anita Morzillo, & Chris Colocousis (2019). Rural forested landscapes, economic change, and rural development. 2019 North American Meetings of RSAI, Pittsburgh, PA. 15 November.
  • Endersby, J. (2009). Lumpers and splitters: Darwin, Hooker, and the search for order. science, 326(5959), 1496-1499. DOI: 10.1126/science.1165915
  • Fry, J. A., Xian, G., Jin, S. M., Dewitz, J. A., Homer, C. G., Yang, L. M., … & Wickham, J. D. (2011). Completion of the 2006 national land cover database for the conterminous United States. PE&RS, Photogrammetric Engineering & Remote Sensing, 77(9), 858-864.
  • Munroe, D. K., Crandall, M. S., Colocousis, C., Bell, K. P., & Morzillo, A. T. (2019). Reciprocal relationships between forest management and regional landscape structures: applying concepts from land system science to private forest management. Journal of Land Use Science, 14(2), 155-172. https://doi.org/10.1080/1747423X.2019.1607914
  • Morzillo, A. T., Colocousis, C. R., Munroe, D. K., Bell, K. P., Martinuzzi, S., Van Berkel, D. B., … & McGill, B. (2015). “Communities in the middle”: Interactions between drivers of change and place-based characteristics in rural forest-based communities. Journal of Rural Studies, 42, 79-90. https://doi.org/10.1016/j.jrurstud.2015.09.007
  • SEDAC, & US census Bureau (2000). Census block data on poverty, housing stock, education and key demographic. Retrieved from: http://sedac.ciesin.columbia.edu/.
  • Van Berkel, D. B., Rayfield, B., Martinuzzi, S., Lechowicz, M. J., White, E., Bell, K. P., … & Parmentier, B. (2018). Recognizing the ‘sparsely settled forest’: Multi-decade socioecological change dynamics and community exemplars. Landscape and Urban Planning, 170, 177-186. https://doi.org/10.1016/j.landurbplan.2017.10.009

The 2020 U.S. Census and Indigenous peoples

The 2020 Census is in full swing in the United States. By the end of the Census in December, virtually every American citizen will have been asked to provide information to the Census—whether it is via the traditional forms we receive in the mail, via telephone, or online. Americans are consistently reminded of the importance of the Census—besides providing a more accurate count of the population of the country, its states, and the many counties/parishes/boroughs, cities, towns, villages that comprise each state, it has economic and political ramifications. According to the U.S. Census Bureau, Federal funding is guided by population shifts, states can gain or lose Congressional representation based on their new populations, and local governmental units draw boundaries or allocate resources based on information gathered in the Census. If those reasons aren’t enough, we also are faced with the ‘threat’ of a Census enumerator coming to our front doors to collect the information, or in some cases, a $100 fine. Clearly, it is important for Americans to do the Census.

However, for one group of Americans, the Census both carries deeper historical and contemporary significance. For the over 570+ Federally recognized tribes (including Alaskan Native tribes) in the United States, information from the Census helps influence Federal funding for tribally-focused programs, as well as allowing tribes to make local planning decisions for tribal programs and services. However, Federal counting of Indigenous peoples in the United States has a very fraught history that is linked with colonialism and dispossession of tribal lands and political power. For example, tribal ‘rolls’ were routinely used from the late 19th century to count members of tribes and determine their blood quantum, deeming them worthy or unworthy of allotments and/or tribal citizenship. Federal policies such as relocation/termination and sending Indigenous children to boarding schools have created a legacy where many tribal members do not trust the Federal government or its initiatives, making it very difficult to secure Indigenous buy-in to the Census, as Kirsten Carlson writes.

Even when Indigenous people have participated in the Census, there has been notorious undercounting of Indigenous tribes and individuals; according to this report by the National Congress of American Indians, the percentage of Indigenous people that have been undercounting has ranged anywhere from 4.9% (in the 2010 Census) to 12.2% (in the 1990 Census). The same report echoes the relative mistrust in Indigenous communities as to the purposes and benefits of doing the Census. The rise of the COVID-19 pandemic in the United State also represents a barrier to participation, as does technological barriers that are often present on reservations (lack of Internet access, etc.) and the fact that the Census Form is not offered in tribal languages. Of course, there is also the fact that the Federal definition of who is an ‘American Indian’ or ‘Alaska Native’ does not always matchup with tribal or individual definitions of Indigeneity (see Liebler, 2018 for a more detailed explanation).

With clear political and economic ramifications at stake, and in an effort to counteract the problematic history of counting Indigenous people, the U.S. Census Bureau has undertaken a massive effort to attempt to solicit as much participation in the 2020 Census by Indigenous peoples in the United States as possible. One way that this has occurred is through an increase in the dissemination of information related to what the Census is, and what it means for Indigenous communities in the United States. A wide variety of press releases, handouts and multimedia have been made available for tribal governments and tribal citizens to learn more about the Census, including articles, brochures, podcasts, sample invitation letters, and even videos that explain more about the Census enumeration process. A press kit provides additional information, including a really great blog post from the Director of the U.S. Census Bureau, that talks specifically about the importance of the Census for Indigenous people, with a particular focus on Alaskan Natives.

However, the Census Bureau is not the only ones that are working hard to ensure an accurate count of Indigenous people in 2020. Indigenous people themselves have taken many steps in order to get the word out in their own communities to explain the importance of participating in the 2020 Census. Much of this work occurs at a national level, such as via the U.S. Indigenous Data Sovereignty Network, founded by Northern Cheyenne tribal member and all-around Indigenous badass Dr. Desi Rodriguez-Lonebear. But, there is also a lot of work that happens at a local level. Tribes such as the Pullayup Tribe in Washington, the Navajo Nation, and many others have not only built relationships with the U.S. Census Bureau, but they are also taking their own actions to help drive up participation. Tribal nations have sought to overcome mistrust regarding the Census is by involving Indigenous people in the collection process. My own tribe, the Leech Lake Band of Ojibwe sent out a call earlier this year for Census takers, for example:

Leech Lake Band of Ojibwe Posting

It is clear that tribal nations understand the importance of the Census to their communities, and to holding the Federal government accountable to its obligations to tribes as part of the nation-to-nation framework that characterizes the relationship between Indigenous nations and the United States. Through cooperation between tribes and the Census Bureau, as well as steps that tribes are taking themselves, the process of including Indigenous people in the Census will hopefully improve, allowing for the conditions necessary for Indigenous nations to receive the support and services they need.

Deondre Smiles (Ph.D., 2020, OSU Geography)

President’s Postdoctoral Scholar

Department of History

The Ohio State University

Census Data: A Personal Note on Some Challenges and Successes

The census data we use today is a symbol of American democracy. The U.S. Constitution states that “the actual enumeration shall be made … within every subsequent term of ten years, in such manner as they shall by Law direct” (Article 1, Section 2). After this historical point, the census has a brand new meaning beyond the mere means for the royalty or state to make their economic or political gains. Today, U.S. census data are commonly used for mapping and many other purposes. It is literally the textbook example of spatial data and applications in GIS and cartography education. Indeed, the U.S. census has empowered individuals and organizations around the world. A few simple clicks on an interactive map shown below, for example, will reveal some stunning pattern of spatial dynamics across America, even at a county level.

Map to explore census data of U.S. Counties

An interactive map to explore census data of U.S. counties.

However, as useful and powerful as the census data are, shortcomings and challenges are also noticeable. Let’s start from a spatial perspective and ask ourselves this question: are census data safe? The following map comes from the dark side of using census data. It was made by Nazi Germany circa 1940, before the U.S. formally entered the Second World War. This map details the first and second generation of middle and western Europe immigrants in the United States, based on the publicly available data from the 1930 U.S. Census. It also has a label at the top left corner that reads “For official use only!” Its cartographic achievement aside, this map was used by the Nazi propaganda machine to strategically spend their war money to persuade the public opinion in the U.S. to avoid being involved in the war raging in Europe. Many believed such a campaign was successful to some extent. It is safe to say that, ever since then, the use of the census data and maps in today’s affairs, from political campaigns to social media disinformation to foreign meddling of our elections, is everything but the lack of imagination.

“20th Century Through Maps” Courtesy of British Library (permission pending)

The arguably darkest moment of the U.S. census also came in the Second World War, when the census information used by the U.S. government directly led to the internment of Japanese Americans after the Pearl Harbor attack. So is it really provocative to ask will the census data, mapped or not, put us in danger? Will history repeat itself in the 21st century? Will another ethnic group become the victims? While the 2020 census eventually did not include citizenship questions, it should not be the time to celebrate. Instead, we should ask will such questions ever come back, and in what form? These issues may be beyond the scope of the census, but the census has been the vehicle that carries these issues.

Also from the spatial perspective, it is well known that census geographies are designed in a hierarchical fashion where the blocks are the smallest spatial units and from there we can aggregate to units such as block groups, tracts, and counties. Census tracts have been considered to be the relatively stable units for statistical analysis because by design they aim to have an ideal population of 4,000. But why should space be delineated in such a fixed and perhaps artificial way? What if we can re-arrange the blocks and come up with different kind of units that are compatible with the official tracts? This is a notoriously difficult task because there are an astronomical amount of ways to recombine the blocks. But if we test some algorithms on a manageable number of units, we can see how the world can be different. The two figures below show the result of such an exercise. It is clear that we can actually achieve a better set of spatial units where the population is more evenly distributed and more centered around the ideal size. Also, the new aggregated units show no significant spatial auto-correlation, which makes them more suitable for statistical analysis.

Visual representation of Population of the 284 census tracts in Franklin County, Ohio.

Population of the 284 census tracts in Franklin County, Ohio.

Visual representation of Population of the 284 new units that are aggregated using the 887 census block groups in Franklin County, Ohio.

Population of the 284 new units that are aggregated using the 887 census block groups in Franklin County, Ohio.

Issues related to spatial units are not new and have been around in statistics and geography for at least more than a half century. Computational advances have made it possible to explore new and different approaches to spatial organization. The question is: how can we embrace such a new way of thinking about these statistical units? Should we even go down this rabbit hole where things will become constantly changing.

We can certainly read the history of the use of census data through different lenses. But, however we read it, we will find both bright and dark sides that are full of conflicts, betrayal, conspiracy, struggle, and promises. The world envies the richness of the census data available in the United States that dates back to the beginning days. From this perspective, I personally do see more promises than anything else, as the new century should be the time for us, the research community as well as the general public, to re-imagine what the census data could be.


Ningchuan Xiao, Professor

Department of Geography

The Ohio State University

Fieldwork in a 250 sq ft Studio

One of the sampling methods commonly used in fieldwork is the snowballing technique. The method is to recruit the next research participants by asking current participants to help researchers in identifying potential participants, which is a kind of referral system. I took advantage of the method in my preliminary fieldwork last year. My generous interviewees gladly introduced me to someone they knew and sometimes took me directly if it was not far away from their places. Yet, COVID-19 changed everything.

The goal of my fieldwork this summer was to compare the two largest strawberry production regions in South Korea. I was supposed to participate in farm conferences and local education programs to recruit farmers for interviews and then apply the snowballing technique. However, most of those gatherings were canceled due to the virus. Even if there were meetings, they were held behind closed doors. I had no choice but to conduct “un-immersive fieldwork,” relying on cold calling from my rented studio in Seoul.

Three strategies that got me through this challenge were calling organizations’ representatives, virtual snowballing, and random calls.

Calling organizations’ representatives: There are several farmers’ organizations in the Korean strawberry sector (i.e., cooperatives, agricultural corporations, and strawberry research groups). The contact information for the organizations’ representatives is often posted on the government’s website, making it easy to make contact. Also, the representatives are usually more likely to be extroverted. If things went well, an interviewee was interviewed by phone while they were driving long distances, enabling in-depth interviews to take place over one to two hours. In the worst-case scenario, however, the interviewee was not able to answer questions properly, because they were on their way to visit a hospital or bank. One-third of the potential interviewees declined to be interviewed, refusing in the same manner as they would with spam calls. They said, “I don’t do such a thing. Sorry.”

Virtual snowballing: At the end of every telephone interview, I asked interviewees to introduce me to another close farmer. They were a little reluctant to introduce another farmer than I expected, and said, “Other farmers will say the same anyway.” This was in contrast to the welcome introduction of the surrounding farmers during the in-person visits last year. Meanwhile, experts (researchers, technicians, etc.) and government officials whom I met in person last year gladly introduced farmers they knew this year. I guess people become willing to introduce me to other people when they are sure that an interviewer is reliable and the introduction will not harm their reputations.

Random calls: I tried random calls to various farmers through a Google search. Usually, farmers who left their contact information on the Internet were selling agricultural machinery and fertilizers or running pick-your-own strawberry farms in addition to farming, and most of them willingly accepted the interview request. They answered my questions as comfortably as they treated their customers. I also posted a promotional post on the web communities for strawberry farmers, hoping to coax the farmers to call me. Despite the offer of compensation, only a small number of farmers contacted me. Interestingly, they had something in common in that they felt sorry for Ph.D. students because they or their children had graduate school experience.

In the COVID-19 era, while many people are getting used to new technologies such as Zoom, there remain difficulties in applying these technologies to fieldwork. The use of video calls or online messaging platforms was almost impossible, especially since farmers are of high average age and are usually conservative. Nevertheless, there must be huge room for improvement: a more friendly way of phone calls, writing an attractive promotional post, and many more creative methods. We keep learning how to adapt to uncertainties by doing everything in the virtual field.

As mentioned, there is always room for improvement, and I welcome new ideas. Please feel free to contact me if you have any suggestion for my virtual fieldwork!


Sohyun Park, PhD Candidate

Department of Geography

The Ohio State University