Sustainability in a World of Cities

The 21st century witnessed an epochal event in human civilization: in 2008, the world became majority urban for the first time in history. Urbanization is accelerating: two-thirds of the global population will live in cities by 2030. Some scholars are projecting an essentially urban planet by the end of the century, with 90% of the world population crowded into urban areas.  A world of 10 billion people living predominantly in cities— of which 60% globally have yet to be built —underscores the critical need and immense opportunity for new scientific and policy approaches that can achieve sustainable urban systems.

graphic to demonstrate CMAX Bus service after 6pm

Figure 1: Locations reachable at 6pm on a typical weekday from the Linden neighborhood of Columbus by public transit and walking after new CMax bus rapid transit service. Graphic courtesy of Harvey Miller

Mobility is central to urbanity: transportation is how we organize our cities. While the personal automobile has generated stunning levels of travel and activity over the past century, it has also led to urban transportation systems being inefficient, costly, inequitable, unsafe and unhealthy, and damage environments at local to global scales.  This is leading to a mobility crisis that will get worse as the world continues to urbanize.

In many cities, we are seeing the deployment of new technology-enabled mobility services such as vehicle sharing, hailing services, and micromobility such as scooters and bikeshare systems. These innovations are disrupting the mobility landscape of cities, with even larger disruptions inevitable with the coming of connected autonomous vehicles.  While these hold promise, they also may make an unsustainable situation even worse.

Are New Mobility Technologies Sustainable?

Introducing disruptive mobility technologies to cities is a large-scale, real-world experiment that will impact cities for decades. The outcomes of these mobility disruptions have profound implications for urban air quality, social equity, energy consumption, greenhouse gas emissions, safety and health.  So far, the evidence is mixed. For example, some evidence suggest that Lyft and Uber are reducing drunk and impaired driving (although possibly at the expense of heavier drinking).  However, these services are also increasing traffic congestion, undermining public transit and leading to higher energy consumption and emissions.
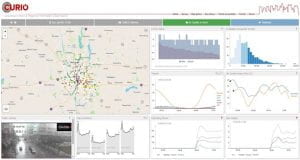
graphic example of data dashboards from available data

Figure 2: The Columbus Urban and Regional Information Observatory (CURIO) – a geospatial data dashboard for Columbus, Ohio. Graphic courtesy of Harvey Miller

Whether new mobility services will make cities more sustainable is an open question, one that will be difficult to answer using 20th century urban scientific and management approaches.  In the past we have relied on simple data and measures that could be easily collected.  For example, automobile traffic counts have been easy to collect: consequently our main transportation performance measure is how many vehicles we can shove through a network.  Our simple, 20th century models also treat mobility as undifferentiated flow, like water – consequently, we made traffic congestion worse by trying to build bigger “pipes” because of a phenomenon known as induced demand.

In the 21st century, we need transportation measures and analytics that:

  • i) focus on people and their activities, not vehicles and their movements;
  • ii) recognize the heterogeneity of peoples’ needs and capabilities with respect to mobility and accessibility, and;
  • iii) capture the full cost of transportation, especially externalities such as emissions, noise, risk and other social and environmental impacts.

New Geospatial Technologies and Sustainable Mobility Science

New sources of data are emerging that could enable some of this system science. Location-aware technologies such as mobile phones and global position system (GPS) receivers, environmental sensors, social media and smart technologies are generating data at unprecedented volumes and spatio-temporal resolution, facilitating new insights into mobility patterns and urban dynamics.  The cost of data storage has plummeted, allowing these data to be saved and archived over time.  Advances in machine learning, geospatial data mining, geovisualization and other knowledge discovery techniques are helping specialized and siloed practitioners work together to make sense of this data avalanche.  Cloud computing, geospatial data portals, application-programming interfaces and data dashboards allow scientists to share these data and information widely with the public. These new technologies are creating a new kind of data-enabled and computation-rich mobility science that can lead to more nuanced, appropriate and sustainable solutions to our growing urban mobility crisis.

Harvey Miller

Bob and Mary Reusche Chair in Geographic Information Science

Professor of Geography

Director, Center for Urban and Regional Analysis (CURA)


Some of the geospatial data-enabled sustainable mobility research projects conducted in the OSU Department of Geography and the Center for Urban and Regional Analysis (CURA) include:


Climate Change: The Largest Challenge Facing Humanity

This year we celebrate the 50th anniversary of Earth Day. Climate change is one of the biggest challenges facing humanity and so the theme for Earth Day 2020 is climate action. There are many ways that individuals and organizations can take climate action. As a climatologist in the Department of Geography at The Ohio State University, one of the ways that I am taking action is through helping to assemble, quality control, harmonize and disseminate high-quality climate observations. These data are essential for monitoring and detecting climate variability and climate change. Since 2010, I have been involved in developing the most comprehensive soil moisture database in the United States. With funding from the National Science Foundation, USDA and NOAA, we developed nationalsoilmoisture.com. The map shown below indicates the locations where soil moisture measurements are currently being made in the United States. Data from many of these sites are being provided in near-real-time on nationalsoilmoisture.com. This includes in situ measurements of soil moisture, satellite-derived soil moisture from NASA SMAP and model-derived soil moisture from NLDAS-2.

Figure 1. Locations of in situ soil moisture sensor networks across the United States from federal- and state-level networks. Credit: nationalsoilmoisture.com.

These data fill a critical gap because unlike for other climatological and hydrological variables, there are no national databases for soil moisture. The 2008 report on “Future Climate Change Research and Observations: GCOS, WCRP and IGBP Learning from the IPCC Fourth Assessment Report” (WMO/TD No. 1418) recommended that soil moisture data should be assembled because of its importance for:

(1) improving our understanding of land-atmosphere interactions,

(2) developing seasonal to decadal climate forecasting tools,

(3) calibrating, validating and improving the physical parameterizations in regional and global land surface models (LSM),

(4) developing and validating satellite-derived soil moisture algorithms, and

(5) monitoring and detecting climate variability and change in this key hydrological variable.


Why is soil moisture important?

As we noted in Legates et al. (2011), “soil moisture is not just a process that is integral to climate, geomorphology, and biogeography – it truly lies at the intersection of all three branches of physical geography. A complete understanding of soil moisture and its spatial and temporal variability and impact draws upon interactions among and expertise gained from all three subdivisions. Soil moisture lies at the intersection of climatology, geomorphology, biogeography, and hydrology, thereby providing true integration of the subdisciplines rather than just supplying a common theme.” Soil moisture influences the exchange of energy and water between the land surface and atmosphere. Soil moisture controls the partitioning of rainfall into runoff and infiltration. It modulates vegetation growth and photosynthesis. It also influences mass movements, weathering, erosion and sediment transport. Therefore, soil moisture is a key climatological and hydrological variable. However, compared to precipitation and temperature, there are very few soil moisture measurements.


Current Efforts to Develop a National Soil Moisture Network

Significant progress is being made in the United States to address the critical gaps in soil moisture observations. As a member of the National Soil Moisture Network Executive Committee, I helped to draft “A Strategy for the National Soil Moisture Network: Coordinated, High-Quality, Nationwide, Soil Moisture Information for the Public Good” that was released in February 2020. This Strategy Document was called for in the National Integrated Drought Information System (NIDIS) Reauthorization of 2018. It is intended to review the current status of soil moisture monitoring and reporting in the U.S., and to develop a strategy for a national coordinated soil moisture monitoring network, involving federal agencies, regional and state mesonets, data providers, researchers, user groups, and others. The strategy document identifies ten recommendations for how to implement a National Soil Moisture Network. The goal of this effort is to provide a unifying structure to enhance monitoring activities, establish partnerships for building out the network, develop an organizational structure that will collect, integrate and deliver transformative soil moisture products to the nation. This one tangible way that the Department of Geography at Ohio State is actively involved in climate change research. This effort provides better data for assessing how the climate is changing and to increase the resilience of the United States to these changes.


Dr. Steven Quiring,

Department of Geography

The Ohio State University

The Environmental Protection Agency at Fifty: Promoting Deregulatory Science

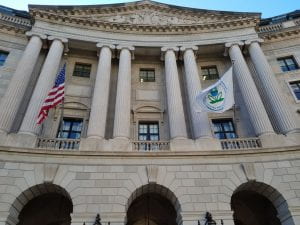
photo of EPA headquarters

EPA Headquarters in Washington, DC. Photo Courtesy of Becky Mansfield

Established in the wake of the first Earth Day, the Environmental Protection Agency is also 50 this year. Today, the agency appears regularly in the news as a poster-child for President Trump’s regulatory rollbacks. I have researched the EPA for over a decade, including following the Trump EPA with fascination. What have I learned?

I have learned that when EPA takes its mission seriously, it makes progress protecting environmental and human health. Notable successes include reducing smog, acid rain, and lead exposure, and banning many dangerous pesticides [1].

Yet I have also learned that, not only are these issues ongoing, but EPA tends to downplay chemical harms, even in the wake of an avalanche of scientific findings and public awareness of the enormity of environmental change and long-term, cumulative health effects for humans and wildlife. EPA has always used a less-protective, risk-based approach that insists on certainty about harms before taking protective measures. Throughout its history, EPA has been influenced by corporate science-for-hire that highlights and even purposefully produces scientific uncertainty [2]. Also, EPA has not been good at addressing disproportionate harms. For example, my research showed that EPA’s approach to controlling exposure to the neurotoxin mercury was to tell pregnant women to eat less of certain kinds of fish; this makes women of color (who on average eat more fish) responsible for their own exposures while letting polluters (coal-fired power plants) off the hook [3]. A signature success of the Obama EPA was a rule finally requiring power plants to reduce their mercury emissions.

I have learned that the Trump EPA has assaulted protections from many angles [4]. For example, it found the Obama-era mercury controls to be inappropriate; repealed the Clean Power Plan; and decided against proposed bans of several deadly solvents.

Yet I have also learned that the Trump EPA does this not by disregarding science, but by producing deregulatory science. In particular, it has developed new approaches to scientific risk analysis that compel the agency to disregard many benefits of regulation, highlight its costs, dismiss many scientific studies as inadequate, and fail to evaluate many real-world exposures to chemicals (such as using them without protective gear). It justifies these moves using ideas of scientific transparency, reproducibility, and evidence-based decision-making.

A key lesson of fifty years of the Environmental Protection Agency is that when it comes to environmental protection, it is not enough to ask, “Is it science?” It is also crucial to investigate the values and interests that influence scientific judgment. Is evidence being produced and evaluated through the lens of protecting the fossil fuel and petrochemical industries and the interests of the powerful, or through the lens of being most protective to environmental and human health?


Becky Mansfield,

Professor of Geography,

Ohio State University


[1] https://www.epa.gov/history

[2] On regulatory science at EPA, see e.g. Sheila Jasanoff,  The Fifth Branch (1990, Harvard University Press). On tactics of corporate science, see e.g. Kristin Shrader-Frechette, Taking Action, Saving Lives (2007, Oxford University Press).

[3] Becky Mansfield, Environmental health as biosecurity: “seafood choices,” risk, and the pregnant woman as threshold. Annals of the Association of American Geographers 102(5): 969-976. 2012.

[4] These findings are in an unpublished manuscript and were presented at the 2020 Dimensions of Political Ecology conference.

Glaciers, Exploration, & Geography: Geomorphology Redefined

Book cover for Environmental Geoscience: interaction between Natural Systems and Man

Hamilton Pub. Co; First Printing, Fep Torn edition (1973)

I have a number of textbooks on my shelf, many old and out of date, picked up from piles left behind by retiring faculty. One is by a rather famous father-son pair of physical geographers, Strahler and Strahler called, “Environmental Geoscience: Interaction between natural systems and Man,” published in 1973. In the preface, the authors reflect that an “unprecedented explosion of public and academic interest in environmental problems within the last three years has stimulated the birth of a new discipline: environmental science.” How profound; Earth Day and Environmental Science got started in 1970…kinda like me! As Strahler and Strahler recognized, environmental science as a discipline is not a wholly new science, but rather a mix of traditional ones of biology, chemistry, physics and the geosciences. Instead, the novelty is in the “viewpoint – its orientation to global problems, its conception of the earth as a set of interlocking, interacting systems, and its interest in Man as part of these systems.” Notwithstanding the antiquated phrasing, this “Earth System Science” perspective has been the basis of my entire trajectory into Geography, and frames a reflection on where we are now, and more specifically where I am, since this chronology also neatly spans my entire life.

Photo courtesy of Byrd Polar Research Center

My path to Geography was as serendipitous and unintended as any undergrad who has no formal exposure to Geography until university –or as in my case, not until graduate school. I initially declared a Physics major in college, mostly because it was my favorite class in high school, but I lost passion for it after a frustrating bout with differential equations, and so reverted to History. Had I known of a discipline like Geography, or had it existed in my undergraduate institution, my course may have been different;  instead, I had to first find my way to Geology and realize it was more than minerals and oil prospecting.  During my senior year, in a Geology graduate seminar called, “Meteorological Aspects of Climatic Change” taught by Professor Thompson Webb[1], I first caught a glimpse of what Physical Geography held in store. We not only collected observations to appreciate basic dynamics of weather, but puzzled over long-term climate variability. This was it. This was the moment that would define my path. It was the implicit coupling of water and ice to society by the glacial shaping of the landscape that really fascinated me, and I wanted to learn more. The only problem was, it was too late for me to switch majors. Instead, my prof nudged me to consider Geography as a grad school option. Thanks, Tom!

I’ve now come to appreciate that human connections to the environment not only integrate our diverse discipline but also sustain our society. For me, this human-natural coupling manifests vitally in the Andes, where we have researched various aspects of the reality of glacier loss, water and society. Yet it has been through very specific human relationships and personalities that I have experienced it.

I first got to the Andes in college during a winter break climbing trip. I was amazed. In a two week transect from the Pacific coast to the highest point in the western hemisphere, the diverse geography claimed a piece of my heart, even though I was unaware I’d ever return. While prepping for another climb in Alaska, I met Bradford Washburn and Barbara Washburn[2], the adventurous couple who climbed many Alaskan mountains together including Denali, Barbara becoming the first woman to reach the summit. After the evening lecture about his Everest map-making adventure, Barbara by his side, I asked them how I might do things like that; he said he thought Ohio State had a decent program. With only that comment to guide me, I applied to graduate school at OSU. There, under the advising of another female pioneer, Distinguished Professor Ellen Mosley Thompson, I completed a thesis on snow accumulation at South Pole[3] while specializing in climatology. I met Geoffrey Seltzer[4], a Byrd Postdoctoral Fellow, who was teaching Hydrogeology. Geoff had earned his PhD under Herb Wright, a legendary figure in Quaternary studies[5], and was establishing prominence for his expertise in the glacial geology of tropical Central Andes of Peru and Bolivia. I was inspired and had finally found my tribe. Not only was I drawn in by the prospect of getting back to the Andes, but also by Geoff’s field-based style of research. So, I went to Syracuse University to be among Geoff’s first PhD students. He had been funded to examine more closely the ages of low-latitude tropical Andean glacier advances during the last glacial maximum (LGM) along with collaborators Don Rodbell, another Byrd Fellow, and Mark Abbott.

My dissertation research in the Andes began by considering the history of climate told by ancient glaciers, but never got too far from the people living below them. These glaciers housed eons of history but the people living below them relied on them for theirs existence, their culture, and their future. The last chapter of my dissertation emerged after I got a Fulbright to live in Peru and begin to assess the importance of modern glacier melt to stream flow. There, I tracked down the Peruvian co-author on a paper with Stephan Hastenrath, Alcides Ames[6]. Alcides had photographed and surveyed many glaciers starting in the 1960’s, and his meticulous photogrammetry allowed for invaluable mass change values to be computed and analyzed. Nevertheless, post-Fujimori Peru was not favorable to stable employment in glacial studies; Alcides ended up with unreliable income and pension, so he opened a guesthouse. He welcomed me to his home, and family, and I’ve now returned nearly annually with crews of students, collaborating professors and postdocs; exposing them to the people and places that have become a second home to me. I can only hope that their experiences are as awe-inspiring and as life-changing as mine were.

Shallap Glacier, Cordillera Blanca, Peru. Photo credit for left (1966), Alcides Ames; Photo credit for right (2019) Bryan Mark

We’ve followed in Alcides’ footsteps to quantify the volume loss of glaciers with geodetic methods that have extended from backpacked GPS point surveys to aerial LiDAR[7] to drones[8]. Byrd Polar’s own trained photogrammetrist, Henry Brecher, assisted in mapping 1962 base levels to compare. We’ve found an accelerating retreat of glaciers and an alteration in the seasonality and quality of streams below — and risks to water access in these systems are heterogeneous, dynamic, and interlinked[9]. Our Glacier Environmental Change group finds varied opportunities to ‘trace’ glaciers: whether it be the literal trace of their past presence on the landscape in the form of moraines, wetlands and glacial lakes, or the computation of their 3D mass loss, or the flow of melt-water emanating from them. I am motivated by seeking transdisciplinary[10] insights into the unprecedented changes we are facing in our interconnected yet fractious world. 50 years post Earth Day, we have many more vivid portraits of how our society-altered biogeochemistry interlinks our livelihoods with Andean glacier fate, underscoring needs for change. If and how knowledge translates to social change remains a daunting unknown, and a personal challenge. For example, if we know that our energy conversion is redistributing carbon to alter the hydrological fluxes…and melt the glaciers in the Andes…how should this alter what we do as researchers, and how we do it? I’m not sure. But it is my experience of Geography that our motivation needs to consider our interconnectedness and that it translates to very real relationships, and not abstractions.

Bryan Mark

Professor, Geography

State Climatologist of Ohio

[1] Thompson Webb, Professor Emeritus, Brown University: https://vivo.brown.edu/display/twebbiii

[2] Short reflections on long lives of Barbara http://publications.americanalpineclub.org/articles/13201213112, and Bradford http://publications.americanalpineclub.org/articles/12200747600.

[3] Van der Veen, C. J., E. Mosley-Thompson, A. J. Gow, and B. G. Mark.  Accumulation at South Pole: comparison of two 900-year records.  Journal of Geophysical Research, 104 (D24), 31,067-31,076.

[4] Geoff died too early; Mark, B.G., D.T. Rodbell, J. Brigham-Grette and J.A. Smith. Dr. Geoffrey Owen Seltzer: In Memorium. Quaternary International 138-139, 1-4.

[5] Birks, H.J.B. (2017). Herbert E. Wright Jr. (1917-2015): A Biographical Memior. National Academy of Sciences Biographical Memoirs: http://www.nasonline.org/publications/biographical-memoirs/memoir-pdfs/wright-herbert.pdf.

[6] Hastenrath, S. & A. Ames (1995) Recession of Yanamarey Glacier in Cordillera Blanca, Peru, during the 20th century. Journal of Glaciology, 41, 191-196.

[7] PhD dissertation of Kyung In Huh (2014); Huh, K.I., B.G. Mark, Y. Ahn and C. Hopkinson. Volume change of tropical Peruvian glaciers from multi-temporal digital elevation models (DEMs) and its volume surface area scaling. Geografiska Annaler: Series A, Physical Geography 99(3), 222-239.

[8] PhD dissertation of “Ollie” Wigmore (2017); Wigmore, O., B. Mark, J. McKenzie, M. Baraer & L. Lautz (2019) Sub-metre mapping of surface soil moisture in proglacial valleys of the tropical Andes using a multispectral unmanned aerial vehicle. Remote Sensing of Environment, 222, 104-118.

[9] Mark, B. G., A. French, M. Baraer, M. Carey, J. Bury, K. R. Young, M. H. Polk, O. Wigmore†, P. Lagos, R. Crumley†, J. M. McKenzie & L. Lautz (2017) Glacier loss and hydro-social risks in the Peruvian Andes. Global and Planetary Change 159, 61-76. https://doi.org/10.1016/j.gloplacha.2017.10.003.

[10] Our multidisciplinary group came up with an apt abbreviation, TARN: https://glacierlab.uoregon.edu/our-research/tarn/

Have We Gone Too Far to Come Back?

As geographers and atmospheric scientists, we are keenly aware of the reciprocal and interdependent relationships among human societies and the earth system. Popular understandings of natural disasters such as the recent acceleration of burning in the Amazon [1] and the Australian bush fires arguably overemphasize social drivers, and recent changes, that are political (Brazil) and individual (Australia). What we as a community can contribute is the push to think more systematically, structurally, and historically: how have climate changes over the last 50 years contributed to recent crises? And, given the long-term, dynamically interacting social and environmental systems, what are the prospects for resilience?

Australia, for several months, has been experiencing bush fires on an epic scale. There is a great deal of talk about homes lost, people dead, and smoke clogging the air. However, there are other immediate and long lasting implications to our actions.

The fires have devastated Australia with 30 people dead (including four firefighters), roughly 38,594 square miles of bush, forest and parks across Australia burned [2]. In addition to the landscape change, countless animals have perished and as the smoke clears, we may discover that some of the endangered species inhabiting those regions may very well be extinct.

Our planet, however, has some resiliency. Below are examples of life emerging from the fires as nature attempts to rebound through the flames.

https://www.instagram.com/p/B7F1xu5phJ-/?utm_source=ig_embed

This is heartening, however, bush fires don’t only damage our landscape but they can create dangerous weather patterns to worsen existing fire burning patterns. This can cause unpredictability in the way the fire behaves and endanger those fighting the fire [3].

The fires are still burning and will continue to cause damage. The toll may not be known until long after fires have been extinguished. As Geographers and Atmospheric Scientists, the complexity of how these fires affect our planet, our research, and out understanding of climate change, are both exciting and terrifying. Our planet is resilient, but is it resilient enough to survive human beings? Have we gone too far to come back?


[1] –https://www.usatoday.com/story/news/nation/2019/10/18/amazon-rainforest-still-burning-more-fires-future/4011238002/

[2] – https://www.bbc.com/news/world-australia-50951043

[3] – http://media.bom.gov.au/social/blog/1618/when-bushfires-make-their-own-weather/


50 Years of Earth Day: Where are we headed?


This April will mark 50 years of Earth Day. Here at the Ohio State University, we have many events planned this spring to mark the occasion. With this new regular blog feature, OSU’s Department of Geography will take stock, over the course of Spring semester 2020, collectively, of our community’s contributions to understanding significant social and environmental change. Specifically, what do geographers have to contribute to highly visible environmental movements such as Earth Day?

Earth Day is an annual event whose purpose is to advocate for environmental protection. Earth Day is perhaps the most visible symbol of the modern environmental movement, to harness the passion and activism of college students, in making a case to protect air, water and biodiversity resources[1].  Earth Day is celebrated each year on April 22nd, with the ongoing goal to mobilize, advocate and educate for environmental issues. Other issues such as climate change, a green economy, and sustainable agriculture have been incorporated into the goals of the event over time[2].

This semester, our blog will present topical and cutting-edge research on social and environmental change. We will explore some of the front lines of climate change (from South American glaciers to midwestern agriculture), engaging with the politics of environmental data: how scientific knowledge about pollution reflects the efforts and interests of multiple institutions, firms and government bodies, our policies to redesign our economies and cities in anticipation of looming environmental crises, how conservation policy can work against the needs of communities and wildlife in practice, and many other salient issues. Moreover, as geographers, we find common ground in prioritizing social and environmental justice in confronting existential threats wrought by climate change – it is clearer now than ever that societal and environmental challenges are inextricably linked[3]. Faculty, graduate students and visitors to OSU geography will provide weekly posts on their research. Our goal is that we uncover some broader insights as a community. Please check back!


Darla Munroe

Professor and Chair

Department of Geography


[1] https://www.earthday.org/history/
[2] https://www.nationalgeographic.org/encyclopedia/earth-day/
[3] https://www.weforum.org/reports/the-global-risks-report-2020