Earth Day 2020

Happy Earth Day!

This semester in anticipation of the 50th anniversary of Earth Day, we decided to feature some of the breadth of research we have going on in this department dealing with societal impacts on the environment and ecosystems. Right now we are living in a moment that exemplifies the Anthropocene: the global interconnectedness of our society – flows of goods, people, capital, commodities, energy and waste, and our unprecedented impact on ecosystems all play a role in COVID-19 pandemic.

This semester we examined how the boundaries among traditional disciplines continue to be eroded to confront global change, the invisible people on whom our increasingly urban lives depend, how the practice of science itself can serve industrial goals, the roles that cities can play in addressing environmental problems (and the promise and pitfalls), and that we can advocate for action, as scientists, and citizens.

Earth Day, now more than ever, is a movement to bring awareness and change to our lives as human beings. This movement to make sure that the Earth, our home, is there for future generations; to make sure that our forests, rivers, oceans, skies, wildlife, and even our cities are healthy, safe, and sustainable is an important one. April 22nd is the date we recognize this movement officially but there is much you can do to ensure the healthy coexistence of human kind and nature on a daily basis and not just one day.

  1. Get involved
  2. Vote for environmental issues and candidates
  3. Reduce your own carbon footprint
  4. Shop local
  5. Plant a tree
  6. Support conservation efforts

Dramatic Change of Asian Monsoon During the Last Deglaciation

The Asian monsoon, comprised of the South and East Asian subsystems, is a seasonal shift in the rainfall and prevailing wind direction due to the thermal difference between land and ocean. The agriculture, industry, economy, and society at South and East Asia are all critically influenced by freshwater supply from the Asian monsoon. For instance, rice and tea are some crops relying on the summer rainfall that feeds around half of the global population; electricity is produced by hydroelectric power plants driven by water collected during the monsoon season.

Water isotope δ18O – rainfall conundrum

While projections of future Asian monsoon remain largely contradictory due to inadequate comprehension of monsoon dynamics, the paleo Asian monsoon, how monsoon changed in the past, provides empirical constraints on monsoon theories that aids future prediction. Speleothems, also known as cave formations, contain stable water isotope H218O (hereafter expressed as δ18O) inside, which is a proxy (or indicator) of local hydroclimate in the tropics and subtropics. Abundant well-dated speleothem records, uncovered across the pan-Asia continent over the last two decades, reveal an apparently consistent Asian monsoon response during the last deglaciation (20,000 – 10,000 years ago).

Figure. 1. Cross-sections of two stalagmites. Ultra-violet light has been used to illuminate the growth rings in the photo on the right. (Photos: P. Williams)

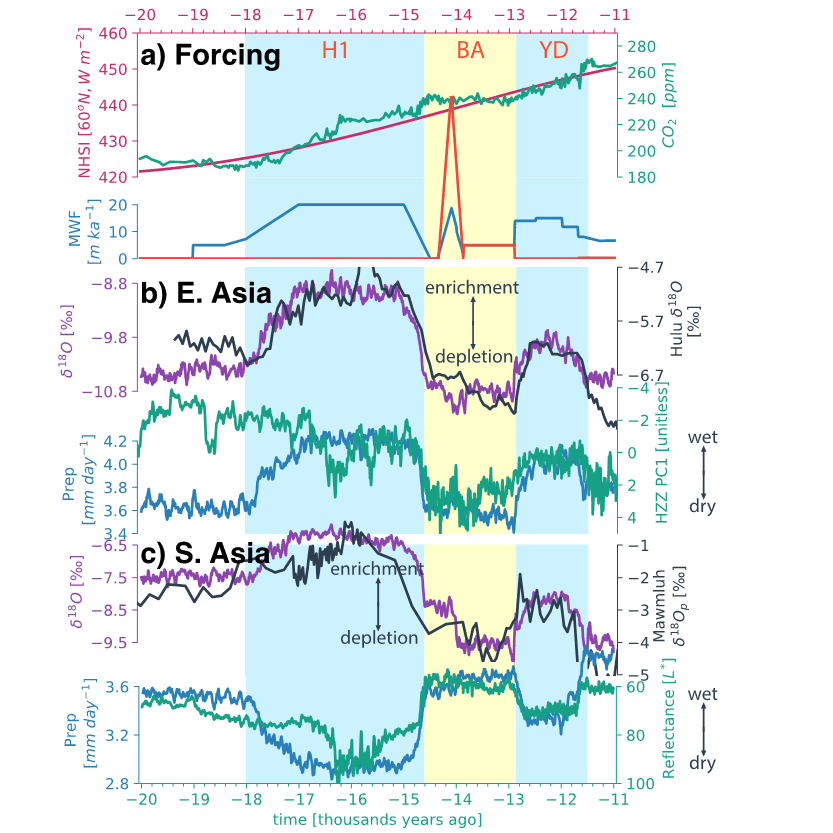
Starting from the Last Glacial Maximum (LGM, ~20,000 years ago), the δ18O in cave records becomes more enriched during Heinrich Event 1 cooling (H1, ~18,000 – ~14,700 years ago), depletes in Bølling-Allerød warming (BA, ~14,700 – ~12,700 years ago), and becomes enriched again in Younger Dryas cooling (YD, ~12,700 – ~11,700 years ago) (Fig. 2 b and c, black curve). Present-day observations suggest that water isotope δ18O – rainfall relationship Asian monsoon region is a seesaw game. That is, an enrichment of δ18O in speleothems corresponds to a decrease in rainfall, whereas a depletion corresponds to an increase in rainfall. Assuming the relationship constant, the enriched-depleted-enriched speleothem δ18O suggests a dry-wet-dry South and East Asian hydroclimate in H1-BA-YD transition. Some other independent hydroclimate proxies, however, provides us with a dramatically different picture, in which the East Asian monsoon rainfall levels up in H1 and YD but declines in BA, opposite to the South Asia monsoon inferred from speleothem δ18O. In a nutshell, how the hydroclimate evolves over the pan-Asia in the past is largely uncertain and why the δ18Os across the continent are highly coherent is not fully resolved.

Figure. 2. Good model-data agreement on key features of deglacial climate and δ^18 O evolution. (a) climate forcings: summer solar insolation (red) at 60oN, CO2 concentration (green), and meltwater flux (blue for northern hemisphere and orange for southern hemisphere); (b) hydroclimate at East Asia: simulated water isotope δ^18 O (purple), δ^18 O from speleothem (black) at Hulu cave (120oE, 30.1oN), simulated monsoon rainfall (blue), and the leading PC of Haozhu records (green), a proxy for East Asian monsoon rainfall; (c) hydroclimate at South Asia: simulated water isotope δ^18 O (purple), δ^18 O from speleothem (black) from Mawmluh cave (91.4oE, 25.2oN), simulated monsoon rainfall (blue), and the Arabian Sea sediment total reflectance (green), a proxy for South Asian monsoon strength. (Graphic courtesy of Chengfei He)


Simulation of the last deglacial climate and water isotope

One possible way to understand the deglacial hydroclimate and water isotope δ18O conundrum is to explicitly simulate their past changes by leveraging the state-of-the-art climate model. Climate model is an analogy to computer software that could represent the processes and interactions that drive the Earth’s climate. These cover the atmosphere, oceans, land and ice-covered regions of the planet. Similar to the applications running on your iPhone, climate model is usually running on supercomputers, equipping tens of thousands CPUs. Here, we employ the advanced Community Earth System Model with water isotope enabled (iCESM) to conduct the first set of isotope-enabled transient climate experiments (iTRACE) of the last 20,000 years. The incorporating water isotopes in CESM enables us to simulate the δ18O directly and perform more direct comparisons against the isotopic signals from Asian speleothems.

Figure. 3. Schematic for Climate models that are systems of differential equations based on the basic laws of physics, fluid motion, and chemistry. (NOAA GFDL)

Our simulation quantitively reproduces the water isotope δ18O evolution in speleothem records from South Asia to East Asia (black vs purple curve, Fig. 2b and c). Despite the broadly coherent δ18O evolutions, the simulation suggests an opposite monsoon response across the Asian monsoon region. In agreement with the modern day δ18O – monsoon rainfall relationship, South Asia undergoes an dry-wet-dry transition in H1-BA-YD, while an almost reverse hydroclimate response appears at East Asia (blue curves, Fig. 2b and c), in agreement with other independent hydroclimate proxies (green curves, Fig. 2b and c).

Mechanism of the Asian hydroclimate and water isotope change

Analogy to the engine of our cars that drives vehicle moving forward, the climate is driven by internal or external forcings like greenhouse gas, solar insolation, and meltwater from ice sheet. For example, the anthropogenic global warming is a result of growing emissions of greenhouse gas. The last deglacial climate change is mostly driven by solar insolation and meltwater. Physically, solar insolation slowly intensifies from LGM that triggers the melt of ice sheet, and, in turn, meltwater discharges the ocean via river runoff (Fig. 2a).

The dynamics of Asian monsoon is largely dependent on the thermal difference between the land and surrounding oceans. An increased land-sea thermal contrast leads to an intensified onshore wind bringing abundant moisture and subsequent monsoon rainfall (Fig. 1a), while decreased thermal contrast leads to an offshore wind and therefore suppressed rainfall. Therefore, an increase in solar insolation usually heats the Asian continent more than the ocean, and thus leads to enhanced monsoon such that we see a long-term increasing rainfall trend at South Asia. In contrast, the meltwater forcing usually cools the continent more, and suppresses monsoon rainfall. As such, during the two cold periods: H1 and YD, when massive freshwater discharging the ocean, the South Asian monsoon fails. Opposite to the South Asian monsoon, the East Asian monsoon is associated with westerly jet, a circulation at high-level atmosphere, controlled by sophisticated atmospheric dynamics. Long story short, in response to meltwater forcing, the westerly jet migrates southward and leads to more rainfall during H1 and YD at East Asia, but moves northward and leads to less rainfall in response to solar insolation.

Turning to the coherent water isotope δ18O evolution, our simulation reveals that the δ18O in water vapor over Indian Ocean changes systematically during the last deglaciation. The moisture source for Asian monsoon rainfall mostly stems from the Indian Ocean. As a result, the downstream δ18O evolves highly consistently across the pan-Asia. For example, during H1 and YD, the cooling summer induced by meltwater produces less rainfall over Indian ocean, such that the δ18O in water vapor enriches due to the see-saw δ18O – rainfall relationship. Once the water vapor is transported downstream to Asia continent and condenses, the δ18O enriches in speleothem.

Chengfei He

PhD Candidate in the Department of Geography

The Ohio State University

Sustainability in a World of Cities

The 21st century witnessed an epochal event in human civilization: in 2008, the world became majority urban for the first time in history. Urbanization is accelerating: two-thirds of the global population will live in cities by 2030. Some scholars are projecting an essentially urban planet by the end of the century, with 90% of the world population crowded into urban areas.  A world of 10 billion people living predominantly in cities— of which 60% globally have yet to be built —underscores the critical need and immense opportunity for new scientific and policy approaches that can achieve sustainable urban systems.

graphic to demonstrate CMAX Bus service after 6pm

Figure 1: Locations reachable at 6pm on a typical weekday from the Linden neighborhood of Columbus by public transit and walking after new CMax bus rapid transit service. Graphic courtesy of Harvey Miller

Mobility is central to urbanity: transportation is how we organize our cities. While the personal automobile has generated stunning levels of travel and activity over the past century, it has also led to urban transportation systems being inefficient, costly, inequitable, unsafe and unhealthy, and damage environments at local to global scales.  This is leading to a mobility crisis that will get worse as the world continues to urbanize.

In many cities, we are seeing the deployment of new technology-enabled mobility services such as vehicle sharing, hailing services, and micromobility such as scooters and bikeshare systems. These innovations are disrupting the mobility landscape of cities, with even larger disruptions inevitable with the coming of connected autonomous vehicles.  While these hold promise, they also may make an unsustainable situation even worse.

Are New Mobility Technologies Sustainable?

Introducing disruptive mobility technologies to cities is a large-scale, real-world experiment that will impact cities for decades. The outcomes of these mobility disruptions have profound implications for urban air quality, social equity, energy consumption, greenhouse gas emissions, safety and health.  So far, the evidence is mixed. For example, some evidence suggest that Lyft and Uber are reducing drunk and impaired driving (although possibly at the expense of heavier drinking).  However, these services are also increasing traffic congestion, undermining public transit and leading to higher energy consumption and emissions.

graphic example of data dashboards from available data

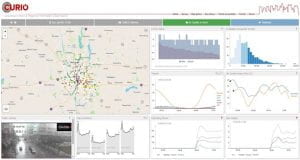
Figure 2: The Columbus Urban and Regional Information Observatory (CURIO) – a geospatial data dashboard for Columbus, Ohio. Graphic courtesy of Harvey Miller

Whether new mobility services will make cities more sustainable is an open question, one that will be difficult to answer using 20th century urban scientific and management approaches.  In the past we have relied on simple data and measures that could be easily collected.  For example, automobile traffic counts have been easy to collect: consequently our main transportation performance measure is how many vehicles we can shove through a network.  Our simple, 20th century models also treat mobility as undifferentiated flow, like water – consequently, we made traffic congestion worse by trying to build bigger “pipes” because of a phenomenon known as induced demand.

In the 21st century, we need transportation measures and analytics that:

  • i) focus on people and their activities, not vehicles and their movements;
  • ii) recognize the heterogeneity of peoples’ needs and capabilities with respect to mobility and accessibility, and;
  • iii) capture the full cost of transportation, especially externalities such as emissions, noise, risk and other social and environmental impacts.

New Geospatial Technologies and Sustainable Mobility Science

New sources of data are emerging that could enable some of this system science. Location-aware technologies such as mobile phones and global position system (GPS) receivers, environmental sensors, social media and smart technologies are generating data at unprecedented volumes and spatio-temporal resolution, facilitating new insights into mobility patterns and urban dynamics.  The cost of data storage has plummeted, allowing these data to be saved and archived over time.  Advances in machine learning, geospatial data mining, geovisualization and other knowledge discovery techniques are helping specialized and siloed practitioners work together to make sense of this data avalanche.  Cloud computing, geospatial data portals, application-programming interfaces and data dashboards allow scientists to share these data and information widely with the public. These new technologies are creating a new kind of data-enabled and computation-rich mobility science that can lead to more nuanced, appropriate and sustainable solutions to our growing urban mobility crisis.

Harvey Miller

Bob and Mary Reusche Chair in Geographic Information Science

Professor of Geography

Director, Center for Urban and Regional Analysis (CURA)


Some of the geospatial data-enabled sustainable mobility research projects conducted in the OSU Department of Geography and the Center for Urban and Regional Analysis (CURA) include:


A Geospatial Perspective of the Novel Coronavirus Outbreak

The Department of Geography welcomes Yaoli  Wang – a post doctoral researcher – and Yu Liu – a full professor – from Peking University, providing a guest post during the COVID-19 outbreak.

The Spring Festival of 2020 was determined to be historic. One week before the Chinese New Year Eve (Jan 24), Beijing public transport tubes were still in hustle and bustle like usual. Within four days, the outbound flow back home from Beijing made the city quiet, when the news came clearly to everybody that a SARS-like virus has struck Wuhan. At 10 am, Jan 23, 2020, Wuhan was forced into lock down. Things evolved rapidly from there. Until the time of quarantine, 5 million people had left Wuhan. Along with the flow of migration was the spreading of a very contagious and novel coronavirus – COVID-19. All Chinese provinces and many worldwide countries reported infections. People, however, always have normalcy bias, inclining to believe that nothing bad will happen to them and thus not careful enough. The outbreak worldwide is already good proof.

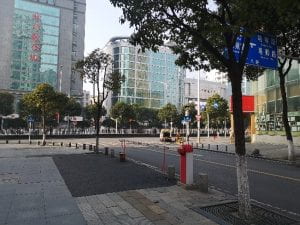
Lockdown of Wuhan in January

Lockdown of Wuhan in January (Courtesy of Professors Qingyun Du and Zhixiang Fang, Wuhan University)

Lockdown of Wuhan in January

Lockdown of Wuhan in January (Courtesy of Professors Qingyun Du and Zhixiang Fang, Wuhan University)

Underneath the accident is essentially a spatiotemporal problem. Within China, the problem can be divided into two scales: inter-city and intra-city. Now in late February, geospatial scientists are trying to reverse the course of COVID-19 spread over China using inter-city movement flow and city-level reported confirmed cases in time series. We would imagine a spread dynamic like wavefront and wish to construct a model of migration interaction based on which the arrival time or amount of illnesses can be inferred. The lock down of Wuhan apparently put a brake on the spreading process, but could not eliminate it. Already infected people outside Wuhan continued to transmit the virus to other cities or within their own cities. The hierarchy of the interaction network potentially captures the spreading path, which indicates an effective interruption. Here we see the huge potential of space-time big data. There is a study at the beginning of the outbreak which, by analyzing the outbound movement flow from Wuhan to areas around, drew a conclusion that the up-till-then reported illness count was underestimated 1; the conclusion, unfortunately, was proven to be true when the statistics were complete.

graph displaying Novel Coronavirus Pneumonia in China

Figure 1: Spatial distribution of the confirmed COVID-19 cases in China on February 17, 2020, when the total number is 72,528 [2]

Inside a city, the general public is nervous and cautious with 2nd or 3rd degree transmission. Spatially clustered illnesses are the majority of cases, for example, in departments of a hospital, in a family, and in a canteen of a company. Close contact between two individuals is a typical space-time relationship, which in GIScience we usually use “spatio-temporal co-occurrence” to model it. That is why the government asks the public to stay at home and shuts down all public recreation places, especially indoor venues. Random encounters are much more difficult to trace back than regular social networks. Back in 1630, the Milan plague was re-triggered by a big carnival even though the beginning of the plague was well controlled. For the ongoing 2019 coronavirus, people had spent so much time and energy retrieving the individual trajectories of confirmed illnesses. There are even some online gadgets to examine if a person has trajectory overlapping with the confirmed cases. What comes up next is how spatial and information technology can facilitate the process in a more positive way while not intruding on privacy too much? For instance, spatiotemporal trajectories from mobile phone records are ubiquitous, but there is a trade-off: the demand for higher space-time accuracy down to a meter level for automatic screening of virus encounter versus the rejection of privacy exposure and targeted data breach.

Foreseeing the future of urban life and technology, can we imagine a world where every person is implanted with a chip – something we call “human black box” recording all the information throughout life, including his (or her) health, spatiotemporal trajectories, habits, etc? What’s missing is a mature mechanism to protect privacy and data safety. Blockchain might be a potential solution. All the information is not controlled by a central organization. The owner of data has the initiative of data-sharing in an urgent case like the outbreak of coronavirus. As an incentive of sharing data, the user gets bonuses, which is guaranteed by a blockchain system. We believe that most people are not ready for accepting such a technique at present. But could this become reality if we can manage the negative issues, say, 100 years later? Let’s wait and see.

The virus is still happening and boosting technology innovation. City governance needs a more robust system to be responsive to public events; e-commerce is evolving to smooth the channel between suppliers and customers; education is developing new patterns such as online education; crowd-sourcing and public participation is driving for social well-being. Up until the time of writing, many countries all over the world have reported infections, but many of them cannot trace back to the origin of infection. Potentially the geography of virus genomics may map out the trajectories of generations of virus so that we can disclose the mystery of its origin and spreading. All the aspects can be regarded as evolvement of spatiotemporal relationships. We are going for an opening-up of geospatial technologies.

Yaoli Wang (Post Doctoral Researcher), Yu Liu (Professor)

Institute of Remote Sensing and Geographical Information Systems,

Peking University

Yu Liu is the 2019-2020 Robinson Colloquium speaker for the Department of Geography.

  1. https://mp.weixin.qq.com/s/8x8UYZBZwMGn86Wq7iz4og, in Chinese.
  2. https://vis.ucloud365.com/ncov/china/en.html


Post has been updated (4-2-2020) with photos from contributors of the author

Climate Change: The Largest Challenge Facing Humanity

This year we celebrate the 50th anniversary of Earth Day. Climate change is one of the biggest challenges facing humanity and so the theme for Earth Day 2020 is climate action. There are many ways that individuals and organizations can take climate action. As a climatologist in the Department of Geography at The Ohio State University, one of the ways that I am taking action is through helping to assemble, quality control, harmonize and disseminate high-quality climate observations. These data are essential for monitoring and detecting climate variability and climate change. Since 2010, I have been involved in developing the most comprehensive soil moisture database in the United States. With funding from the National Science Foundation, USDA and NOAA, we developed nationalsoilmoisture.com. The map shown below indicates the locations where soil moisture measurements are currently being made in the United States. Data from many of these sites are being provided in near-real-time on nationalsoilmoisture.com. This includes in situ measurements of soil moisture, satellite-derived soil moisture from NASA SMAP and model-derived soil moisture from NLDAS-2.

Figure 1. Locations of in situ soil moisture sensor networks across the United States from federal- and state-level networks. Credit: nationalsoilmoisture.com.

These data fill a critical gap because unlike for other climatological and hydrological variables, there are no national databases for soil moisture. The 2008 report on “Future Climate Change Research and Observations: GCOS, WCRP and IGBP Learning from the IPCC Fourth Assessment Report” (WMO/TD No. 1418) recommended that soil moisture data should be assembled because of its importance for:

(1) improving our understanding of land-atmosphere interactions,

(2) developing seasonal to decadal climate forecasting tools,

(3) calibrating, validating and improving the physical parameterizations in regional and global land surface models (LSM),

(4) developing and validating satellite-derived soil moisture algorithms, and

(5) monitoring and detecting climate variability and change in this key hydrological variable.


Why is soil moisture important?

As we noted in Legates et al. (2011), “soil moisture is not just a process that is integral to climate, geomorphology, and biogeography – it truly lies at the intersection of all three branches of physical geography. A complete understanding of soil moisture and its spatial and temporal variability and impact draws upon interactions among and expertise gained from all three subdivisions. Soil moisture lies at the intersection of climatology, geomorphology, biogeography, and hydrology, thereby providing true integration of the subdisciplines rather than just supplying a common theme.” Soil moisture influences the exchange of energy and water between the land surface and atmosphere. Soil moisture controls the partitioning of rainfall into runoff and infiltration. It modulates vegetation growth and photosynthesis. It also influences mass movements, weathering, erosion and sediment transport. Therefore, soil moisture is a key climatological and hydrological variable. However, compared to precipitation and temperature, there are very few soil moisture measurements.


Current Efforts to Develop a National Soil Moisture Network

Significant progress is being made in the United States to address the critical gaps in soil moisture observations. As a member of the National Soil Moisture Network Executive Committee, I helped to draft “A Strategy for the National Soil Moisture Network: Coordinated, High-Quality, Nationwide, Soil Moisture Information for the Public Good” that was released in February 2020. This Strategy Document was called for in the National Integrated Drought Information System (NIDIS) Reauthorization of 2018. It is intended to review the current status of soil moisture monitoring and reporting in the U.S., and to develop a strategy for a national coordinated soil moisture monitoring network, involving federal agencies, regional and state mesonets, data providers, researchers, user groups, and others. The strategy document identifies ten recommendations for how to implement a National Soil Moisture Network. The goal of this effort is to provide a unifying structure to enhance monitoring activities, establish partnerships for building out the network, develop an organizational structure that will collect, integrate and deliver transformative soil moisture products to the nation. This one tangible way that the Department of Geography at Ohio State is actively involved in climate change research. This effort provides better data for assessing how the climate is changing and to increase the resilience of the United States to these changes.


Dr. Steven Quiring,

Department of Geography

The Ohio State University

“Greening” policies: a view from urban China

As part of a recent citywide “greening” effort, the Beijing government has introduced regulations to cover walls surrounding construction sites with artificial grass. (Copyright Samuel Kay 2020)

For a month in the summer of 2013, my lungs and I got our first taste of what could only be described as apocalyptically bad air pollution. I was conducting ethnographic fieldwork in Beijing amidst an air pollution crisis that was also serving as a backdrop for a struggle between environmentalists, scientists, and the Chinese government over how to acknowledge and respond to the pollution. At the time, the official government stance was to downplay pollution levels. Only a few years removed from the worst of the 2008 global financial crisis, the Chinese government was understandably loathe to undertake any policy shift that might slow down the nation’s economic engine, notwithstanding the clouds of toxic smog it was belching into the lungs of hundreds of millions of people.

Then came a few watershed moments for public consciousness: following an “air-apocalypse” in 2013, prominent internet personalities adopted air pollution as a cause célèbre. Filter buying and mask wearing became—for at least a narrow but affluent audience—a form of virtue signaling. In March 2014, the Chinese government shifted its stance from denial and underplaying to a veritable war footing: In March 2014, Premier Li Keqiang declared “war on pollution.” In February 2015, journalist Chai Jing’s documentary Under the Dome, which saw her earnestly discussing her fears as a mother for how air pollution had impacted the health of her newborn daughter in utero, unleashed a pent-up outpouring of environmental anxiety from China’s urban upper-middle class.

By 2016, the government narrative had shifted from a prioritization of economic progress to a paradigm of building an “ecological civilization” by pursuing development through greening. Originally introduced by the previous Hu-Wen administrative, Chinese President Xi Jinping adopted and magnified “ecological civilization” as a signature policy. This ideology of development through greening, which promised to resolve any tension between economic growth and environmental limits, quickly reshaped urban policymaking. Beijing’s 2016-35 comprehensive plan, in pursuit of a city with “blue skies, white clouds, and green mountains,” called for a reduction of urban construction area by 160 square kilometers and the planting of 100,000,000 new trees across thousands of square kilometers of new parks and forests. Although the two are not necessarily mutually exclusive, Beijing’s environmental policy became as much about demonstrating progress as about achieving it, with conspicuous greening becoming a key policy tool. The provision of water to 100,000,000 new trees poses a major logistical challenge in a city where the land is sinking because of severe depletion to groundwater. I argue that this is a key reason that non-organic “plants” and other green-colored things (such as dust control cloths blanketing demolition sites) have come to play a major role in urban greening alongside the army of new trees. Since 2013, Beijing has achieved dramatic improvements in air quality, making “blue skies and white clouds” a much more common sight in the city. As water-scarce Beijing seeks to dramatically increase the amount of green in its color palette, how have relationships between humans, non-humans, living, and non-living matter been reconfigured? What are the implications for the politics of urbanization and the environment?

A flower box filled with plastic plants. The sign reads: “Cherish flowers and grass; please do not pick” (Copyright Samuel Kay 2020)

Samuel Kay, PhD Candidate

E-mail
Personal Website

Infrastructural Labor

Guest Post

Vinay Gidwani

Professor Geography & Global Studies

University of Minnesota

Madanpur Khadar is a large resettlement colony in Delhi’s southeast fringe, wedged between the states of Uttar Pradesh and Haryana, partially abutting the Yamuna River. Its residents work as cleaners, sweepers, office helpers and laborers; large numbers of the colony’s women are employed as domestic workers in adjacent upper middle-class neighborhoods. Madanpur Khadar is also a multiform waste hub, which, like tens of other waste hubs scattered across and around Delhi– some specializing in a single waste product, others more flexible in character – daily process thousands of tons of detritus and discards whose accumulation would render urban existence as we know it impossible.

Worker in Madanpur Khadar operating a pressing machine that bundles scrap paper
Photo: Courtesy Sunil Kumar, with permission

These waste hubs and the pathways of people, objects, information, and money that connect them are the city’s lymphatic system, sequestering its waste and inoculating it from lasting damage. The intricate yet under-valued operations, until a moment of breakdown, of this sprawling waste infrastructure – from waste hubs to municipal landfills to sewage pipelines – hinges on the toil, ingenuity, practical knowledge and risk-taking of several hundred thousand workers, small entrepreneurs, and petty government functionaries. I call this labor “infrastructural”, mobilizing the double meaning of that adjective, ‘below’ and ‘beyond’, to simultaneously underscore its indispensability as well as invisibility in the policy imagination. The infrastructural labor of waste work recuperates and returns to circuits of value commodity detritus which, left untreated, would erode the frail certitudes of city life.

Waste pickers in a squatter settlement and waste hub in northwest Delhi
Photo: Courtesy Lokesh, with permission

The unpaid work of care and repair within the household, which subtends reproduction of labor – the creative life energies that are the material conditions of human survival and capital accumulation – is another instance of infrastructural labor whose invisibility feminist scholars have long underscored. Waste work and human reproduction come together in the life of Nusrat Begum, who earns a living from sorting bio-medical waste illicitly acquired by local contractors. The bio-medical waste contains discarded medicines, injections, needles, bottles, rubber items, and so on, some of it unsafe (such as infected needles, soiled rubber gloves, used urine bags, prescription-only painkillers).

Hospital waste in Madanpur Khadar
Photo: Courtesy Sunil Kumar, with permission

Nusrat Begum’s children don’t attend school: they also pick waste, partly to compensate for their father’s illness. But Nusrat Begum’s unrequited aspirations for her children are apparent when she bitterly remarks: “If the parents live amidst garbage [kooda] can the children stay away from it?” Her comment mobilizes the double sense of the word ‘kooda’. She implies that her children’s trajectories can’t be otherwise given that kooda is both, a source of the parents’ livelihood and the squalor or filth that marks their lives. Nusrat’s existence is a blunt reminder that women carry the double burden of production and reproduction. Their labor time is never done. After she has finished sorting the day’s waste, Nusrat turns her attention to household chores such as cooking the evening meal. Nusrat Begum says that her bones ache and her back constantly hurts; she is unable to sleep at night. It is the constitutive injustice of the city that Nusrat’s austere life and those of myriad others underwrites the city’s very possibility.


Professor Vinay Gidwani will be giving a guest lecture in the Department of Geography on February 28, 2020. Please join us to explore this topic in more depth.

The Infrastructure of Value. Vinay Gidwani

Research Reflections

When I started the MA program in AU 2017, I was planning on conducting a remote sensing research project. My study area was set to be French Frigate Shoals in the Northwestern Hawaiian Island chain. Using high-resolution imagery of this atoll, I wanted to map hazards for threatened and endangered species. I was most excited about the potential ability to detect plastics in my imagery. Everything seemed straightforward.

Satellite Imagery of French Frigate Shoals shown in relation to the Hawaiian archipelago. Tern Island is noted in the top left corner of the inset.

I was first challenged to develop my ‘conceptual framework’ in Becky Mansfield’s Research Design, a core course for graduate students in Geography. Given my broad topic, I got lost in the object of inquiry. This research was concerned with too many things. I had outlined a remote sensing project on marine debris, changes to beach dynamics, risk maps for multiple target species, and policy suggestions. These diffuse research goals reflected my self-doubt. I tried to imagine what was most interesting about my topic to others, rather than what I found most compelling. I considered this an injustice to my study site, which was so rich with evidence of the intermingling’s of social, economic, political, and physical processes and dynamics.

The great benefit of Geography is that it is fundamentally interdisciplinary and expansive. Curious about other disciplinary approaches to my topic, I enrolled in courses on Oceanography, Public Affairs, and Feminist Studies. A. Marie Ranjbar’s course, (Human) Rights in the Anthropocene, was pivotal in shaping my literature review and enriched my theoretical approaches. I took up other readings in political ecology, critical animal studies, and posthumanism. I allowed myself to think about my project differently. I made note of the things that frustrated me in traditional approaches to environmental issues and conservation. This was part of the act of ‘doing research’ that in turn shaped the research question.

I was most troubled by the passive way, or “the othering” of non-human animals, as they were discussed as objects of conservation. I found that the framings encouraged human exceptionalism and species hierarchy. I needed to change my characterization of the atoll as well. The environmental outcomes of today are not happenstance. Instead, they are directly linked to social and economic processes. If we begin to talk about phenomena like pollution and sea level rise as direct consequences of capitalism and colonialism, we can identify the economic, political and social structures that produce environmental violence. Building more just and ethical engagements with non-humans begins by destroying previous conceptions of their value. My research became focused on the foundational issues of representation stemming from current theorizing in conservation policy.

Due to the reshaping of my questions, remote sensing was no longer the strongest evidence I could collect to demonstrate the need to change conservation. My project became focused on the differentiated experience of the female green sea turtle as an embedded and embodied, relational and affective subject as well as an active agent that participates in and contributes to social, political, and economic life. The works of Irus Braverman [1], Lori Gruen [2], Rosi Braidotti [3], Juanita Sundberg, Rosemary-Claire Collard and Jessica Dempsey [4] were indispensable to these goals.

Violence against green sea turtles demonstrated by exposure pathways and subsequent health-related hazards from anthropogenic sources.

This Earth Day, I find it appropriate to reflect on change- what we are in the process of becoming and ending. I see many opportunities to demonstrate care and work towards more ethical engagements with the more-than-human world in this age of the Anthropocene.

Rebecca Chapman, PhD Student,

Department of Geography

  1. Braverman, I. (2015). Wild life : The institution of nature. Stanford, California: Stanford University Press.
  2. Gruen, L. (2015). Entangled empathy : An alternative ethic for our relationships with animals. New York: Lantern Books, a division of booklight.
  3. Braidotti, R. (2013). The posthuman. Cambridge, UK: Polity Press.
  4. Collard, R., Dempsey, J., & Sundberg, J. (2015). A manifesto for abundant futures. Annals of the Association of American Geographers, 105(2), 322-330.

Glaciers, Exploration, & Geography: Geomorphology Redefined

Book cover for Environmental Geoscience: interaction between Natural Systems and Man

Hamilton Pub. Co; First Printing, Fep Torn edition (1973)

I have a number of textbooks on my shelf, many old and out of date, picked up from piles left behind by retiring faculty. One is by a rather famous father-son pair of physical geographers, Strahler and Strahler called, “Environmental Geoscience: Interaction between natural systems and Man,” published in 1973. In the preface, the authors reflect that an “unprecedented explosion of public and academic interest in environmental problems within the last three years has stimulated the birth of a new discipline: environmental science.” How profound; Earth Day and Environmental Science got started in 1970…kinda like me! As Strahler and Strahler recognized, environmental science as a discipline is not a wholly new science, but rather a mix of traditional ones of biology, chemistry, physics and the geosciences. Instead, the novelty is in the “viewpoint – its orientation to global problems, its conception of the earth as a set of interlocking, interacting systems, and its interest in Man as part of these systems.” Notwithstanding the antiquated phrasing, this “Earth System Science” perspective has been the basis of my entire trajectory into Geography, and frames a reflection on where we are now, and more specifically where I am, since this chronology also neatly spans my entire life.

Photo courtesy of Byrd Polar Research Center

My path to Geography was as serendipitous and unintended as any undergrad who has no formal exposure to Geography until university –or as in my case, not until graduate school. I initially declared a Physics major in college, mostly because it was my favorite class in high school, but I lost passion for it after a frustrating bout with differential equations, and so reverted to History. Had I known of a discipline like Geography, or had it existed in my undergraduate institution, my course may have been different;  instead, I had to first find my way to Geology and realize it was more than minerals and oil prospecting.  During my senior year, in a Geology graduate seminar called, “Meteorological Aspects of Climatic Change” taught by Professor Thompson Webb[1], I first caught a glimpse of what Physical Geography held in store. We not only collected observations to appreciate basic dynamics of weather, but puzzled over long-term climate variability. This was it. This was the moment that would define my path. It was the implicit coupling of water and ice to society by the glacial shaping of the landscape that really fascinated me, and I wanted to learn more. The only problem was, it was too late for me to switch majors. Instead, my prof nudged me to consider Geography as a grad school option. Thanks, Tom!

I’ve now come to appreciate that human connections to the environment not only integrate our diverse discipline but also sustain our society. For me, this human-natural coupling manifests vitally in the Andes, where we have researched various aspects of the reality of glacier loss, water and society. Yet it has been through very specific human relationships and personalities that I have experienced it.

I first got to the Andes in college during a winter break climbing trip. I was amazed. In a two week transect from the Pacific coast to the highest point in the western hemisphere, the diverse geography claimed a piece of my heart, even though I was unaware I’d ever return. While prepping for another climb in Alaska, I met Bradford Washburn and Barbara Washburn[2], the adventurous couple who climbed many Alaskan mountains together including Denali, Barbara becoming the first woman to reach the summit. After the evening lecture about his Everest map-making adventure, Barbara by his side, I asked them how I might do things like that; he said he thought Ohio State had a decent program. With only that comment to guide me, I applied to graduate school at OSU. There, under the advising of another female pioneer, Distinguished Professor Ellen Mosley Thompson, I completed a thesis on snow accumulation at South Pole[3] while specializing in climatology. I met Geoffrey Seltzer[4], a Byrd Postdoctoral Fellow, who was teaching Hydrogeology. Geoff had earned his PhD under Herb Wright, a legendary figure in Quaternary studies[5], and was establishing prominence for his expertise in the glacial geology of tropical Central Andes of Peru and Bolivia. I was inspired and had finally found my tribe. Not only was I drawn in by the prospect of getting back to the Andes, but also by Geoff’s field-based style of research. So, I went to Syracuse University to be among Geoff’s first PhD students. He had been funded to examine more closely the ages of low-latitude tropical Andean glacier advances during the last glacial maximum (LGM) along with collaborators Don Rodbell, another Byrd Fellow, and Mark Abbott.

My dissertation research in the Andes began by considering the history of climate told by ancient glaciers, but never got too far from the people living below them. These glaciers housed eons of history but the people living below them relied on them for theirs existence, their culture, and their future. The last chapter of my dissertation emerged after I got a Fulbright to live in Peru and begin to assess the importance of modern glacier melt to stream flow. There, I tracked down the Peruvian co-author on a paper with Stephan Hastenrath, Alcides Ames[6]. Alcides had photographed and surveyed many glaciers starting in the 1960’s, and his meticulous photogrammetry allowed for invaluable mass change values to be computed and analyzed. Nevertheless, post-Fujimori Peru was not favorable to stable employment in glacial studies; Alcides ended up with unreliable income and pension, so he opened a guesthouse. He welcomed me to his home, and family, and I’ve now returned nearly annually with crews of students, collaborating professors and postdocs; exposing them to the people and places that have become a second home to me. I can only hope that their experiences are as awe-inspiring and as life-changing as mine were.

Shallap Glacier, Cordillera Blanca, Peru. Photo credit for left (1966), Alcides Ames; Photo credit for right (2019) Bryan Mark

We’ve followed in Alcides’ footsteps to quantify the volume loss of glaciers with geodetic methods that have extended from backpacked GPS point surveys to aerial LiDAR[7] to drones[8]. Byrd Polar’s own trained photogrammetrist, Henry Brecher, assisted in mapping 1962 base levels to compare. We’ve found an accelerating retreat of glaciers and an alteration in the seasonality and quality of streams below — and risks to water access in these systems are heterogeneous, dynamic, and interlinked[9]. Our Glacier Environmental Change group finds varied opportunities to ‘trace’ glaciers: whether it be the literal trace of their past presence on the landscape in the form of moraines, wetlands and glacial lakes, or the computation of their 3D mass loss, or the flow of melt-water emanating from them. I am motivated by seeking transdisciplinary[10] insights into the unprecedented changes we are facing in our interconnected yet fractious world. 50 years post Earth Day, we have many more vivid portraits of how our society-altered biogeochemistry interlinks our livelihoods with Andean glacier fate, underscoring needs for change. If and how knowledge translates to social change remains a daunting unknown, and a personal challenge. For example, if we know that our energy conversion is redistributing carbon to alter the hydrological fluxes…and melt the glaciers in the Andes…how should this alter what we do as researchers, and how we do it? I’m not sure. But it is my experience of Geography that our motivation needs to consider our interconnectedness and that it translates to very real relationships, and not abstractions.

Bryan Mark

Professor, Geography

State Climatologist of Ohio

[1] Thompson Webb, Professor Emeritus, Brown University: https://vivo.brown.edu/display/twebbiii

[2] Short reflections on long lives of Barbara http://publications.americanalpineclub.org/articles/13201213112, and Bradford http://publications.americanalpineclub.org/articles/12200747600.

[3] Van der Veen, C. J., E. Mosley-Thompson, A. J. Gow, and B. G. Mark.  Accumulation at South Pole: comparison of two 900-year records.  Journal of Geophysical Research, 104 (D24), 31,067-31,076.

[4] Geoff died too early; Mark, B.G., D.T. Rodbell, J. Brigham-Grette and J.A. Smith. Dr. Geoffrey Owen Seltzer: In Memorium. Quaternary International 138-139, 1-4.

[5] Birks, H.J.B. (2017). Herbert E. Wright Jr. (1917-2015): A Biographical Memior. National Academy of Sciences Biographical Memoirs: http://www.nasonline.org/publications/biographical-memoirs/memoir-pdfs/wright-herbert.pdf.

[6] Hastenrath, S. & A. Ames (1995) Recession of Yanamarey Glacier in Cordillera Blanca, Peru, during the 20th century. Journal of Glaciology, 41, 191-196.

[7] PhD dissertation of Kyung In Huh (2014); Huh, K.I., B.G. Mark, Y. Ahn and C. Hopkinson. Volume change of tropical Peruvian glaciers from multi-temporal digital elevation models (DEMs) and its volume surface area scaling. Geografiska Annaler: Series A, Physical Geography 99(3), 222-239.

[8] PhD dissertation of “Ollie” Wigmore (2017); Wigmore, O., B. Mark, J. McKenzie, M. Baraer & L. Lautz (2019) Sub-metre mapping of surface soil moisture in proglacial valleys of the tropical Andes using a multispectral unmanned aerial vehicle. Remote Sensing of Environment, 222, 104-118.

[9] Mark, B. G., A. French, M. Baraer, M. Carey, J. Bury, K. R. Young, M. H. Polk, O. Wigmore†, P. Lagos, R. Crumley†, J. M. McKenzie & L. Lautz (2017) Glacier loss and hydro-social risks in the Peruvian Andes. Global and Planetary Change 159, 61-76. https://doi.org/10.1016/j.gloplacha.2017.10.003.

[10] Our multidisciplinary group came up with an apt abbreviation, TARN: https://glacierlab.uoregon.edu/our-research/tarn/