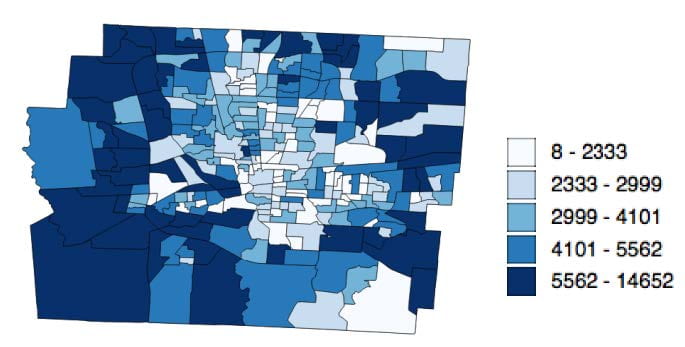
In my role as Ohio State’s Geospatial Information Librarian, a lot of the work that I do is related to helping researchers – at all levels and across a wide variety of disciplines – think through how they can locate, analyze, and visualize geographic data. And a lot of the time, data products provided by the U.S. Census Bureau will be relevant for addressing the research questions that they are asking.
When we hear the word “census” in 2020, our thoughts likely turn to the decennial census, and for good reason. It is hard to overstate the importance of the 2020 Census in terms of political representation and federal funding allocation, and the ways these will impact our communities over the next decade.
But it’s also important to note that census data products cover a lot more than the decennial census. In fact, the U.S. Census Bureau conducts more than 130 different surveys and programs, including the American Community Survey (ACS), Current Population Survey (CPS), Economic Census, and Longitudinal Employer-Household Dynamics (LEHD) program, to name a few.
More recently, the U.S. Census Bureau has also been releasing a variety of interesting experimental data products, which are described as “innovative statistical products created using new data sources or methodologies that benefit users in the absence of other relevant products.” Two that garnered some attention earlier this year and that have recently gone through a second phase are the Household Pulse Survey and Small Business Pulse Survey, which provide data about the social and economic effects of the COVID-19 pandemic on American households and businesses, respectively.
As mentioned in an earlier post, data products from the U.S. Census Bureau are free and publicly available. Here are a few different ways you can access these data for research, teaching, or class assignments:
U.S. Census Bureau
A lot of census data products are directly accessible in data.census.gov, a new platform that replaced American FactFinder in early 2020. The platform features a new search interface aimed at making it easier for users to locate the data they need, with more datasets planned to be added over time. It’s also possible to browse and download data tables for various programs by topic and year. If you are unable to find the data you are looking for through either of those options, you can always go directly to the website for the specific program you are interested in to see what data access options are available (and see here for the list of all surveys and programs). TIGER data products are also publicly available for working with census data in a GIS.

data.census.gov is the U.S. Census Bureau’s new platform for facilitating data access
IPUMS
IPUMS is a great resource for accessing a number of historical and contemporary census data products not readily available elsewhere. For example, NHGIS – the National Historical Geographic Information System – provides access to summary data tables and GIS-compatible boundary files from 1790 to the present and for all levels of U.S. census geography. For those working internationally, IPUMS also recently announced the launch of IHGIS – the International Historical Geographic Information System – with data tables and GIS-compatible boundary files from population, housing, and agricultural censuses from a number of countries, with more to be added over time.
Up to this point, all of the data resources I’ve been discussing have been more focused on providing summary data, presented in aggregate at different levels of U.S. census geography. But various IPUMS products also provide access to historical and contemporary census microdata, that is, individual records containing information collected about persons or households. IPUMS USA, for example, provides access to harmonized microdata from decennial censuses from 1850 to 2010 and American Community Surveys from 2000 to the present, though geographic information for these records is limited compared to summary data. IPUMS also recently announced the release of the Multigenerational Longitudinal Panel (MLP), which links individuals’ records between censuses spanning 1900-1940, with plans to extend back to 1850 in the future.
All IPUMS data products are free and publicly available, though there is a registration process required before gaining access to these data.

IPUMS provides access to various unique historical and contemporary census data products
Licensed Resources
In addition to the public data resources described above, the University Libraries licenses several resources that provide access to census data products in a fairly user-friendly way, especially for beginners. PolicyMap and Social Explorer are two examples, both of which include interactive map viewers that facilitate some geographic exploration of the data without the need to download and import data into a GIS every time. I have worked with instructors in various departments who have incorporated one of these databases into an assignment or recommended them as data sources for student projects. One other important note about Social Explorer is that it includes data tables for the 1970, 1980, 1990, and 2000 decennial censuses normalized to the 2010 census geographies to facilitate longitudinal comparisons, with data available down to the tract level.

Social Explorer has a number of interactive map viewers for exploring census data variables
This list of census data resources is by no means exhaustive, but I hope it will be a good starting point for those looking to use census data products for research, teaching, or class assignments. Have fun exploring these resources, especially if you are new to census data or less familiar with some of the other surveys and programs conducted by the U.S. Census Bureau. And if you are having trouble finding the data you need or have other questions, you can always contact a librarian.
Assistant Professor, Geospatial Information Librarian


