Future of the U.S. Solar Industry

Chart 1: Import TarriffsIn January 2018, the United States established an import tariff on silicon solar cells and modules. These tariffs became effective on February 7, 2018 and will charge foreign producers 30% of the product’s value to enter U.S. markets. The tariffs will drop by 5% annually before expiring in 2022 (Chart 1). The first 2.5 gigawatts of solar cells are exempt from the tariffs (Duke SciPol, 2018). In addition to the solar module and cell tariffs, the U.S. recently announced a 25% tariff on steel imports and a 10% import on aluminum, which could add an additional 2%-5% to PV system costs (GTM Research, 2018).

According to Natter & Martin (2017) in Bloomberg New Energy Finance, the 30% tariff will increase photovoltaic (PV) solar module costs by roughly 10 cent/watt. Based on this estimate, the average module price would be around $0.41 per watt/DC which is still lower than the average module price in 2016 when the U.S. posted a record number of solar capacity installations. The impact of the import tariffs is expected to be more significant on the development of utility scale projects because the module cost accounts for an estimated 32% of the total utility scale solar installation cost. The impact is much less for other solar projects, as the module cost only accounts for 13% of residential installations and 19% of the commercial project (Chart 2).

Chart 2

Potential Implications

Now that the solar import tariffs are established, what are the implications to the solar manufacturers, installers, and consumers? “The tariffs could even the solar playing field from the perspective of manufacturing, but risk U.S. jobs in the solar installation and management industry while negatively impacting global trade agreements (Duke SciPol, 2018).” A tariff is essentially an additional tax applied to goods coming into a country in foreign trade. This will increase the price of the imported goods, thus protecting domestic manufacturers from unfair foreign competitive advantages such as low labor wages, dumping practices, or lower production costs due to lack of comparable environmental and safety regulations. In general, applying an import tariff to imported goods promotes domestic production and supports domestic employment. However, while a tariff can support domestic manufacturing, in some cases, a tariff can also increase the final price of the goods to consumers.

U.S. Solar Manufacturing Updates

Between 2012 and 2016, U.S. domestic PV solar module production expanded by 24 percent. Still, falling prices have caused more than 24 domestic PV producers to file bankruptcy or close their U.S. operations (Congressional Research Service, 2018). Following the implementation of the import tariffs, a 2018 Solar Industry Update Report from the National Renewable Energy Laboratory summarized several examples of recent U.S. solar manufacturing activities. First, JinkoSolar confirmed plans to invest $50 million to build a 400 megawatt module assembly plant in Jacksonville, Florida. In addition, SunPower announced plans to purchase the SolarWorld Americas manufacturing facility in Oregon which offers solar cell production capacity of 430 megawatts with an additional 500 megawatts of module capacity. Finally, due largely to recent U.S. tax reform, First Solar announced a $400 million investment in Ohio and recently broke ground on a 1.2-GW capacity plant, employing 500 workers to manufacture its new Series 6 modules.

U.S. Solar Installation Trends

solar arrayThe United States posted a record year for PV solar installations in 2016 reaching 14.8 gigawatts (DC) of installed solar capacity. Just a year later, the U.S. experienced a 30% decline in installations, with a total of 10.6 gigawatts (DC) of solar capacity additions in 2017 (USDOE/EERE, 2018). Following the 2018 import tariff on solar module and cell imports, the U.S. solar market added 2.5 gigawatts of PV solar in the first quarter 2018, representing annual growth of 13%. Furthermore, the latest U.S. Solar Market Insight Report estimates that “solar’s growth in 2018 will mirror 2017’s 10.6 GW before growing more robustly in 2019 and then accelerating in the early 2020s (Solar Energy Industries Association, 2018).”

What Should We Expect In 2018?

There have been numerous cases made both supporting and contesting the future impacts of the solar import tariffs on the U.S. solar industry. Based on recent installations and pricing trends, I would suggest the industry has proven it can not only survive, but thrive at higher module price points. Remember, in 2016 the U.S. solar industry posted a record number of capacity installations when solar module prices were higher than the estimated 2018 module prices including the impact of the additional 30% import tariff.

By definition, the tariff will absolutely increase the cost of imported solar modules. However, as described above it is a percentage-based tariff that is scheduled to decrease over time. In addition, the cost of solar modules has decreased significantly since 2010, a trend that is expected to continue. As a result, the impact on solar module prices should be the greatest in 2018, then decreasing each year as the actual price of solar modules continues to fall, combined with reduced tariff rates. While the import tariffs will likely reduce the number of utility scale projects, it is important to remember there are other factors affecting solar industry development. For example, state and local government policy and goals as well as utility rules and regulations will greatly influence the future development of renewable energy projects.        

Interested in Learning More About Solar? . . . Join Us at Farm Science Review!

The 2018 Farm Science Review (FSR) is September 18-20 at the Molly Caren Agricultural Center near London, Ohio. Farm Science Review offers visitors the opportunity to learn about the latest agricultural innovations from experts from the College of Food, Agricultural, and Environmental Sciences at The Ohio State University.

If you’re interested in learning more about photovoltaic solar energy and peak energy demand management on your farm, there’s a place just for you at Farm Science Review: Ohio State’s Energy Tent. Inside, you’ll find displays and information on solar energy, peak demand energy, anaerobic digestion (which turns food waste and manure, for example, into biogas), and biobased products and materials, like those made from soybeans and corn. CFAES experts will be on hand and available to answer your questions.

The OSU Energy Tent is located at the corner of Kottman Street and Land Avenue. For additional information, please click here to view the most up-to-date interactive map of the 2018 Farm Science Review exhibit area.

References:

Congressional Research Service. (2018, Feberuary ). Domestic Solar Manufacturing and New U.S. Tariffs. Retrieved from Federation of American Scientists: https://fas.org/sgp/crs/misc/IF10819.pdf

Feldman, D., Hoskins, J., & Margolis, R. (2018, May). Q4 2017/Q1 2018 Solar Industry Update. Retrieved from National Renewable Energy Laboratory : https://www.nrel.gov/docs/fy18osti/71493.pdf

Duke SciPol. “Trump Administration’s Imposition of Tariffs on Imported Solar Cells and Modules” available at http://scipol.duke.edu/content/trump-administrations-imposition-tariffs-imported-solar-cells-and-modules  (03/23/2018).

Natter, A., & Martin, C. (2017). U.S. Solar Developers Relieved at Small Import Tariff Proposals. Retrieved from Bloomberg: https://www.bloomberg.com/news/articles/2017-10-31/u-s-trade-panel-proposes-duties-of-up-to-35-in-solar-case-j9frwy6w

Office of the United States Trade Representative. (2018). Section 201 Cases: Imported Large Residential Washing Machines and Imported Solar Cells and Modules. Washington D.C.: Executive Office of the President.

Pyper, J., 2018.  GTM Research Steel and Aluminum Tariffs Could Add 2 Cents per Watt to Utility-Scale Solar Projects. https://www.greentechmedia.com/articles/read/steel-aluminum-tariffs-could-add-2-cents-per-watt-to-utility-scale-solar#gs.oJRSsU4

Solar Energy Industries Association. (2018). Solar Market Insight Report 2018 Q2. Retrieved from Research and Resources: https://www.seia.org/research-resources/solar-market-insight-report-2018-q2

Solar Energy Industries Association. (2018, June). US Solar Market Adds 2.5 GW of PV in Q1 2018, Growing 13% Year-Over-Year. Retrieved from Solar Energy Industries Association News Center: https://www.seia.org/news/us-solar-market-adds-25-gw-pv-q1-2018-growing-13-year-over-year

U.S. Department of Energy’s Office of Energy Efficiency and Renewable Energy (USDOE/EERE). (2018, May). Quarterly Solar Industry Update. Retrieved from Office of Energy Efficiency and Renewable Energy Solar Energy Technologies Office: https://www.energy.gov/eere/solar/quarterly-solar-industry-update

U.S. Department of Energy, Energy Information Administration (USDOE/EIA), (2018).  Tax credits and solar tariffs affect timing of projected renewable power plant deployment https://www.eia.gov/todayinenergy/detail.php?id=36212


Eric Romich

Eric Romich is an Associate Professor and Extension Field Specialist, Energy Development.

Smart Meters or Smart Users?

We now live in a world driven by access to instant information. In fact, it is estimated that as of January 2018 roughly 95 percent of Americans own a cell phone, including 77 percent of Americans owning smartphones¹. If you own a smartphone, you likely receive numerous notifications ranging from missed calls, texts, email messages, social media posts, meeting reminders, news alerts, and scoring updates from your favorite team. However, have you ever received a notification of high energy prices? What if you could receive a notification that your real-time energy usage was high, with a recommendation to adjust your thermostat to save money on your electric bill? Additionally, what if you had the ability to act on that notification and use your smartphone to adjust your thermostat from anywhere in the world? If you are interested in real-time control over your energy consumption, you will likely have access to this technology in the near future.

smart meter

Smart electric meter

The number of smart electric meters installed in homes, businesses and farms is growing rapidly, reaching nearly half of all U.S. electricity consumers by the end of 2016. While there are a variety of smart meters available, smart electric meters are commonly classified as either Automated Meter Reading (AMR) or Advanced Metering Infrastructure (AMI) equipment. AMR meters only transmit information in one direction from the smart meter to the utility and are primarily used to collect usage data for billing purposes. In comparison, AMI meters provide two-way interaction of real time electric usage data to both the utility and the consumer. AMI meters are used for more than just billing, by providing real time energy consumption data and allowing consumers and/or utilities the ability to control electric loads and shift non-essential loads to non-peak times.

smart meter

Smart electric meter

In Ohio, the integration of AMI smart electric meters has increased rapidly by more than 638 percent annually, growing from 16,631 meters in 2007 to 1,078,554 meters in 2016. In addition, installation of AMR smart electric meters in Ohio has increased by 37 percent annually, growing from 277,489 meters in 2007 to 1,310,925 meters in 2016². In 2016, there was a combined total of 2,389,479 smart meters (AMR & AMI) installed in Ohio, ranking 18th in the nation. While the integration of smart meters is growing rapidly, smart meters still represent only 43 percent of all electric meter infrastructure in Ohio.

smart meters installed in Ohio

The number of smart meters installed in Ohio from 2007-2016.

While the integration of smart meters is growing rapidly, many consumers are unaware of these advances in technology installed at their home! For example, in 2015, a year when residential smart meter adoption was about 44% nationwide, the 2015 Residential Energy Consumption Survey (RECS) conducted by the U.S. Energy Information Administration found only 22% of households reported having a smart meter, while 49% reported not having one, and 29% did not know. Meanwhile, only 8% of households reported being aware that they had access to hourly or daily data, and just 4% said they had accessed or viewed that data³.

As the integration of smart meters continues to increase, we will most likely see an increase in interactive and dynamic pricing models such as Time of Use (TOU) pricing and Real Time Pricing (RTP). TOU pricing programs include different predetermined electricity prices for different seasons, days of the week, or time of the day. In comparison, RTP programs fluctuate more frequently as retail electric rate is based on a formula that reflects real time wholesale prices of electricity.

As new smart meter technology and dynamic pricing models are adopted, consumer behavior will play a major role in determining the total monthly electric bill. For example, simple changes such as running your electric dryer or dishwasher at night could save you money. In recent years, we have relied on energy efficient products to lower utility bills, yet moving forward the greatest impact may come from our willingness to change our actions.

Additional Resources:

AEP Ohio – It’s Your Power App

AEP Ohio –  Your new smart meter: Installation Schedule

American Municipal Power, Inc. – AMP Makes Advanced Metering Services Available to Members

DP&L – You might hear people talking about it, but what is the Smart Grid all about?

Duke Energy Smart Meter – You’re In Control of Your Energy Use

First Energy Smart Meter FAQs

First Energy – What You Can Expect: Meter Installation

NREL – Electric Energy Management in the Smart Home: Perspectives on Enabling Technologies and Consumer Behavior

Ohio’s Electric Cooperative – Innovation Leaders

Smart Electric Power Alliance

_____________________________

¹ Pew Research Center. (2018, February 5). Mobile Fact Sheet. Retrieved from Pew Research Center Internet and Technology: http://www.pewinternet.org/fact-sheet/mobile/

² U.S. Department of Energy, Energy Information Administration (USDOE/EIA). (2017, November 6). Electric power sales, revenue, and energy efficiency Form EIA-861 detailed data files. Retrieved from Independent Statistics and Analysis: https://www.eia.gov/electricity/data/eia861/

³ U.S. Department of Energy, Energy Information Administration (USDOE/EIA). (2017, December 6). Nearly half of all U.S. electricity customers have smart meters. Retrieved from Today In Energy: https://www.eia.gov/todayinenergy/detail.php?id=34012#


Eric Romich

Eric Romich is an Assistant Professor & Extension Field Specialist for Energy Development with OSU Extension.

Can Solar Energy Save Money for your Farm or Business? Tips to Separate Fact from Fiction

Advances in technology and policy mandates that require the installation of photovoltaic (PV) solar have contributed to the reduction of system costs. In recent years, both the power and efficiency of solar panels have steadily improved, while the cost of solar panels have dropped dramatically. According to the National Renewable Energy Laboratory, the average cost to install a commercial PV solar system in the United States has decreased from $5.23 per watt (DC) in 2009 to $2.13 per watt (DC) in 2016[i]. The declining cost of equipment and installation makes installing a solar system enticing for many agricultural producers, and PV panels are an increasingly common sight on farms across Ohio.

The declining cost of installing a PV solar system is enticing for many agricultural producers. However, while solar may provide an attractive payback on some farms, every farm is unique and evaluating the financial viability of investing in solar requires careful consideration of system design, costs, and modeling assumptions.

Key Steps in Project Evaluation:

  • Plan and prepare – Be curious and careful! Investing in on-farm PV solar requires a significant up-front investment that will involve numerous contracts, spanning decades. It is important to review resources and conduct a detailed project assessment before signing any paperwork.
  • Compare and contrast – Secure three or four project quotes to analyze various proposals and modeling assumptions (e.g., system production, net excess generation, energy escalation, incentives, operations and maintenance costs).
  • Research and review – Understand the equipment and shop around! Just as tractors and agricultural equipment have unique features, not all solar projects are created equal. Investigate your various proposals and identify the key difference between the system design, equipment, and warranties (e.g., type and efficiency of solar panel, string inverters or micro inverters, panel warranty, inverter warranty, installation warranty, ground mount or rooftop design, galvanized or stainless fasteners).
  • Discuss and debate – Review the project proposals with your utility provider and your tax professional to evaluate the project assumptions, contracts, and financial implications and/or benefits.

Extension Resources – Solar Electric Investment Analysis Bulletin Series 

Solar Bulletin SeriesEvaluating the financial investment in solar requires careful consideration of system costs, the value of production, and operation and maintenance costs. Unfortunately, some proposals are hard to understand making it difficult to make fully informed investment decisions. To help simplify the key considerations of evaluating a PV solar project, the University of Wyoming and Ohio State University partnered to develop a bulletin series that clarifies the information and assumptions that are essential to the assessment process. The bulletins listed below, are structured as a six-part series arranged to systematically progress the reader through the project evaluation process.

Part 1: Estimating System Production – Site-specific factors such as shading, orientation, tilt, temperature, and panel degradation can influence the amount of electricity produced by a PV solar system.

Part 2: Assessing System Cost – A better understanding of direct system costs, indirect capital costs, operations and maintenance, and standard assumptions provides a more accurate financial analysis, fostering informed investment decisions.

Part 3: Forecasting the Value of Electricity – To calculate energy savings for a project, one must consider important variables, including the details of the individual rate structure and the assumed energy escalation rate that influence the value of electricity a PV system produces.

Part 4: Understanding Incentives – Despite declining costs for PV solar, there are various federal, state, and local incentives which greatly affect the financial viability of a PV installation.

Part 5: Conducting a Financial Analysis – Understanding the solar resource production, system cost, value of electricity, and available incentives enables a robust financial analysis. Accurately evaluating the viability of a solar project requires understanding financial concepts such as simple payback, net present value, and the levelized cost of energy.

Part 6: PV Solar Example – The National Renewable Energy Laboratory developed the System Advisory Model (SAM) to help developers, installers, and potential system owners estimate the system production and financial impacts of renewable energy projects.

These materials are designed to increase participants’ knowledge of PV solar energy development and the financial considerations to guide informed decision-making with future investments. This six-part bulletin series and additional materials are available for download at: energizeohio.osu.edu/farm-solar-energy-development.

Interested in Learning More?….Join Us at Farm Science Review!

The 2017 Farm Science Review (FSR) will be held September 19-21 at the Molly Caren Agricultural Center near London, Ohio. Farm Science Review offers visitors the opportunity to learn about the latest agricultural innovations from experts from the College of Food, Agricultural, and Environmental Sciences at The Ohio State University. The Small Farm Center at the Farm Science Review features 27 educational programs suited to smaller farms, with particular emphasis on alternative enterprises, alternative production systems and alternative marketing strategies.

If you plan to attend the FSR and are interested in additional information on solar energy in agriculture, please join us for the 50-minute presentation titled, Considerations for Investing in Solar Energy for Your Small Farm on Thursday September 21, at 12:00 p.m. at the Small Farms Center Tent located at the corner of Corn Avenue and Beef Street.

For additional information, please click here to review a complete list of educational sessions and demonstrations offered at the 2017 Farm Science Review.

____________________________________________

[i] Fu, R., Chung, D., Lowder, T., Feldman, D., Ardani, K., and Margolis R. (2016).  U.S. Solar Photovoltaic System Cost Benchmark: Q1 2016, National Renewable Energy Laboratory (NREL).


Eric Romich is an Assistant Professor & Extension Field Specialist for Energy Development with OSU Extension.

Considerations for Utility Scale Solar Farm Land Lease Agreements

PSEG Wyandot Solar Farm
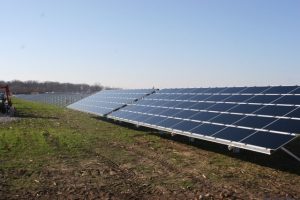
Often heard questions from Ohio farmers these days include “Who is this solar developer?” and “Is a solar land lease agreement good for my farm?”  Well, if you could lease your farmland for $1,200 per acre over 30 years, would you do it? Considering the USDA 2016 National Agricultural Statistics Survey values Ohio cash rent at $160 per acre, this may seem like a rhetorical question. And while on the surface this may seem like a perfectly logical, economic decision, it is important to carefully consider all of the impacts of converting farmland to solar energy production.

As part of an agreement with the Public Utilities Commission of Ohio, AEP Ohio recently committed to developing 400 megawatts of solar in Ohio. In December of 2016, AEP Ohio issued a request for proposals (RFP) to develop up to 100 megawatts of solar energy. In response to the recent RFP, solar developers and representatives from land acquisition firms are contacting farmers and landowners throughout Ohio to secure long-term land lease agreements to site a large utility scale solar farm.

Solar leases are complex long-term commitments with various social, financial, and legal implications. One of the most important components of utility scale solar energy development is the contract between the landowner and the developer, providing site access to the developer. This is often referred to as the solar land lease.

Utility scale solar energy leases are long-term agreements which often range from 20 to 30 years or more. It is crucial that landowners fully understand the details of the agreements to ensure they are adequately compensated and their property rights are protected.

When considering a utility scale solar land lease agreement, do not fall victim to making a rushed decision. Many times, the initial lease is written in favor of the developer to best achieve their long-term interest, flexibility and objectives. Do your homework, conduct a detailed assessment of the developer, the overall project, and seek advice from your tax and legal professionals before signing any paperwork. While every project and lease is unique, below is a list of common issues to consider prior to signing a solar land lease agreement for your farm.

  1. How will a solar lease agreement influence my property taxes?
  2. Are there pre-existing deed restrictions on my farm?
  3. Will a solar project impact my eligibility for Current Agricultural Use Value (CAUV)?
  4. How does a solar land lease impact my property rights?
  5. How will a solar project impact the surface water on my farm?
  6. How is the project decommissioned after the lease expires?
  7. Who is responsible for insurance and liability for the solar project located on my property?
  8. What are the per acre lease rates for utility scale solar projects?
  9. Who will maintain the land?
  10. Is a utility scale solar project subject to the public utility tangible personal property tax?

This blog article has introduced a few of the many of issues to consider before entering into a utility scale solar lease agreement. Landowners approached by a developer to lease their land should carefully consider the legal and tax issues associated with the agreement. Furthermore, landowners are encouraged to work with an attorney that is familiar with energy land leases agreements to negotiate terms representing the landowners long-term interest.

Additional Resources

Eric Romich is an Assistant Professor and Extension Field Specialist for Energy Development.

Please find the answer to the question from the comment below here.

  • “What about a multiplier? $1200 an acre today sounds like a lot of money, but in 20 years it’s worth a lot less. What is the average rate for the multiplier? What should a land owner ask for?”

Ohio Shale Energy Development: Assessing the Economic Opportunities and Risks

Ohio Shale Energy Development 2016-08-11 #2The recent technological advancement in horizontal hydraulic fracturing has unlocked oil and gas resources from shale formations once thought to be uneconomical to recover. According to an article by the U.S. DOE Energy Information Administration, “As a result of growth in production, domestic production is soon expected to surpass domestic consumption of natural gas, and by 2018 the United States becomes a net exporter of natural gas for the first time since the 1950s.”[1]  Ohio is a major contributor to domestic oil and gas development as intense production from the Marcellus and Utica Shale formations continue to expand.

At the local level, oil and gas development can create a boomtown scenario for communities who experience an increase in population, wealth and economic activity due to the sudden shock. Energy-based economies often experience a boom-bust cycle that follows the rise and fall of energy prices. A high performing energy sector often crowds out other sectors from additional growth, promoting a highly specialized regional economy that is dependent on the performance of the energy sector. This contributes to the volatility of the local economy by limiting economic diversification, and thereby impacting long-term economic growth.

Ohio Shale Energy Development 2016-08-11OSU Extension has collaborated with faculty researchers in OSU’s department of Agricultural, Environmental, and Development Economics and the School of Environment and Natural Resources to develop resources that explain how oil and gas development can affect the social, economic, and environmental fabric of a community. A recently published fact sheet series titled, “Shale Energy Development Economic Impact Analysis” is based on the original research from the project “Maximizing the Gains of Old and New Energy Development for America’s Rural Communities.” The materials summarize the project’s research to inform the reader of economic impacts related to energy development.

  1. Ohio Energy Trends: Comparing Old And New Energy Development
  2. Characteristics Of A Boomtown
  3. Contributing Factors To A Boomtown Bust
  4. Developing A Model To Measure Economic Change In An Energy Economy
  5. Local Economic Development Strategies For Energy Boomtowns
  6. Community Planning Strategies For Energy Boomtowns

Readers are provided a background on energy development in Ohio, an investigation into the structural changes that local economies experience when faced with oil and gas development, and planning strategies that interested community stakeholders can employ to nurture long-term community vitality.

For more information, visit Ohioline to review the fact sheet series or contact Eric Romich.

Eric Romich is an Assistant Professor and Ohio State University Extension Field Specialist for Energy Development.


[1] United States Department of Energy, Energy Information Administration (USDOE/EIA) . (2016, June). Most natural gas production growth is expected to come from shale gas and tight oil plays. Retrieved from EIA Today In Energy: http://www.eia.gov/todayinenergy/detail.cfm?id=26552

Growth in PV Solar Results in New Safety Awareness

Solar Safety - panel 2016-03-04

More Ohioans are investing in photovoltaic (PV) solar systems to power their homes, businesses, and agricultural operations than ever before. Photovoltaic solar projects certified by the Public Utilities Commission of Ohio (PUCO) increased from 14 in 2009 to 1,834 in January of 2016. Significant cost reductions, favorable energy policy, and the ‘green’ appeal of PV solar systems help explain the growth in popularity, but the growing popularity is also a cause for concern.

The growth of PV solar systems installed on residential and commercial buildings presents new safety hazards to system owners and emergency first responders. When exposed to light, a grid-tied PV solar system will generate direct current (DC) electricity that travels through wires and combiner boxes to an inverter that converts the energy to alternating current (AC) electricity. The inability to power-down PV solar panels exposed to sunlight creates potential concerns for emergency first responders looking to extinguish a fire. Simply put, when exposed to light, the panels will generate electricity energizing the system’s DC wiring, causing first responders to proceed as if the building is energized.

Solar Disconnect 2016-03-04In response to this safety concern, the 2014 National Electric Code (NEC) developed rapid shutdown standards for PV solar systems on buildings (NEC 2014, Section 690.12). In general terms, the Section 690.12 Rapid Shutdown of PV Systems on Buildings requires that energized conductors (AC or DC) can be de-energized on demand, limiting the energized portion of the conductors to not extend more that 10 feet from the PV array or more than 5 feet within a building. Ohio adopted the 2014 NEC for commercial applications effective January 1, 2015 and residential applications effective February 8, 2016.

To learn more, read the fact sheet posted here.

(Submitted by Eric Romich, Assistant Professor and Extension Field Specialist, Energy Development)

Renewable Energy Workshop – November 4

PSEG solar farm 2015-10-8

Renewable Energy Workshop will include a tour of the 83-acre PSEG solar field in Wyandot County, shown above. (Photo: Ken Chamberlain, CFAES Marketing and Communications)

Ohio’s largest solar farm as well as other ways to go renewable will be featured during a workshop on Wednesday, November 4 from 9 a.m. to 3 p.m. at Vaughn Industries in Carey, Ohio. Speakers will include renewable energy experts from The Ohio State University and the industry. Anyone interested in renewable energy, such as farmers, homeowners, small-business owners, financial and insurance companies, researchers and students, and state and local agency personnel are invited to attend.

Topics include:

  • Solar energy
  • Funding possibilities
  • Growing grasses to make biofuels
  • Producing bioenergy through anaerobic digestion of manure and plant matter

Tour sites include:

  • Vaughn Industries
  • PSEG Solar

For complete information, including session and tour descriptions, speaker bios and registration, read the CFAES news release. Registration is $40 if paid by October 27 ($50 after that date) and includes continental breakfast and lunch.

Workshop flyer & registration form

(Submitted by Eric Romich, Assistant Professor and Extension Field Specialist for Energy Development)

Key Considerations to Help Evaluate an On-Farm Solar Energy Proposal

On-Farm Solar 2015-08-27Agricultural producers are constantly looking for ways to reduce their input cost as a means to stabilize production cost. As energy prices fluctuate and the price of PV (photovoltaic) solar energy continues to fall, more and more farmers are investigating the economics of a PV solar system to generate electricity for their farm. Investing in an on-farm solar system can reduce the amount of electricity a consumer purchases from their electric utility provider, minimizing the impact of future price fluctuations. However, each project is different due to variables such as: energy consumption, energy cost, utility provider, rate schedule and tariffs, system design, components, warranties, and contracts.

Extension educators have a long history of identifying critical issues facing our clientele and providing factual-based information to guide informed decisions. A growing question among many Ohio farmers is, “What is the payback period for a Photovoltaic (PV) solar system on my farm?” Investing in on-farm PV solar typically requires a significant upfront investment that will involve numerous contracts, spanning decades. It is important that anyone considering a PV solar proposal conducts a detailed assessment before signing any paperwork and not fall victim to making a hasty decision.

Below are four tips that will help Extension clientele evaluate a PV solar proposal and the associated impacts of the project to their farm.

Tip # 1 – Understand the details of a proposal:

Proposals for PV solar systems frequently involve numerous contracts and are often difficult to understand. If necessary, ask the developer to put the information in a format that you can understand. The cost of the system (equipment and labor) should be easy to identify and not masked by various tax credits, grants and subsidies to the point it is unclear exactly the project cost. Many PV solar system proposals make it appear as if after all of the financial benefits are assumed, a system can be installed for $5,000 to $10,000 to provide all of the energy for a facility. It is important to remember that although there are financial incentives for renewable energy projects, many of them are in the form of tax credits, depreciation, and energy savings not recognized until after the project is operational. In other words, if the project cost is $100,000, then the owner of the project will need to pay the renewable energy developer $100,000 to install the system.

When reviewing a proposal, make sure to clearly identify the assumptions and/or projection details. Some common assumptions and/or projection details to look for include:

  • What is the factor used to calculate the electricity price escalation?
  • Are competitive grants included in the payback calculation (i.e., a grant that is not guaranteed to be funded)?
  • What inflation rate and discount rate is used?
  • Does the cash flow analysis look at all items on an after-tax basis (e.g., annual electric expense)?
  • Does the analysis include additional cost for insurance?
  • Does the analysis include additional cost operation and maintenance?
  • Does the analysis account for degradation of the panels over time?

Similar to other large capital investments, it is a good idea to secure multiple quotes to identify a company that demonstrates experience in PV solar installations and the local electric utility interconnection process. Green Energy Ohio, a non-profit corporation, has lists of Ohio installers.

Tip #2 – Talk with the utility provider:

Net metering is a billing arrangement allowing customers that produce their own electricity to receive a credit on their electric utility bills for any extra electricity produced by their system that flows back onto the electric utility’s distribution system, and the credit can be used to offset charges in future months. Interconnecting a PV solar system to the distribution grid may present a number of technical issues and challenges that a system owner should discuss with the utility provider before agreeing to install a system.

In addition to the technical challenges, electric bills can be difficult to understand making it hard to evaluate the true impact of a PV solar system on a farmer’s electric bill. In Ohio, a net metering credit is limited to kilowatt-hour (kWh) charges only and will not reimburse system owners for distribution services, transmission services or demand meter charges. In other words, even if a PV solar system generates all of the electricity for a farm, there may still be additional monthly charges that will remain on the system owner’s electric bill. When estimating the electricity savings in a PV solar proposal, it is important to make sure to identify any charges that will remain on the bill and remove them from the equation. It is a good idea to personally contact the local electric utility provider (not communicate through a third party) to review the PV system proposal with them and understand the impact on the electric bill. A list of utility contacts can be found on the Public Utilities Commission of Ohio (PUCO) website.

Tip #3 – Research Solar Renewable Energy Credits:

In 2008 Ohio established alternative portfolio standards that require Ohio’s electric distribution utilities or electric services companies to diversify their electricity generation to include 12½% renewable energy by 2027. Utilities that do not meet the annual benchmarks for renewable generation are subject to compliance payments. However, to comply with the requirement electric distribution utilities or electric services companies can purchase renewable energy credits from other renewable energy producers. Every time a certified renewable energy facility system generates one-megawatt hour of electricity, it also generates one renewable energy credit. A renewable energy credit that is created by solar energy is known as a Solar Renewable Energy Credit (SREC). An electronic database tracks the amount of electricity generated by a solar energy system and the corresponding creation of renewable energy credits. The most common database used to track renewable energy credits in Ohio is the Generation Attribute Tracking System (GATS). There is no assigned value to an SREC, as the prices are influenced by renewable energy policy, supply and demand. For example, in Ohio the GATS solar weighted average price per certificate reached a high price of $471 in 2010 and a low price of $85 in 2015.

The sale of SRECs can generate significant income for system owners, which can help offset the high upfront installation cost. There are a number of different ways a system owner can sell their SRECs. For example, the owner of a system may choose to personally manage the sale of their SRECs as they are generated via a web-based exchange program, enter into an agreement to sell their SRECs to an aggregator or broker, or sell their SRECs directly to the system developer who built their system.

Some PV solar proposals will try to oversimplify the transaction of SRECs by calling it a discount, rebate, payment, allowance or refund. Regardless of what you call an SREC agreement, the value of these agreements is significant, and the terms can extend for 20 years or more. In addition, the sale of an SREC is a taxable transaction and the sale proceeds will be taxed as ordinary income. If a system owner agrees to receive money upfront for the rights to their SRECs, there will typically be a contract associated with the agreement. The complexity of the agreements can vary significantly and it is essential that you receive a copy of the contract before signing any paperwork. Additional information on renewable energy credits is available here.

Tip #4 – Conduct a detailed financial analysis:

It requires a significant capital investment to develop a PV Solar system that should undergo a detailed financial analysis. In many cases, project developers will present a farmer with a summary sheet that shows a simple payback calculation for the project. However, using a simple payback calculation to assess the economic feasibility of a PV solar project has major limitations. The simple payback calculation ignores critical investment factors such as the time value of money, variations in energy prices and alternative investment options. In addition, many of the small details and various assumptions discussed in Tip # 1 above should also be included in a detailed financial analysis.

On-farm PV solar proposals are wide-ranging, complex, and challenging to evaluate in terms of performance and probability. A good practice is to review the proposal with an accountant or financial advisor who can assist in utilizing multiple financial analysis tools (e.g., net present value, Discounted Cash Flow, Internal Rate of Return) to help accurately forecast the future financial performance of a project. In addition, the National Renewable Energy Laboratory of the U.S. Department of Energy has developed cash flow models to help calculate the levelized cost of energy, net present value, payback period, and other financial metrics related to a renewable energy project.

For additional farm-energy resources, please visit go.osu.edu/farmenergy and extension.org/ag_energy.

(Submitted by Eric Romich, Assistant Professor and Extension Field Specialist for Energy Development)

Energize Ohio signature program addresses increasing energy demands

Energize Ohio 2015-03-25The future requires energy; even more energy than is consumed today. Global energy demands rose by 83% from 283 quadrillion British thermal units (Btu) in 1980 to more than 507 quadrillion Btu in 2010. The 2012 International Energy Outlook Report estimates that by 2020, additional growth in worldwide energy consumption will more than double our 1980 usage and grow to 820 quadrillion Btu by 2040. Why? Much of the growth in energy consumption is occurring in developing countries, where countries with strong, established economies drive steady demand. Second only to China, the United States consumed 18% of the world energy total in 2011, and Ohio ranked as the sixth highest energy consuming state in the nation.

Why is energy development in Ohio important? The availability of affordable energy influences both economic growth and the general quality of life of Ohioans. In 2012 the average per capita energy expenditure in Ohio was $4,265, representing roughly 12 percent of Ohioans’ per capita income.

How is Extension involved in helping to ensure the availability of affordable energy? Utilizing a multi-disciplinary approach, the Energize Ohio Signature Program addresses a wide range of renewable and shale energy education needs including: youth energy education, energy policy, farm energy education, homeowner energy education and sustainable community planning. Energize Ohio curriculum consists of teaching outlines, worksheets, presentation materials, workshop materials, bulletins, fact sheets, marketing templates and evaluation tools available for use by all Extension professionals. Two core initiatives are the current Energize Ohio focus: shale energy and renewable energy education.

Last year, Energize Ohio Signature Program team members engaged more than 1,900 participants in 62 programs throughout the state. New energy-related publications were developed as well, including four fact sheets, two journal articles and one technical bulletin.

Since 2012, the Energize Ohio Signature Program has reached nearly 12,000 Ohioans via 141 programs conducted in 64 of Ohio’s 88 counties. The ultimate goal of these efforts:  To increase knowledge of energy drivers and development that enables best practices and informed decision-making.

For more details related to the Energize Ohio program, please view the 2014 Energize Ohio Signature Program Report.

For more information on energy trends, please view the Trend Research: Energy Sources, Demands, and Cost paper found at the FAES Conversations on the Future of Extension webpage.

(Submitted by Eric Romich, Assistant Professor and Extension Field Specialist, Energy Development)

Demonstrate solar energy technology at your next event!

Who doesn’t enjoy the warmth of the sun on a brisk fall day? That warming energy is free, so how do we put it to work for us? To demonstrate solar energy technology, a team of OSU Extension professionals has recently designed and built a Mobile Solar Unit. The unit consists of a 140 watt Photovoltaic (PV) solar panel, charge controller, battery back-up system, 2000 watt inverter and safety disconnects. All of the components are built into a four-wheeled cart (about the size of a grocery cart) that can be transported to events throughout Ohio in the back of a pickup truck.

Mobile Solar Unit
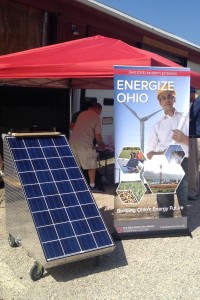
At most any Extension event throughout Ohio, the unit can serve as a teaching tool to demonstrate how PV solar technology works, assist in disseminating renewable energy materials and videos, as well as communicate Extension impacts via short videos. Think about how you might use this demonstration unit at your remote outdoor events, field days, county fairs and 4-H camps where it can power a projector, TV, computer or microphone. As a ready-made charging station for visitors’ cell phones and laptops, the Mobile Solar Unit serves as a great teaching tool at indoor events too.

Although the primary goal was to design a teaching tool that could help demonstrate solar technology, this unit also doubles as a promotional resource that will attract an audience to stop and watch short videos of Extension programs taking place throughout the state. In the absence of sunlight, the unit has a battery backup system designed to run a 32” TV (provided with Mobile Solar Unit) for a minimum of 8 hours.

To reserve the Mobile Solar Unit for one of your events, please fill out the application form on page 2 of this document and email a copy to romich.2@osu.edu.

(Submitted by Eric Romich, Assistant Professor and Extension Field Specialist for Energy Development.)