Aaron Wilson: wilson.1010@osu.edu
|
The 2019 planting season has been challenging for most, devastating for some. We have experienced a number of impactful issues including: late planted small grains in the fall, followed by winter injury and water damage, late or no planting of corn and soybeans this spring, a lack of forages across the state, impacts on fruits and vegetables, and a general disruption to the agricultural production cycle including planting, spraying, and eventually harvesting. It is important to take a moment and recap from a weather perspective, how did we get here? The following information summarizes the climate of the last year and a half that has played some role in the current struggle our farmers face today. Spring 2018To begin, we will start in the spring of 2018. From a climate perspective, spring 2018 was nothing of particular significance, as temperatures were marginally above normal with above normal rainfall. However, the season was marked by extreme weather variability as April was the ninth coldest for the state of Ohio followed by the warmest May on record dating back to 1895. This warmer, dry May led to a rapid planting season for most of Ohio. However, across far northern Ohio, conditions were delayed significantly due to continued cool conditions and precipitation running 125-200% of normal for May (Fig.1). Summer 2018June 2018 ranks as the 4th warmest and summer 2018 ranks as the 17th warmest on record for Ohio since 1895. This warmth was largely driven by overnight low temperatures, with many nights remaining above 70°F. While this was great for the accumulation of growing degree days and therefore corn and soybean conditions, dry conditions across northwest Ohio during July (Fig. 2) greatly impacted producers still trying to catch up from the cold, wet spring. By July’s end, some damage had already been done, especially to hay and vegetable growers. |
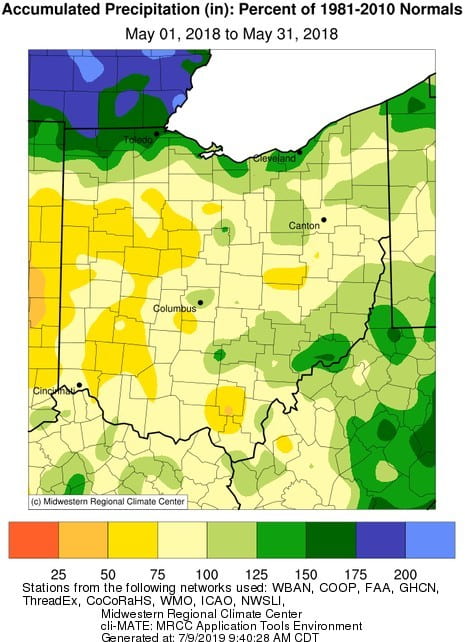 Figure 1. Departure from normal precipitation for May 2018, noted as a percentage of the normal value for 1981- 2010.  Figure 2. Departure from normal precipitation for July 2018, noted as a percentage of the normal values for 1981- 2010. |
Autumn 2018
The autumn of 2018 was heavily influenced by tropical activity with the arrivals of the remnants of Tropical Storm Gordon and Hurricane Florence during September. While it was the warmest September on record for Ohio, these rainy systems pushed September to the 2nd wettest on record. This was eventually followed by a wet, cold November, leaving autumn 2018 ranked as the third wettest on record.

Figure 3. Calculated soil moisture ranking percentile for November 2018 from the NOAA Climate Prediction Center.
As promising as the October dry weather was for harvesting, the wet autumn had significant impacts on harvest, particularly soybeans which were already lagging and many farmers faced disease, fungus, and grain-quality issues as crops remained in the fields well into winter. This wet fall really set the stage for continued problems throughout the winter and spring seasons of 2019. Soil moisture differences compared to average by the end of November were already in the 90th percentile or above (Fig. 3), meaning that by the end of fall, soil moisture was already within the top 10 percent on record. Ohio was not alone, with widespread saturated soil conditions across much of the mid-Atlantic and Midwest, which would eventually play a role in the wet spring conditions across Ohio as well.
|
Winter 2019Like the autumn of 2018, the winter of 2019 was wet, especially across the southern half of Ohio. Winter 2019 ranks as the 11th wettest on record for Ohio, with precipitation 150-200% above average along and south of about I-70 (Fig. 4). Only the far northwestern counties (Williams, Fulton, Lucas, Wood, and Ottawa) experienced below average precipitation for the winter. This led to persistently high stream flows and pushed soil moisture well into the 99th percentile for the southern part of Ohio. Winter temperatures averaged above normal, mainly the result of a warm December and February. However, a short period of intense cold occurred during January, with frequent freeze-thaw cycles. An example of the December – February daily highs, lows, and precipitation for Wooster, Ohio is provided in Figure 5. This led to extreme heaving, noted during late winter scouting by Rory Lewandowski, Wayne County Extension Educator for Ag and Natural Resources (Fig. 6).
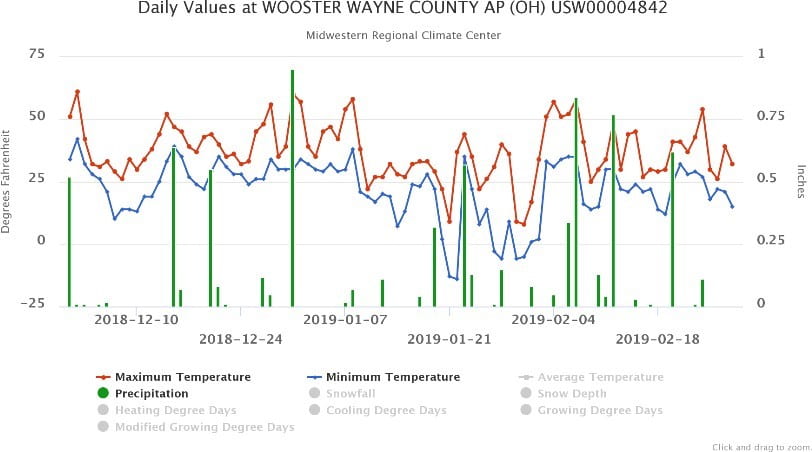 Figure 5. Daily highs, lows, and precipitation for Wooster, Ohio for December 2018 – February 2019. |
 Figure 4. Departure from normal precipitation for winter (December – February) 2019, noted as a percentage of the normal values for 1981-2010. 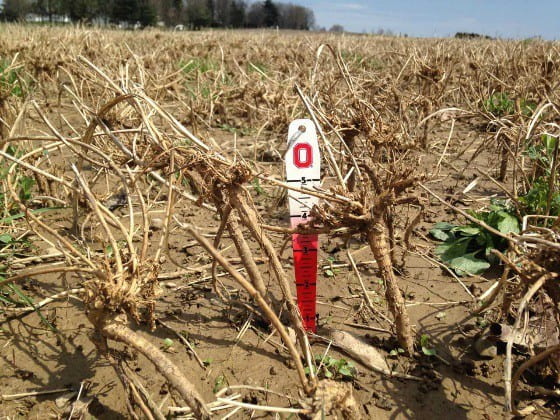 Figure 6. An example of alfalfa heaving in northeast Ohio following the winter of 2019. Photo courtesy of Rory Lewandowski.
|
Spring 2019

Figure 7. An example of alfalfa stand coming into spring 2019 in Auglaize County Ohio. Photo courtesy of Jeff Stachler.
To summarize, we came out of winter and into March with poor stands in wheat and forages (Fig. 7), along with extremely saturated soils, especially across the southern portion of the state. Climatologically speaking, March- May 2019 only ranks as the 36th warmest and 32nd wettest for the state. However, spring rains targeted west- central and northwest Ohio. These two areas rank as 7th and 3rd wettest on record, respectively. Near St. Marys, Ohio in Auglaize County, a Community Collaborative Rain, Hail, and Snow Network (cocorahs.org) observer reported over 20 inches of precipitation between March 1 and May 31, that’s over half of their normal yearly rainfall in just three months. They were not alone however, as multiple observers across west-central and northwest Ohio reported in excess of 15 inches of precipitation for the season. The frequency of the rainfall was also problematic, with many stations reporting 20-26 days of at least a trace of precipitation during the month of May. According to Cheryl Turner, statistician with NASS, Ohio had approximately 7 days suitable for fieldwork during the month of May. This left planters out of the field, not to mention those still needing to complete fieldwork that they were unable to do so since the autumn of 2018. To put the weather of the past year into perspective, June 2018 through May 2019 was the wettest June- May 12-month period on record for Ohio, with the state averaging just over 51 inches of rainfall or 12 inches above average.
Summer 2019
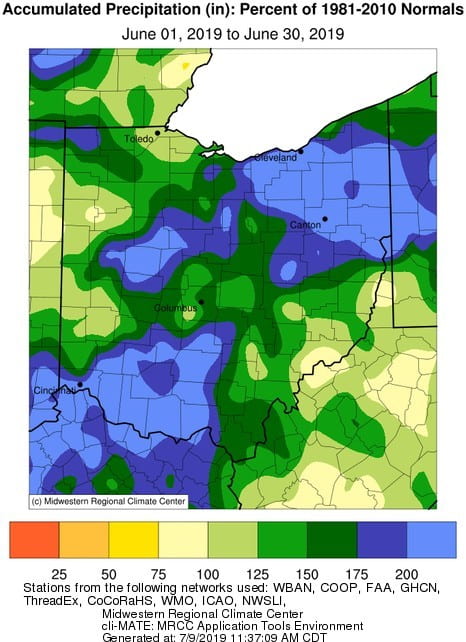
Figure 8. Departure from normal precipitation for June 2019, noted as a percentage of the normal values for 1981- 2010.
The summer 2019 started off much like the last 12 months, with June ranked as the 5th wettest June on record, but a tad on the cool side of average. June 2019 saw many areas of Ohio receive greater than 200% of normal precipitation (Fig. 8; light blue shading). Some locations in northeast Ohio (e.g., Mogadore, Shaker Heights) picked up over 10 inches of rainfall for the month. This ranks as the second wettest June on record for the northeast, only behind that of 2015 and just ahead of 2013. July 2018 – June 2019 period was the wettest July to June 12-month period on record for Ohio, with just over 52 inches on average for the state or more than 13 inches above average. This was following by the wettest August to July 12-month period on record, as well.
Wheat harvested across the state returned fairly low yields due to the poor quality stands earlier in the season, with concern for high levels of vomitoxin. For corn and soybeans that were planted, much of it late into the season (June), this crop experienced normal insect and disease issues along with added heat stress from the early-July warmth. July temperatures turned quite a bit above average, running 2 to 8 degrees warmer than the long-term means. Much of this warmer-than-average temperature centered over northeast Ohio, a likely result of the lack of crop cover in this area. Corn is efficient at pulling moisture from below the surface, transpiring this moisture through its leaves, where it evaporates into the air, leaving the near-surface atmosphere with more water vapor. With much below normal corn cover this year, less water vapor in the atmosphere means less cooling effect locally. Likewise, the lack of canopy means the solar radiation reaches the surface easier and efficiently dries out the surface, leaving it crusted and difficult for planted or re-planted soybeans to emerge.

Figure 9. Departure from normal precipitation for July-August 2019, noted as a percentage of the normal values for 1981-2010.
Corn that had emerged, especially the late planted crop at v6 or less stage at the first of July, already showed considerable heat stress in some areas of the state (west central and central Ohio). This was made worse by persistent drying conditions across the northern Miami Valley, west central, and central Ohio (Fig 9.) Precipitation for this two-month period averaged only 50-75 percent of normal, with this area only receiving 4-6 inches of total precipitation during this time. As a result, the U.S. Drought Monitor downgraded parts of Miami, Montgomery, Champaign, Clark, Greene, and Madison Counties into low-level, moderate drought conditions on September 12. Crops are currently in various stages of maturity, most lagging well behind their 5-year averages according to NASS. Hope going into autumn is in receiving enough growing degree days (heating units) to push the late planted crops to maturity, and dry conditions to help bring down the moisture content.
Updated: 9/13/2019