EDIT 01/02/2022: Ni hao leute, Happy New Years. I just wanted provide a quick update on this. In short, this project is almost done. The python package is publish on the pypi test site. Just need a few finishing touches and I will release the beta on the main pypi. Hopefully within a week. Then I’ll make a new post with tutorial video.
Here are the links to the github repo and colab notebook. Also some pictures.

The “saddle” in dark mode

The “saddle” in light mode
Below is a showcase of a basic interactive 3D graphing tool to be used on Google Colab. It may work with local Jupyter notebooks with additional network configurations but that’s not the goal of this project. The only caveat is that the user has to know Python. But Python is super easy to learn and according to IEEE, it is the top programming language with academia and scientific researchers. So, it goes along with the model of making an easy to use and visually stunning graph tool accessible to anyone with a web browsers. The grapher can be used now but there are still tweaks and addition configs I need to make before I make a pip package and make it public.
Both screenshots are actual outputs from the grapher.
$$\eta = x – t$$
$$f(\eta) = 1 – tanh^2(\eta)$$ in “light” mode.
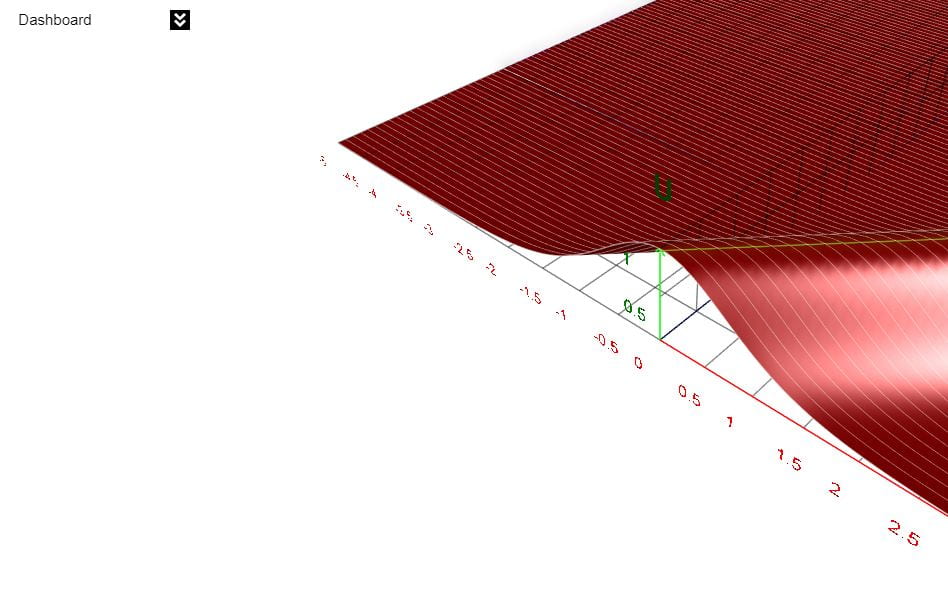
$$g(\eta) = \eta^2$$ in “dark” mode.

Here’s the link to the Colab notebook