Costs and returns: By the numbers

By Dianne Shoemaker

We are starting 2016 with Class III milk prices dipping into the $13 per cwt range for multiple months in the futures market. (Compare to the annual averages of $15.80 for 2015 and $22.34 for 2014). We last saw $13 for several months in 2010 and January of 2011. This sure means something for Ohio dairy farms, but what?

Thirty-eight Ohio dairy farms completed whole farm and enterprise analysis for 2014. This investment pays them back with tools to identify strengths and areas for improvement across their farm. We remember 2014 as the brief time when milk prices were at an all-time high…rapidly followed by 2015 with milk prices falling to 5-year lows.

2014’s returns were phenomenal. Looking at Table 1, the average net return per cow for all herds was $1,266 per cow. This was higher than the average per-cow returns for the previous 3 years added together! These returns are not just cash heading to the bank or the dealership for a new truck; they have work to do. With the net returns, the farms have to pay themselves. Hired labor is already deducted from these net returns, but the owner’s labor and management is not. They are also used to make principal payments, pay income taxes, save for retirement, and reinvest in the farm businesses.

Table 1: Comparison of total cost of production per cwt. and net return per cow, 2011 – 2014 Ohio Dairy Farm Business Analysis. Raised feed valued at cost of production.

Jan Costs and Returns


The most pressing challenge we see in Table 1 comes when we look at the total cost of producing a hundred pounds (cwt.) of milk. For the past 4 years, it averaged $19.66 for these Ohio farms. This cost is already reduced by the income received for the sale of bull calves, cull cows, etc. The only non-cash cost is a depreciation charge for the use of the farm’s machinery and equipment (7% of the inventory value used for the dairy enterprise), titled vehicles (15%), and buildings and improvements (5%).

On the farm, we have received an average of about 85 cents per cwt above the Class III price for our milk in Federal Order 33. The analysis farms have also received an average of $2.20 more per cwt between 2011 and 2014. These additional dollars came from combinations of higher components, quality and quantity premiums, and over-order premiums. Add all that up, and many farms are going to come up anywhere from $1 to $3 per cwt short of the cash cost of producing milk, say nothing of the unpaid labor, principal payments, etc.

How to target cost savings will be the subject of my next column.  To learn more, download the complete 2014 Dairy and Crop Enterprise Analysis Summaries from farmprofitability.osu.edu.

2016 Farm Management Series

This series of meetings is intended for any farmers/couples who are planning a new farm enterprise and more experienced farmers who wish to improve their farm management skills and better analyze and benchmark their farm enterprises against other similar farm businesses.

The 2016 Farm Management Series will be offered at 3 locatons :

Darke County

7:00 P.M. Thursdays , January 7, 14, 21, 28 and February 4, 2016

Meetings will be held at:

   Andersons Maration Ethonol

   5728 Sebring Warner Road.

   Greenville, Ohio 45331

Topics covered:

  • What Is the Mission of Your Farming Operation?
    • Making Record Keeping Do More Than the Tax Return
  • Developing Your Balance Sheet
    • Basics of Finance
  • Developing Your Business Plan
  • Farm Transition Planning
  • Ag Law 101

~Participation limited to the first 50 paid registrations~

Registration form: 2016 Farm Management School Flyer Darke Co.


Wayne County

7:00 P.M. Thursdays, January 7, 14, 21, 28 and February 4, 2016

Meetings will be held at:

Commissioner’s Meeting Room

    Wayne County Administraion Building

     428 W. Liberty St.

     Wooster, Ohio 44691

Topics Covered:

  • What Is the Mission of Your Farming Operation?
    • Making Record Keeping Do More Than the Tax Return
  • Developing Your Balance Sheet
    • Basics of Finance
  • Developing Your Business Plan
    • Analyzing Business Performance
  • Farm Transition Planning
  • Ag Law 101

~Participation limited to the first 30 paid participants~

Registration form: 2016 Farm Management Seminar Flyer, Wooster


Fulton County

6:30 P.M. Tuesday, February 2, 9, 16, and 23, 2016

Meetings will be held at:

   Robert Fulton Ag Center

   8770 State Route 108

   Wauseon, Ohio 43567

Topics covered:

  • Making Your Records Do More than Taxes
    • #knowyournumbers (Farm Benchmarking I)
  • Developing Your Farm’s Business Plan
    • #farmexpensediet (FBM II)
  • Grain Marketing & Crop Insurance Strategies
    • #dontgobrokebreakingeven (FBM III)
  • Options for Paying Members in a Farm LLC
    • #farmanotheryear (FMB IV)


Registration form: 2016 NextGen Farm Management Flyer 12-11-2015 Fulton Co.


Dairymen, all it takes is 30 seconds… Small investments can give you more financial control

Dianne Shoemaker, Field Specialist Dairy Production Economics

Originally published in the October 15, 2015 issue of Farm and Dairy, Dairy Excel Column.


What difference can 30 seconds make? A lot. When a team starts working on their business analysis for 2015, 30 second investments that will make the process easier and the results more reliable:

Crop expenses

These are the most ignored expenses on dairy farms.   It is relatively simple to calculate total crop expenses for a farm for a year, but how useful is that information? With tight margins, how can total crop expenses be used to find opportunities to control costs? They can’t.   Only when they can be allocated between crops can those costs per acre and per ton or bushel be used to identify strengths and concerns.

When invoices come in for seed, chemicals, fertilizer, custom work, or supplies, grab them and jot down what crops they apply to. This is a job for the crop people who should be crossing paths with the bookkeeping people to make sure this information is getting into the system. Also verify that the items being billed were actually delivered and used on your farm.

Acreage use

Acres and yields of each crop are needed to take that next step of determining costs per acre or per ton or bushel.  Jot down acres as crops are planted or harvested. How many acres were rented, how many acres were owned for each crop? Which acres were double cropped? With what?

Crop yields

Jot down yields as crops are harvested. The most common reason for not tracking harvest numbers is the challenge of measuring. Some yields are easy…as long as the counter works on the baler and someone reads and records the counts. Others are more challenging, but doable with a little creativity.

Silage and hay yields were simple to measure when it was all blown into an upright silo. Wait for the silage to settle and check the silo chart. Silage bags are relatively easy to measure with charts as well. The most challenging are silages put into bunkers and piles, especially when they are stacked well above sidewalls. Safety aside, packing density and pile shape can make it very challenging to come up with accurate measurements, especially if there was already other silage in the structure.

An alternative would be to measure silage going into the pile. Some farms have the ability to weigh each load going in. Awesome! Just remember to add it all up and record the final yield. If weighing every load is not an option, weigh a few loads, calculate an average weight for a full load, and count loads going in.

On the surface, acres, costs and yields seem to be simple numbers. Yet too many good farms don’t have reliable systems in place to capture them. These numbers can be relatively easily tracked if the folks involved in these activities would invest those precious 30 seconds…

Breaking Down Cost of Production

Dianne Shoemaker, Field Specialist Dairy Production Economics

Originally published in the September 17, 2015 issue of Farm and Dairy, Dairy Excel Column.


“The mystery of the disappearing dollars” Sounds like the title of a Scooby Doo mystery my son, Ben, would have read in the fifth grade; or “where have all the dollars gone…” hummed to the tune of a 1960s folk song. Silly, yes; yet they refer to a very real situation on dairy farms today. Where are the dollars going?

Let’s turn to the Ohio Dairy Farm Business Analysis Summary for some clues. In the September 3rd column, we looked at the big picture costs of production including feed, direct, and indirect costs. Feed costs are clearly number one with total average feed costs making up more than 57% of total direct and indirect costs for 35 Ohio dairy farms in 2013. Averages are interesting and sometimes useful, but how do they apply to farms of different sizes?

Fortunately, we are able to break out income and expenses by herd size for the Ohio data:

Table 1: 2013 Ohio Farm Business Analysis and Benchmarking Dairy Summary. Costs and net return by herd size

chart

~click photo to enlarge~

As a percent of both direct and total costs, feed costs are the number one cost on farms of all sizes, ranging from 56 to 63 percent of total direct and indirect costs. These costs include purchased feeds and the total cost of production for all raised feeds fed to the milking cows, dry cows and all replacements. These costs should include all the expenses for feed lost to shrink through all growing, harvesting, storing and feeding processes. Even though the cows didn’t eat it, someone has to cover the cost and on a dairy farm that is the cows.

On every farm there are opportunities to lower feed costs by identifying and fixing where feed is lost (nothing I hate more than driving by a field where corn or hay is being chopped and watching forage be blown on the ground when the chopper turns and the blower is not adjusted to keep blowing into the wagon.) Other areas include feed lost to poorly applied silo covers, torn bags or wraps on bales, spillage during mixing and delivery, etc.

Interestingly, hired labor is the number two cost across all farm sizes, ranging from 6% on the smallest farms to 12% on the largest. It is only when we get to the 3rd and 4th highest costs that we see any variation between farm sizes. For all but the herds with 201 to 500 cows, depreciation is the #3 cost and Supplies is #4. They are switched for the 201 to 500 cow herds. These two costs make up 8 to 10% of total costs.

Depreciation is not a direct cash cost – no one writes a check made out to “Depreciation”, but it represents the use of the resources of the business, and for farms with debt on these items, it may be somewhat representative of scheduled principal payments.

The last six categories of the top 10 expenses on dairy farms are much less uniform. Table 2 shows how they sorted out for 35 Ohio dairy farms in 2013. There were numerous ties, indicated by shaded items in the same column. A key to note here is that the items ranked 6th through 10th made up only 1 to 3.6% of total expenses.

September 2015 Breaking down cost of production pic 2

~click photo to enlarge~

As your team looks for your farm’s disappearing dollars, feed is an obvious place to start. If your silage isn’t already “in the bag” or bunker or upright silo, getting it in at the right moisture, packed correctly, using an appropriate inoculant (check out Dairy Issue Brief #8-09 “In this time of tight cash flow, should I use silage additives this year?” at http://dairy.osu.edu) will go a long way towards controlling next year’s feed costs. Look for opportunities to reduce shrink and work with your nutritionist to feed a well-balanced ration.

Don’t ignore other costs. Feed costs are certainly in the crosshairs, but all of the dollars are not disappearing into the feed mixer. In the next column we will look at using benchmarking charts to pinpoint other areas that may be siphoning off dollars on your farm.

Considering Cost of Production

Dianne Shoemaker, Field Specialist Dairy Production Economics

Originally Published in the August 27, 2015 issue of Farm and Dairy, Dairy Excel Column


2014’s milk prices were really nice. 2015’s not so much. With an opportunity to stash some cash in 2014, it took a while for many farms to feel how tight this year’s margins really are. The quirky thing is that 2014 prices were subject to dramatic swings with a $4.74 difference between the highest and lowest Class III prices compared to a mere $1.14 range through July this year.

Why didn’t we notice those swings?

Between April and June of 2014, the Class III price dropped $2.95 per cwt. One reason we didn’t notice so much was that the April 2014 Class III price was $24.31 per cwt., and even with a nearly $3 drop, it was still above $20. However, the other reason was that the Producer Price Differentials (PPDs) in 2014 were very strong in the second and third quarters, masking the dropping Class III prices. With the PPDs increasing from $0.17 per cwt in April to $1.85 per cwt in June, that nearly $3 drop in Class III was softened to a $1.27 per cwt decrease in the milk check received at the farm. (The Class III price plus the PPD equals the base per-hundredweight (cwt) price for farms producing Grade A milk, referred to as the Statistical Uniform Price or SUP.)

Fast forward to today.

The Class III milk price, which averaged $24.49 for the first 6 months of 2014, averaged only $15.99 for the first 6 months of 2015. The PPD which averaged $0.90 per cwt for the first 6 months of 2015 averaged exactly $0.00 (yes, zero) for January through June this year. The result? At the farm, the average SUP (Class III + PPD) received for Grade A milk for the first six months went from $23.49 per cwt in 2014 to $15.99 per cwt in 2015.

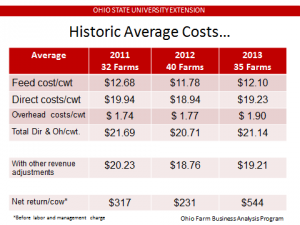
How does this income compare to the costs to produce a cwt of milk? In a word, pitifully. Looking at 3 years of dairy farm data from the Ohio Farm Business Analysis and Benchmarking program, total feed costs ranged from a low of $11.78 per cwt in 2012 to a high of $12.68 in 2011. Even with moderating feed prices, feed costs will take the lion’s share of many milk checks this year. These feed costs include feeding the adult cow herd, the replacement cow herd and feed shrink; in other words, total feed costs.

To put milk in the bulk tank takes more than feed. Other direct costs include breeding, veterinary, supplies, fuel and oil, repairs, hired labor, utilities, hauling and trucking, marketing, bedding, operating interest, etc. Adding together feed and all of the other direct costs, total direct costs averaged $19.37 per cwt on 107 Ohio farms from 2011 to 2013. Now add in the indirect costs including interest on intermediate and long term loans, insurance, and depreciation, and we have average total direct and indirect costs of $21.18 per cwt. for the same farms.

It doesn’t take a math genius to see that direct costs averaging $19.37 per cwt cannot be covered by a milk check starting at $15.99 per cwt. Quality premiums have been declining and will not make up the shortfall on the farm. Very strong cull cow and bull calf prices have helped this spring. However even that cannot compensate for the substantial price drop. Total direct and overhead costs adjusted for this expected income stream (other revenue adjustments) averaged $19.40 for 2011 through 2013 for all farms. Still well above our current prices.

No farm untouched.

So how about the top 20% of the farms in the Ohio Farm Business Analysis summary? They are certainly in a better position to weather 2015’s dismal prices. With their historic average direct plus overhead cost of production at $18.28 per cwt and their total cost of production with other revenue adjustments (remember those cull cow, cull heifer, bull calf and breeding stock sales) at $16.10/cwt, margins are micro-thin but still potentially positive.

Prices are poor and don’t appear to be heading up any time soon. To set realistic goals regarding your farm’s costs of production, you have to know where you are starting from. Then you have the opportunity look for strengths and find opportunities to realistically control costs without hurting milk production. We will take a closer look at using Ohio’s benchmarking reports in a future column. Meanwhile, farmers who have participated in the Farm Business Analysis can pull out and use their personalized reports while other farms can find the reports at http://farmprofitability.osu.edu Click on the “Ohio Farm Business Summaries tab to find the annual summaries and benchmarking reports.


August 2015 Considering Cost of Production first picture

~Click on either picture to enlarge~

August 2015 Considering Cost of Production 2nd picture

What are we asking cows to do?

June 3rd, 2015 by Dianne Shoemaker

Dairy Excel Column

For 5/14/2015 Issue

Farm and Dairy


Debt

Debt.  A four-letter word, but not necessarily a “bad” word.  The majority of Ohio’s dairy farms have debt, and it makes good business sense for them to have debt and manage it wisely.  Our farms grow when additional returns generated by a carefully planned investment made using borrowed dollars exceed the interest owed on the loan.  That “growth” may be growth in farm size, or it may be growth in ability to produce milk efficiently.

We are fortunate in Ohio to have more than one lending institution that wants to have dairy farms as part of their portfolio.  This gives farmers an opportunity to shop for their borrowing needs among cooperative lenders such as Farm Credit or Ag Credit, privately owned community banks as well as larger commercial banks.

Managing debt at the farm level is important to the long-term profitability of a farm, and we will wrap up our discussion of debt looking at what we ask our cows to repay each year.  Our earlier discussions this year focused on what we can learn from the farm’s balance sheet.  Today, we will use balance sheet information as well as the dairy farm’s total revenues to evaluate what we are asking cows to do.

Table 1 shows the repayment schedule measures from the “15 Measures of Dairy Farm Competitiveness” calculated for the 35 farms that participated in the 2013 Ohio Farm Business Summary (farms are working on their 2014 analysis now).


Table 1.  2013 Ohio Dairy Farm Business Summary.  Repayment Schedule.

Debt Per Cow


Scheduled debt payment per cow simply takes the total scheduled principal and interest payments, plus any capital lease payments (these would be for buildings, machinery, equipment, or livestock – not land rent) for a year and divides it by the number of cows (milking and dry).  These are the dollars that we are committing, up front, to making principal and interest payments from the dollars generated by a cow in our herd.  Historically, we would like to see this number at $500 per cow or less.  Interestingly, the top 20% of farms have a higher scheduled debt payment per cow than the average of all farms.  Is this a problem?  We have to look at the bigger picture to decide.

When we look at the scheduled debt payments as a percentage of the farm’s gross receipts, the top 20% of farms are generating more dollars per cow, and 3.48% of their gross income is committed to scheduled principal and interest payments, nearly half of the 6.5% committed for all farms.  With a goal of less than 15% of gross revenues being obligated to repaying scheduled debt (this does not include the farm’s line of credit or accounts payable), both groups of farms are in good shape in this respect.

These are just a few of the important numbers you should know about your farm business.  Analysis of your farm business is available through the Ohio Farm Business and Benchmarking Program.  If your farm records are good, you can start right into an analysis of 2014.  The Ready, Set, Go! Program is available this year to work towards an analysis of 2015.  Contact us to talk about what would work well for your farm at 330.533.5538 or shoemaker.3@osu.edu.


Shoemaker, Dianne. “What are we asking cows to do?” Farm and Dairy 14May2015. Print.

Knowing your farm’s numbers will help you plan for low milk prices

Dairy Excel Column

For February 12, 2015 Issue

Farm and Dairy


how will farm fareIt is discussed everywhere.  In hard copy, in the coffee shop, and on the internet.  2015 will not be the year that 2014 was.  Class III milk prices averaged $22.34 per cwt in 2014., the highest year ever, and $4.35 per cwt. higher than 2013’s $17.99.


How well each farm will fare through the coming year of substantially lower milk prices will be heavily influenced by the financial health of the farm going in.  Cash or near-cash reserves will be tapped.   Cash is cash, but what is near-cash?  Here we are looking at the Current Assets (CA) of the farm business.  These include cash, savings, pre-paid expenses, accounts receivable, crop and feed inventories, supplies, and any market livestock such as bull calves and steers; items that will be used in the coming year to produce crops and milk.


So how do we evaluate the farm’s cash position, or liquidity – the ability to buy what is necessary to grow crops and make milk and pay the bills- when they are due?  Three simple measures.  Current ratio, working capital, and working capital to gross income.  These are calculated using the farm’s balance sheet.


Table 1. 2013 Ohio Dairy Farm Business Analysis, Top 20% sorted by net return per cow. Liquidity

Current Ratio

Here we are comparing the current assets to the current liabilities of the farm.  Current liabilities (CL) include any bills the farm owes including the “usual” monthly bills and any other bills owed including credit cards. CL also includes balances on lines of credit, and the principal due on any term debt in the next 12 months.


So after we divide CA by CL, we would like to see a current ratio of at least 1.5 which means there is at least $1.50 of current assets for every $1.00 of current liabilities.  Higher is better!


Working Capital

This one is about as simple as it gets.  CA minus CL. It needs to be positive, and the bigger the better.  How big is enough?  Read on.


Working Capital Compared to Gross Income

Now we take the working capital and compare it to the gross income generated by the business.  We would like to see working capital of 25% or more.  Is this all cash?  No, remember that we are looking at all of the current assets.  For dairy farms, a great deal of working capital will be tied up in feed inventories and prepaid expenses as well as cash.


Looking at these measures for the 35 Ohio dairy farms that completed their farm business analysis for 2013 (Table 1), all farms and the top 20% of farms had excellent current ratios (CR), but the top 20% have a CR more than twice as high as the average of all the farms.


Both groups of farms also have large, positive working capital figures, but when we take that next step of comparing working capital to gross income, it is clear that the top 20% have the advantage going into 2015 with working capital of 32.4% of their gross sales compared to all farms with working capital of almost 19%.


These are some important, basic numbers that each farm should know for their farm business.


If your current system does not allow this sort of analysis, 2014/2015 is a prime time to join the Ohio Farm Business and Benchmarking program.  There are two ways to participate depending on what records and information you kept in 2014.  If you have good records, you can start right into an analysis of 2014.  If existing records aren’t so good, you can work towards an analysis of 2015.


Cost is minimal due to generous grant funding, at only $100 per farm for either method.  Visit http://farmprofitability.osu.edu to view past analyses and find out more about Ohio’s program. Contact us to talk about what would work well for your farm at 330.533.5538 or shoemaker.3@osu.edu.


Shoemaker, Dianne. “Knowing your farm’s numbers will help you plan for low milk prices.” Farm and Dairy 12 February 2015. Print.

OSU Extension Planning Meetings to Help Dairymen Assess Options

June 3rd, 2015 by Christina Benton

Two short years ago, in July, we were focused on harvesting drought-stressed corn for silage in many parts of the state.

This year, we anxiously review weather apps hoping to see projections for sun, or at least no rain clouds, for three consecutive days in hopes of making some hay.

What a change a year or two will make.

Another horizon to watch

Additional changes loom on the horizon for both crop and dairy farms as provisions of the 2014 farm bill are implemented.

There are some general “knowns,” and a multitude of “unknowns” as the process moves from the legislation passed this spring through the rule making and implementation stages.

The USDA’s Farm Services Agency is tasked with developing the process and procedures through which the farm bill’s provisions will be implemented.

sep 1st

Circle Sept. 1

For dairy producers, the farm bill indicates that the rules are to be in place by September 1.

On the milk production side, farms will have to decide to participate or not to participate in the Dairy Producer Margin Protection Program (DPMPP). Existing “price support” programs will expire.

If dairy farms choose to participate in the DPMPP, the next decision will be at what level to participate. Specifically, what percent of their base production, and what level of margin protection.

If farms choose not to participate in this program, then they are free to look at other ways of managing price risk including futures and options, livestock gross margin insurance for dairy, or accepting whatever the cash market brings.

Crop side

On the crop side, there will be other decisions facing farm managers. The first decision will concern base acres and yields, and whether a farm wants to adjust their base yields.

The second decision relates to program participation, ARC or PLC.

Still in works

If the details are sketchy here, there are two reasons: as with dairy, rules are being developed now, and my limited understanding of farm bill issues and programs related to crops.

August meetings

To help Ohio’s agriculture community sort through the issues, information, and software tools that will be released later this summer and fall, OSU Extension is developing programs and workshops with partners across Ohio.

The first series of meetings focuses on general farm bill provisions and is a collaboration with Farm Credit Services, Ohio Farm Service Agency, and Farm Bureau. These will be held in August, on the 18th in Wooster, and the 19th in Defiance, and Wilmington.

Contact your local Extension office for more information.

More meetings

To specifically address the Dairy Margin Protection Program, we have planned a multi-pronged approach. Regional workshops focusing on rules and implementation will be held in September, on the 3rd in Mercer County, the 11th in Mahoning County, and the 15th in Wayne County.

The software tools available to assist in decision making will be demonstrated.

Follow-up meetings will be scheduled across Ohio to assist farms with use of these software tools and evaluating participation alternatives for both the crop and dairy programs.

For farms that are not interested in participating in the DPMPP, the Ohio Dairy Producers will be offering meetings with brokers and cooperatives that offer assistance with futures and options as well as LGM-Dairy margin insurance.

There are currently many questions about how these farm bill provisions will operate, and when and how decisions will need to be made. Meanwhile, new information continues to be posted as it becomes available.

Bookmark this site for emerging dairy information: http://dairymarkets.org/


Shoemaker, Dianne. “OSU Extension Planning Meetings to Help Dairymen Assess Options.” Farm and Dairy 3 July 2014. Print.

Judge 2014 Progress With a Look at 2013 Numbers

Dairy Excel Column

For January 1, 2015 Issue

Farm and Dairy

Dianne Shoemaker

Back arrow

You were probably relieved to hear that Congress and the President worked together to pass a twelfth-hour extension of Section 179 expensing to help manage your income tax liability for 2014.  For many dairy farmers this extension will help as long as it is applied through needed purchases rather than “wants” that may not improve long-term profitability.

A better way to monitor how well the farm business is performing is through annual analysis and then benchmarking your farm’s performance against peer farms as well as the best in the industry.  While we are gearing up for 2014’s analysis, let’s take a look back at the analysis completed for 2013.

Thirty-five Ohio dairy farms completed not only a whole farm analysis for 2013, but also evaluated their dairy enterprise and each crop enterprise on their farm.  This is an excellent investment of valuable time resources that allows them to identify strengths and areas for improvement across their farm.


Table 1: 2013 Ohio Dairy Farm Business Analysis Highlights.  Raised feed

valued at cost of production.

2014 December 2013 Anal Review Table

*Including revenue adjustments, labor and management charge

**Before labor and management charge


The top 20% of farms are sorted by net return per cow, and this group of farms averaged nearly $1,000 more per cow than the average of all farms.  While the net return for all farms averaged $544 per cow, there was a tremendous (and typical) range, from farms losing up to $500+ dollars per cow, to farms netting more than $2,000 per cow.  Each year, the summary has clearly shown that it doesn’t pay to be average in the dairy industry.  Shoot for the upper third of dairy farms.

How do you know where you are?  In the farm office, bookkeeping has to go beyond what is needed for the tax preparer.  Some bookkeeping programs go beyond the basics and allow the operator to generate income statements, balance sheets and cash flow statements.  These are integral parts of a year-end analysis.  However, unless the accountant or bookkeeper is enterprising information, it is difficult to accurately pinpoint how individual enterprises contribute to the bottom line.

The bookkeeper is not the only critical piece in this puzzle.  The guys outside have to keep good production records as well.  When these two pieces are integrated into a final analysis, the result is a wealth of information for making sound business decisions.

If your current system does not allow this sort of analysis, 2014/2015 is a prime time to join the Ohio Farm Business and Benchmarking program.  There are two ways to participate depending on what records and information you kept in 2014:


  1. “I have good financial and production records and balance sheets.”  In this case you are ready to jump in with an analysis of 2014.  You will receive your complete analysis as well as benchmark reports personalized to show your farms’ performance compared to the other Ohio farms.
  2. “I don’t have balance sheet information, and I’m not sure I can say how much seed, fertilizer and other crop input costs should go to each of the crops I raise.  I just enter the amount I paid to the co-op.  But I really want to start getting cost of production numbers for my farm.”  In this case, going back and trying to figure out the details for 2014 could cause a mild to severe migraine!  However, you are not alone.Because this is fairly common, we secured a risk-management grant that allows us to mentor up to 21 farms through 2015, working with each farm to develop balance sheets (learning what they are and how to use them in your business), review record-keeping systems to make sure that needed information is captured during the year, and ending 2015 with the second balance sheet and an analysis of 2015’s business.  Not only will you end up with quality numbers to use in management of the farm, but each farm will be set to continue analysis in the following years.


Cost is minimal due to current generous grant funding, at only $100 per farm for either method discussed above.  Table 1 above shares a few basic numbers from the analysis.  Visit http://farmprofitability.osu.edu to view past analyses and find out more about Ohio’s program. Contact us to talk about what would work well for your farm at 330.533.5538 or shoemaker.3@osu.edu.

Shoemaker, Dianne. “Judge 2014 Progress with a Look at 2013 Numbers.” Farm and Dairy 2015: A5. Print.

Ready, Set, Go: Preparing Farms to Sucessfully Manage Risk

Farm Financial Analysis – The Ready, Set, Go Program

Dianne Shoemaker, OSU Extension Field Specialist, Dairy Production Economics

Barry Ward, OSU Extension, Leader, Production Business Management, Department of Agricultural, Environmental, and Development Economics

Picture7Picture8Picture9

Was 2014 a profitable year for your farm? Which enterprises were profitable?  Which were not?  How does your farm compare to similar farms in efficiency?  In profitability?  What does the competition look like?   Recent volatile feed, grain, milk, land and rental markets have created uncertain profit margins and financial security concerns.

Completing a farm financial analysis is an effective way for farms to know their costs of production, profitability, and financial ratios. Farms can track year-to-year changes, identify problems early, and benchmark against peer farms as well as control information critical to effective participation in risk management programs.

The Ohio Farm Business Analysis and Benchmarking Program can help farms answer these questions by completing a financial analysis of the whole farm and each enterprise.  An analysis will provide a farm with:

Year’s Beginning Balance Sheet

Income and Cash Flow Statements

Year’s Ending Balance Sheet

Financial Standards Measures

Enterprise Analysis including:

-Cost of Production

-Benchmarking Reports

Can’t go back and find the information needed to analyze 2014?  Through the Ready, Set, Go program, you will learn what financial and production information to keep and how to collect it in real time.   By the end of 2015 you will have everything needed to analyze how your farm business performed and will learn how to use your analysis to manage your farm and your farm’s risk.

Choose from classes, on-line webinars or videos along with personal assistance to guide you through the year from start to finish with a Farm Business Analysis.   Cost for the program is $100 per farm which will include up to 3 on-farm consultations.


For more information, contact Dianne Shoemaker at shoemaker.3@osu.edu or Christina Benton at 330.533.5538