If you have never used Excel’s “Insert a Table” function, you may not realize how much easier it can make your life. Here are some tips and tricks tables allow you to do.
How to Insert a Table
Select the data you want to turn into a table (remember the CTRL-SHIFT-END trick from my previous blog on Excel tricks and tips). Under the Insert menu tab, click on the Table icon and then click OK on the Create Table box that pops up.
Naming the Table and Quick Formatting Styles
Now you will see a new menu tab: Table Tools > Design. On this tab, rename the table something more meaningful than Table1. A meaningful name will be very helpful if you use the table as a basis for a chart or pivot table later on.
You can also select another design for your table. I recommend the simpler designs to make reading your data easier on your users, but there is certainly a wide selection available. If you want a specific look, you can create your own style from scratch or from a duplicate of one that is there.
Calculating Sums
One of the nicest features of the newly created table is the ability to calculate sums for filtered data. In a regular data range, the grand total is always the total of all the rows, filtered or not. But an Excel table will recalculate to show the total of visible rows only.
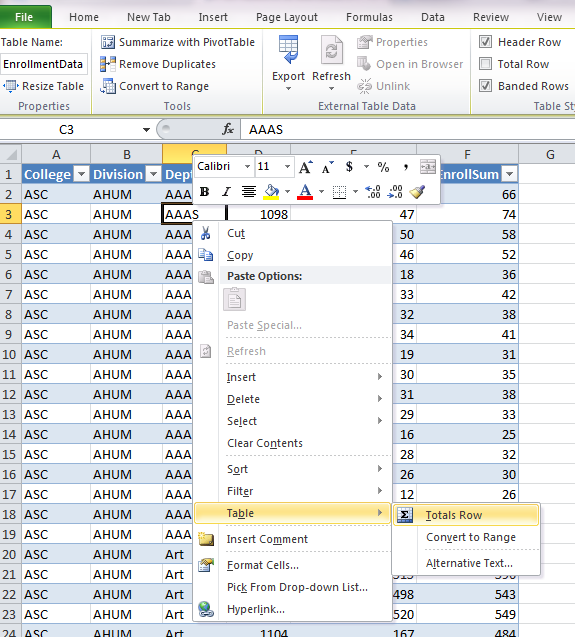
First create a totals row by right-clicking anywhere within your table. Select Table > Totals Row from the menu that appears.
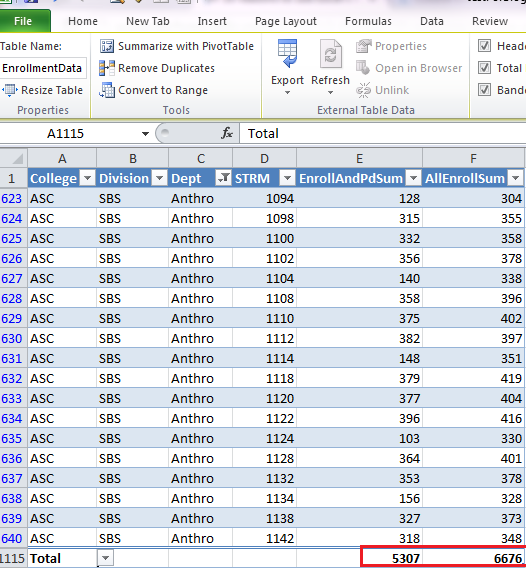
A total row will be created at the bottom of the table. You can add calculations at the bottom of each column selecting from a variety of options.
Once you create the total row, it will update every time you choose to filter your table. The table below is filtered for a single department and the totals have updated to only include the data that is show for that department.
Sorting and Filtering the Data
When you convert the data to a table in Excel, it automatically adds the sort-and-filter arrows. This makes filtering or sorting by one or more columns a breeze. Click the down arrow and select the sort or filter you desire. Any column with a filter will show a filter icon instead of the down arrow. This makes it easier to remove the filter when you are ready to look at the whole table again.
If you decide you don’t want any filters, they are easy to turn off. Click anywhere in the table, then on the Data tab click Filter. The down arrows disappear and none of the data is filtered anymore. Click Filter again to get the sort-and-filter arrows back.
Formulas in a Table
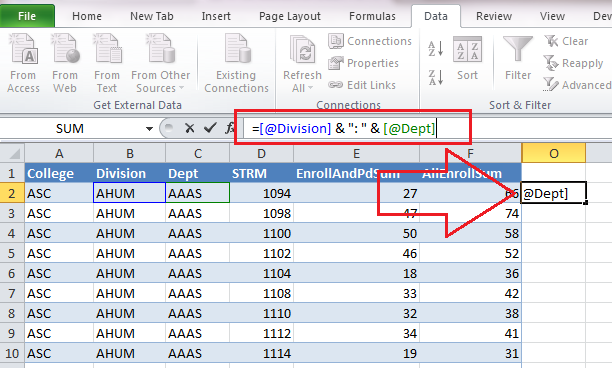
Adding a column of formulas to a table is a breeze with Excel tables. As with rows, adding a new column is as simple as adding any text or formula to a cell adjacent to the table. If you type in a formula at the top of your table, Excel will not only format the new column, but also copy the formula down the entire table.
Here I have typed in the formula, but I haven’t clicked enter yet. Notice that Excel uses the column names instead of the usual cell reference number. You create the formula the same way as you would in a normal range by clicking on the cells you want to include. Excel is smart enough to substitute the[@ColumnName] format for the cell reference.
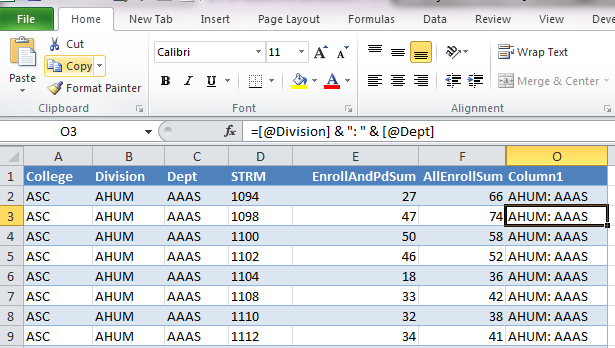
Here is the view after I hit the Enter key.
Now I can rename the column something more meaningful than Column 1.
The copy down functionality is terrific, but even better is what happens if you need to delete all the rows and paste or type new data into the table. Excel remembers the formula and recalculates the column automatically. You never need to retype the formula as long as you have the table.
Creating a Chart
Creating a chart from the new table makes the chart much more dynamic than if it were based on a range. The chart will automatically include new rows of data. It will also update based on the filter you apply which makes it great for investigating trends. When you select the data range for your inserted chart, use the table name instead of highlighting the rows. Since you gave your table a meaningful name, this should be much easier than choosing the range.
Reverting Back to Normal Range
If at some point you want the extra table features to go away, it is easy to revert back to a normal range. Click anywhere inside the table, then select Convert to Range from the Table Tools > Design menu tab and the nifty functionality of tables goes away.


Its very dificult, thx for made easy it,