The following tips are fairly simple things you can do to make Excel less time consuming. They are so simple you might wonder why no one has told you about them before!
Quick Sums and Averages
Suppose you are working on a spreadsheet in Excel, and you want to quickly check that the column of numbers you just entered matches the total you are expecting. No need to click the Quick Sum button, just highlight the cells you want to total and look at the bottom of your screen. Excel automatically creates an Average, Count and Sum calculation every time your highlight cells.
Shortcut Keys for Selecting
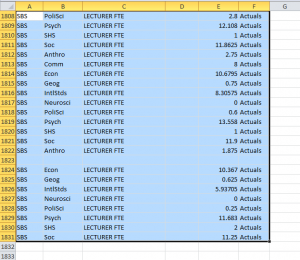
Excel has a lot of short cut keys that can really make your life easier if you have to do repetitive actions. You can find a partial list at here. For this post, I wanted to spotlight two ways of selecting large portions of a spreadsheet quickly. When I’m working in Excel, I often want to select all or most of the spreadsheet. A quick way to make this selection is to click on the top left cell in the block you want to select then use CTRL SHIFT → ↓.
However, using the CTRL SHIFT → ↓ is great only if you have a complete block with no missing rows or columns. To make sure you get everything, use CTRL SHIFT END and the highlighting will extend all the way to the last used cell in the worksheet.
Transpose a Table
Suppose you have a table in Excel and you want the columns to be rows and the rows to be columns. There is a “quick and dirty” way to do it quickly.
1) Select the data you want to transpose. Copy.
2) Select a blank cell in your worksheet where you want the transposed table to appear; select the arrow for Paste from the Home tab. The Transpose symbol is in the second row, third column of the Paste options.
Voila! Your data has been transposed. The downside of the quick and dirty version is that the newly created table is not linked to the original table. If you change something in the original table, it will not be updated in your transposed version. There is a way to transpose while keeping that connection, but that will have to wait for a later post since it is a lot more complicated.
Display Formulas Instead of Values
Sometimes when you create a complex spreadsheet with a lot of calculations, it can be helpful to view all the calculations in the spreadsheet instead of the results of the calculations. This is particularly helpful when you are trying to track down an error.
Excel provides a shortcut to quickly do this: CTRL `.
The ` grave accent key is located at the top left of your keyboard with the tilde.
Press once and the spreadsheet displays the formulas; press again and you get the results to appear again.
Getting the Most from the Quick Access Toolbar
If you use Excel a lot, you may find yourself using a specific command over and over again. Paste Values is one I use a lot and I’ve frequently wished for a shortcut key to make my life easier. An underused trick in Excel will allow you to create such a shortcut quickly and easily.
1) Click the down arrow at the right of the Quick Access Toolbar.
2) Click More Commands…
You can limit the number of commands you see by selecting “Commands Not in the Ribbon” from the “Choose commands from:” drop down box.
3) Select Paste Values (or your preferred command) and Click Add.

By default, Excel will add this to all your documents. If you only want this shortcut to show up in the current document you can make that selection using the “Customize Quick Access Toolbar” drop down box (see the blue highlighted box above).
4) Click OK
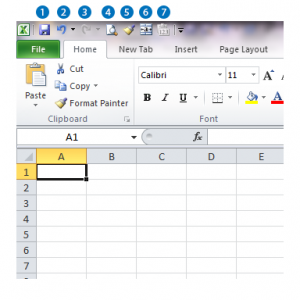
Now the fun begins. Not only can you see this one click item all the time, but if you prefer to use keystrokes, you can access by holding down the Alt key and pressing the number corresponding to the position of the icon in the Quick Access Tool Bar. In my case, I added Paste Value into the 7th position on the Toolbar so I can use Alt 7 to call on it at any time.

Coming soon…
There are numerous tips and trick to Excel that can make your life easier. I have only presented a few here, but there will be plenty more coming soon. In the near future, we’ll take a look at the “Insert a Table” function and how this simple tool can be a truly powerful friend. Later on, we’ll be looking at creating our own simple macros for personalized short cuts. It’s easier than you think!


