Posts

Performance Test 2 (3/30/16)

During this lab the team learned that it should use gravity as much as possible to minimize the energy consumption of the AEV as it navigates the course. The team will do this by only running the motors when the AEV is going up an incline or after the AEV makes a stop. The team also learned that the AEV needs to use the celerate function before the AEV brakes because this will allow the AEV to stop smoothly and lower the energy usage of the AEV. Before the team learned this they were using a motorSpeed in the opposite direction to negate the AEV’s momentum but with the celerate function the motorSpeed required to stop the AEV will decrease significantly. The AEV will also need a controlled decline as it goes down the hill to insure the safety of the passengers. Below shows the Power vs. Distance and Power vs. Time.

Power_v_Distance_FullAEVRun_PT3 Power_v_Time_FullAEVRun_PT3


PDR (3/23/16)

PDRReport

The purpose of the preliminary design was to successfully formulate a code that will meet the mission’s objective, that is to have a code that fulfills an operation consistency against the instabilities along the monorail. Furthermore, the amount of battery power within the AEV attributed to variations in the run. A code that utilizes an “auto-fix” function could eliminate these instabilities and variations altogether.

Another purpose was to minimize the energy/mass ratio, as an intent to fulfill an operational efficiency. Efficiency would be crucial, augmented by a factor of 20% in an early concept screening/scoring, for the lowest price of the tour (as described by the MCR). To complete this, the physical design must be optimized, using the least amount of components and the smallest panels for construction. The energy/mass ratio can be estimated by those flavors (described in Supplied Power vs. Time and Supplied Power vs. Distance). Additionally, peak magnitudes in the graphs can quantify the energy used for each designs.

After analyzing the data and making physical observations, it was concluded that Design One was the more efficient design but it still needed to be tweaked. The balance of design one was not favorable so the Arduino board and wheelbase were adjusted to mimic the layout of Design Two. Design One also had benefits because it was lighter, faster, and more cost effective which helped the team make the final decision to use Design One. In the future of this project, Design One will be further tested and changed as needed to make the AEV as close to perfect as possible.

Performance Test 1 (3/14/16)

Before the utilization of the two AEV designs, a series of labs served to experiment on and learn about various components of the project. Continuous trials using an Arduino-based code allowed a production of final draft that completes the AEV run. Two AEV designs were built for comparison, where two flavors of mechanics (that is Supplied Power vs. Time and Supplied Power vs. Distance) were observed for the objective of efficiency. Additionally, another flavor (that is System Efficiency vs. Advance Ratio) described which propeller’s direction were suitable. These graphic relationships were formulated, using a student’s MATLAB code that analyzed the AEV’s EEPROM data.  As a model to display propriety, two SolidWork models were created, which analogized the value (shown by the bill of materials) for each designs.

Lab Update (3/2/16)

ExecutiveSummaryLab5

The wind tunnel served to create new physical parameters such as the propeller’s thrust. Our propeller’s design, and small increments of volts, attributed to the thrust values that were noticeably unique by specific design. Excel calculations used the thrusts to produce a plot of Propulsion Efficiency vs. Advance Ratio (for two directions of thrusts).


puller propulsion efficiency vs. advance ratio pusher propulsion efficinecy vs. advance ratio

Propulsion Efficiency is defined as the output power per input power. Advance Ratio is defined as the ratio between the distance of travel and the diameter of the propeller. These trends entail which advance ratio exerts its maximum efficiency.

Lab Update (2/24/16)

ExecutiveSummaryLab7

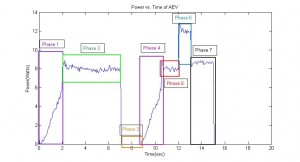
In this lab, the procedures were similar to that of the previous lab (2/17/16), in ways that codes the EEPROM data into graphs and plots. Though, this lab required a travel constraint, which was for the AEV to start from the “maintenance station” to the “Grand Canyon”, and for the vehicle to return to the “maintenance station”. This back-and-forth travel produced an interesting trend in the data. The Supplied vs. Time graph has been placed below (with phases to indicate various coding changes).

Power Graph (2)

As we observed and predicted, the supplied power occurred in a bilateral fashion, with the latter being smaller and shorter. This trend could serve to create other parameters, ones that focuses on power efficiency, like a power ratio between rotations of travel. Possibility of future improvements were discussed.

Lab Update (2/17/16)

ExecutiveSummaryLab6

The lab consisted of collecting EEPROM data from a test run, and converting them into workable MATLAB data. Calculations produced values of power, velocity, and propulsion efficiency that were graphed in the MATLAB plotting function. The Phase Diagram of Supplied Power vs. Time were placed below.

Power Graph 2

The trend in the Phase Diagram corresponds with the Arduino Code, when power percentage varies with celerate and motorSpeed functions. The students discovered excess supplied power in the graphs, and changed the code for efficiency. These excesses of energy occurred in the change-of-direction and the slowing-down parts of the code.


Lab Update (2/10/16)

ExecutiveSummaryLab3

Today, lab members used screening and scoring methods to see which designs were the best. Based on categories like durability, cost, or maintenance, Design Z gathered the most points during design analysis. Design Z is a wide-wing design with the largest propellers. Its wheels are on the opposite side of the hangers compared to the other designs, so that the AEV can be kept balanced on the flat track. The Arduino code worked well with the design, causing no problems in swinging or slow-speed.

Lab Update (2/3/16)

Lab4ExecutiveSummary

Today, the lab members tested new code to measure the distance the AEV travels along the track. The new code was goToAbsolutePosition() and goToReletivePosition(). Using external reflection sensors, the rotations of the AEV wheel could be measured with alternating reflective surfaces. After trying the new code on the AEV, the vehicle was put into the track and programmed to move across it. The lab members calculated to number of rotation required to move across the track’s length, which was approximately 395 marks.

Lab Update (1/27/16)

EngineeringExecutiveSummary2

The lab members got accustomed to the code language within the Arduino software. The lab procedure set up various scenarios for the members to code. Afterwards, the members discussed with each other and the professor about the max output of the designed propellers. Maximum output should range about 25-30, based on the code format motorSpeed(motor,output). Then, the code was tested live on the AEV for observation.