Summer 2023 Online Courses for Teachers

In partnership with the American Association of Physics Teachers (AAPT) we will be offering a summer online course for high school physics and physical science teachers.

Chris Orban is talking about summer online courses for teachers

There will be a “beginner” course from June 26 – July 9. The course will meet over zoom in the afternoons (eastern time). We will cover some of the “physics of video games” activities, especially activities without trigonometry that can work even in 9th grade classes. We will also go over the STEMcoding Object Tracker which is part of our Data Science initiative.

Following the beginner course there will be an “intermediate” level course from July 10 – July 21 where we will go over physics of video games activities that do include trigonometry. In that sense the intermediate course is aimed at non-AP physics and above.

Here is a link with more information and to sign up for the courses:
https://www.aapt.org/K12/Online_Courses_for_Grad_Credit_and_CEUs.cfm

There is an option to take the courses for grad credit but that is not required and you can receive CEUs instead.

Please consider signing up for the course or contacting teachers that you know about the opportunity!

Data Science Update (2023)

In January 2023, the STEMcoding Data Science team had the opportunity to try out some of our new activities with 9th and 10th grade students at Metro Early College High School in a two-week course we called “The Art of Data”. College of Education grad student Jessica Kulp and OSU actuarial science student Gowrav Mannem worked with Prof. Chris Orban and a teacher from Metro to deliver the course.

Prof. Chris Orban stands in front of a class and is pointing at a powerpoint presentation.

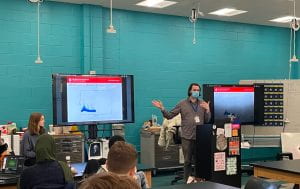
Prof. Chris Orban and grad student Jessica Kulp discuss good figures vs bad figures as part of a short course on “The Art of Data” at Metro Early College High School. Image Credit: Gowrav Mannem

To introduce the course, we spent a couple days discussing what makes figures ‘good’ or ‘bad’, how to represent data effectively, and the purpose of visualization. The ideas distilled from this discussion then guided students in creating their own visualizations throughout the course. Below is an example of a bad figure:

Example of bad figure. Students pointed out the confusing bin labels, lack of title, and questioned the appropriateness of a bar graph.

Students pointed out the confusing bin labels, lack of title, and questioned the appropriateness of a bar graph. This is ‘bad’ because the purpose of the visualization is unclear.

Students then completed our updated Air Pressure Activity, and a new Solar Panel Activity

A graph of the pressure versus height measured from going up and down a stairwell. The trend is linear and negative correlated. Larger height is lower pressure.

Sample data from Air Pressure activity (using Excel). Pressure measurements are taken using the Arduino Science Journal app, which reads from the sensors built into most smartphones and tablets. We took pressure measurements at regular increments while walking up a flight of stairs.

The students’ data did not turn out as clearly linear as our sample data, as they had a limited height range to work with (one flight of stairs). However, this led to a discussion about how to assess the fit of a trendline and how to treat outliers, which were not originally planned topics for this activity.

The Solar Panel activity asks students to investigate whether the efficiency of a solar panel has declined over time. The dataset used contains daily measurements of energy produced over the course of five years. This activity gives students experience working with a large, messy dataset to build essential spreadsheet skills, such as sorting data into columns and using functions to sum and average.

A plot of energy generated per day in units of Watt hours from a solar array over the course of five years. The energy generated per day varies through the year but there are also clear trends for more energy generation during summer and less during the winter months

Scatter plot of the solar panel data. There are clear seasonal variations within each year, but also a subtle downward trend from year-to-year. Students must take a closer look at each year in terms of summed or average energy produced.

Students also briefly explored probability through two activities: Free throw probabilities, and weighted dice.

We borrowed the free throw activity from Tap Into Teen Minds. Students worked collaboratively to determine the likelihood of three different outcomes of a real basketball game: Win, tie (overtime), or lose. Students had to think critically about what the probability is for making a given shot. Is it a 50/50 change of making the shot? Should they consider the player’s free-throw percentage from this game, or from the whole season?

A weighted or loaded dice is one which is unfairly weighted to land more often on some sides than others. We asked students to formulate a plan for how they would investigate a suspicious die. Groups of students came up with a variety of ways to collect and analyze data from dice rolls using spreadsheet software. In reality, none of the dice students tested were intentionally unfairly weighted, but all groups found an average roll value of 3.7. This was surprising, as we expect an average of 3.5 for a fair die. This led to a valuable discussion about sample size and sources of error.

We couldn’t fit all the STEMcoding Data Science activities into this short course, but some of our other activities (Earth Day and Night Sky activities) are demonstrated here in the data science playlist on the STEMcoding YouTube channel.


Summer 2022 Online Course with AAPT

In partnership with the American Association of Physics Teachers (AAPT) we will be offering a summer online course for high school physics and physical science teachers.

There will be a 1.0 grad credit “beginner” course from June 27 – July 8. Although you do need to register a free account with AAPT to sign up for the course, you do NOT need to be a national member of AAPT to take the course (even though there are lots of great reasons to be a national member!).

The course will meet over zoom in the afternoons (eastern time). We intend to cover some of the “physics of video games” activities, especially activities without trigonometry that can work even in 9th grade classes. We will also go over the STEMcoding Object Tracker which is part of our Data Science initiative.

Here is a link with more information and to sign up for the course:
https://www.aapt.org/K12/codingintegration.cfm

The cost is $120 per grad credit plus a $20 lab fee and, if this is the first AAPT grad course you have taken, there will be a $80 administrative fee. This administrative fee is a one time fee so if you take ANY other AAPT-affiliated online courses you will NOT need to pay the $80 fee again.

Please consider signing up for the course or contacting teachers that you know about the opportunity!

AFIT Summer 2022 Teacher Fellowship!

The STEMcoding Project is partnering with the Air Force Institute of Technology (AFIT) in Dayton, Ohio to offer a summer teacher fellowship during summer 2022. We are looking for a computationally-interested high school math teacher from Ohio to work with us over 6-9 weeks to collaborate in the creation of innovative new classroom activities that incorporate relevant computer science and mathematics concepts. Prof. Chris Orban from Ohio State University and CDR Royce James, Ph.D. at AFIT will oversee the project.

Funding for this fellowship is provided by Department of Defense High Performance Computing (DOD HPC). Supercomputing is an important tool for solving defense-related scientific and engineering problems. The goal of the fellowship is ultimately to broaden and diversify the “pipeline” of students who go on to develop these skills. Currently, only about 1 in 2 high schools have a computer science teacher. Math teachers are well positioned to meet this need, either by integrating computer science into their curricula, or by becoming credentialed to teach computer science classes.

Position Summary

Requirements: Currently employed high school mathematics teachers in Ohio who are US citizens. Teachers must be interested in integrating computation into their curriculum. Prior coding or computer science experience is not necessary.
Time: 6 – 9 weeks during summer 2022 (exact duration is negotiable)
Where: Virtually with occasional visits to the Air Force Institute of Technology in Dayton, Ohio.
Compensation: $1000 per week plus funds to present at a national or regional education conference in fall 2022.
Projects: Creating innovative classroom activities that mix computer science and mathematics concepts.
Deliverables: 1. A final report outlining activities during summer 2022 2. A final PowerPoint presentation in Dayton in late July or early August.
Other perks: Getting a tour of supercomputer facilities at Wright Patterson Air Force Base

Program Priorities

We especially value applications from teachers who are leaders in their local professional networks who may be able to impact other teachers with the skills they gain. Likewise, we also value teachers who have a leadership role in their districts regarding curriculum. We are especially committed to this “fellowship” supporting professional networks with high impacts in diverse learning communities that can demonstrate equitable and inclusive outcomes.

The exact duration of the summer fellowship is negotiable (between 6 and 9 weeks) but we may need to prioritize teachers who are able to spend closer to 9 weeks with us for the position. These do not all need to be consecutive weeks, however a main requirement is to be ready to give a formal presentation on the project during the last week of July.

Interest or experience with education research (broadly defined) is a plus. Our hope is that the final summer report will ultimately be published in a periodical for teachers.

Math teachers click here to apply for the summer fellowship!

STEMcoding & CCAPP Celebrate Black History Month

In celebration of Black History month, the STEMcoding Project led by Prof. Chris Orban teamed up with Jahmour Givans from the OSU Center for Cosmology and Astro-Particle Physics (CCAPP) to develop a tutorial that helps to explain the science and math behind the calculations that Katherine Johnson and other African American women did for NASA as part of Project Mercury. The contribution of these women was celebrated in the 2016 movie Hidden Figures.

three african american women with a rocket in the background

As discussed in the film and the book, mathematicians played an important role in NASA and in the heat of the space race there was a need to precisely predict where the Mercury capsule would land after reentry. Astronaut John Glenn’s life was in the hands of these women who worked to make sure the rescue boats would be positioned at the right spot to quickly reach the floating Mercury capsule.

It is difficult to find clear explanations of the science and math that Katherine Johnson would have needed to understand and use to perform these calculations. A further need is to convey this information at a level that is appropriate for high school students to understand. The new “Project Mercury” activity meets this need through step-by-step explanations of the calculations on a glass board, and through a coding activity that goes along with it.

a person writing physics equations

The coding part of the activity has an interesting real-world parallel because Katherine Johnson’s task was to double check the prediction of what was then one of the first mainframe computers. Likewise, in the Project Mercury activity, students double check the results of the computer program.

a person working with a computer code

This activity was partly inspired by discussions with Ranthony Edmonds and John Johnson in OSU’s math department. They teach a General Education course at OSU on “Hidden Figures” that focuses on the book and the mathematical tools involved in the calculations that Katherine Johnson and others did (for example the slide rule).

The full playlist for the new Project Mercury video series is available at this link. The step-by-step description of the activity is available here. It is designed for the 9th grade level.

STEMcoding Data Science selected for 2021 AIP Meggers Award!

We are excited to announce that the STEMcoding Data Science Initiative has been selected for the 2021 American Institute of Physics Meggers Project Award!  This award is given every other year and the projects must all benefit high school teachers, especially physics and physical science teachers.

A total of $12,500 will be split between Ohio State University (lead Prof. Chris Orban) and The University of Mt Union (lead Prof. Richelle Teeling-Smith).  These funds will be used to create new high school level data science activities with a physical science, earth science (including astronomy) and environmental science theme.

An earlier post describes the STEMcoding Data Science: Earth Day activity  that we recently submitted to hourofcode.com.  Another data science activity that we created is an astronomy activity called Night Sky Simulator that involves a mix of javascript programming and spreadsheet data analysis.

The goal of the STEMcoding Data Science Initiative is to create a year-long high school level data science course. Similar to our existing data science activities these will involve a mix of javascript programming and spreadsheet data analysis with either Google Sheets or Excel. Unlike other high school data science initiatives we will leave extra room at the end of the year to allow students to study for the industry credential exam for Excel. We think the connection to the Excel credential will be of interest to high schools serving socioeconomically underprivileged student populations.

To get updates on the STEMcoding Data Science Initiative please add yourself to the STEMcoding email list or follow us on instagram or twitter @STEMcoding  Prof. Chris Orban also posts updates to facebook

We are also very happy to mention that the other 2021 Meggers Project Award winner is an initiative led by our friend Prof. Brian Lane of the Let’s Code Physics youtube channel!

STEMcoding is officially listed as an instructional support in Ohio

The Ohio Department of Education issues guidelines on which topics need to be covered in various math and science courses and they also provide instructional supports and resource lists to provide quality materials for teaching those courses. A series of meetings with dozens of science educators took place in 2017-2018 to update these documents. These meetings produced the revised Ohio Science Standards, which were released about a year ago. And they produced an updated list of instructional supports for various subjects but the release of these documents were delayed. This month the updated instructional supports for physical science were published on the Ohio Department of Education’s website.

STEMcoding activities are listed in three places in the new instructional supports for physical science. A reference to our first hour of code activity is mentioned in the section talking about velocity and acceleration.

There is also a reference to our fluid mechanics interactives in the section that talks about phases of matter.

And there is a reference to our wave interference activity. In 2017-2018 when the meetings happened to update the documents, our wave interference activity was one of the few HTML5 compliant wave interference interactives on the web (meaning that it works on Chromebooks and most other operating systems). PhET had not yet migrated their wave interference interactive from a Java applet to HTML5 which prevented it from working on Chromebooks and newer computers. A frequent topic of discussion at the meetings in 2017-2018 was issues around Java applets and flash media that teachers had been relying on but were not working any more on Chromebooks and recent computers.

We are proud and excited to be listed officially as an instructional support for physical science in Ohio! We anticipate that our activities will also be referenced when the instructional supports for physics are released later this year.

Check out our new Data Science: Earth Day activity!

In partnership with the University of Mount Union and their Sit Lux STEMcoding grant, in summer 2021 there was a big effort to create an activity called Data Science: Earth Day in which students create a simple model of the change in temperature at their location through the course of the year and then add a shift to that model to see the impact of climate change.

The activity is an important milestone for us for many reasons. The videos (which are also also available on our youtube channel) were recorded in front of a green screen studio at the University of Mount Union, which is the first time we have released a video series without using OSU’s recording studios.

Another key aspect of the activity that makes it unique is that because of the interdisciplinary subject, it can fit nicely into an environmental science, earth science, math or computer science course. Most of the activities we have created thus far have been for physics or astronomy.

The activity is also a shift for us as we build more high school level content for Data Science. There is a great deal of interest both nationally and in Ohio in having more high school students take data science courses and Data Science: Earth Day is a good example of what we think is appropriate for this level.

Finally, we are excited to submit the activity to hourofcode.com where it will hopefully be our sixth activity there. We get emails from educators around the world who find our content there!

Summer 2021 Online Course with AAPT

In partnership with the American Association of Physics Teachers (AAPT) we will be offering a summer online course for high school physics and physical science teachers.

There will be two courses — a 1.0 grad credit “beginner” course from June 28 – July 9, and a 2.0 grad credit “intermediate” course from July 12 – July 28. Teachers may take one or both of the courses and taking the intermediate course without taking the beginner course is possible. Although you do need to register a free account with AAPT to sign up for the course, you do NOT need to be a national member of AAPT to take the course (even though there are lots of great reasons to be a national member!).

Here is a link with more information and to sign up for the course:
https://www.aapt.org/K12/codingintegration.cfm

The cost is $140 per grad credit plus a $80 administrative fee. This administrative fee is a one time fee so if you take ANY other AAPT-affiliated online courses you will NOT need to pay the $80 fee again. If cost is a barrier, please let us know if we can help advertise a go fund me or donors choose page on our youtube channel and our @STEMcoding social media accounts (including instagram and twitter)

Please consider signing up for the course or contacting teachers that you know about the opportunity!

STEMcoding Project Announces Big Updates and New Resources for Distance Learning

Each summer is an opportunity to polish, improve and build new STEMcoding content that mixes computer science with traditional science and math learning objectives. With instructors facing extraordinary circumstances this fall with distance learning and hybrid learning due to covid19, we put in extra time to deliver new features to help students work from home and potentially without close proximity to a teacher or instructor.

The Milestones System

Until recently, the main way a student could know if their code was working correctly was to submit their code to their instructor to look over. This puts an extra burden on the instructor to frequently grade or give feedback to their students and on a short timescale. For more than a few students it becomes impractical. In May and June, we added what we call the “milestones system” to many of our classical mechanics activities. For these exercises, the student sees a list of objectives below the screen with either a green check mark, gray question mark or red X there to indicate whether the objective is met. We have funneled our experience with various ways that students mis-configure codes to determine if certain objectives are met or not. The result is instant feedback on whether they have made a particular modification to the code correctly.

Here is a demo of what the milestones system looks like if students completed Planetoids with Torque correctly


Teachers will still need to go in and look over student submissions including their codes and answers to reflection questions, but this new system can help identify common errors in real time and provide useful warning messages for students to fix them. As educators across the US anticipate more distance education this fall we hope this helps maintain rigor while taking us much load off of the teacher as possible, leaving them to focus on other things and addressing deeper concepts. The milestones system has been implemented in activities Move the blob, Accelerate the blob, Apollo Moon Lander, Bird Launcher, Pong, Bonk.io, Planetoids, Lunar Descent, Bellicose Birds, Planetoids with Torque and Planetoids with a Spring.

STEMcoding Object Tracking System for Home Physics Experiments

One of the most difficult parts of distance learning for physics and physical science classes is replicating the lab experience. For example, students at OSU and many other schools use equipment like Vernier logger pro to analyze the positions and velocities of objects in simple physics experiments. How can instructors help students perform experiments like these from home?

If students have a smartphone or a tablet at home they can potentially record a video of some kind of simple physics experiment. Some devices, like the iPads each OSU freshman will get this year, are capable of 240 frames per second slow motion video recording. This is perfect for recording physics experiments! There are a couple of different programs that instructors use to analyze these videos, but typically they work by going frame by frame and clicking on the position of the object as it moves. Relatively few of the programs that are available are capable of automatic object tracking (i.e. without manual clicking).

Instead of creating a one-size-fits-all program that allows the user to do both the frame-by-frame clicking on the object AND automatic tracking, we designed a free browser-based program that ONLY does object tracking. The key is to use a brightly colored, preferably blue or green, ball in front of a dark background like a black posterboard. By analyzing the colors in the video, our program can track the motion of the object automatically.

The goal is not to replace the frame-by-frame analysis with manual clicking, but rather to provide an independent analysis of the same data. With tools like these, students will be able to analyze the experiments they conduct at home with much more precision than they might be able to otherwise.

A user guide for the program is available at this link http://www.asc.ohio-state.edu/orban.14/STEMcoding_DIY_description.pdf . As described there, the program is compatible with iPhone / iPad and Android recorded videos and it works on various platforms including chromebook, iPad, windows and mac.

The STEMcoding Object Tracking System was recently submitted to the AAPT Summer Grand Challenge for simple home experiments with basic school supplies. A very big thanks goes to Cincinnatti area physics teacher Jennifer Boughton for helping to record videos and perform other testing for the new program.