Here is a pdf file of my paper Capstone Paper – Emily R Smith
below is an un-formatted version of the paper for the blog
Microscopic Traffic Simulation of Dublin Ohio
created with Aimsun Next
Emily R Smith
The Ohio State University
Abstract
My project focused on data visualization of a single intersection. My original plan was to create this model from scratch using Java a general-purpose programming language, however this plan failed as I lacked the knowledge and the time to create a program so different from my previous work. From this setback I decided to create the intersection using industry quality software. This software turned out to be Aimsun which is used by government agencies, and academic institutions, this includes The New York Department of Transportation and MIT, Massachusetts Institute of Technology. Because, I didn’t create the software I decided to do some data collection in the field on the intersection that I modeled. I collected data on the amount of cars, and what direction they moved through the intersection, I also timed the traffic light states. Finally I created the intersection in the Aimsun software using all the data I collected from the intersection plus the speed and frequency data from the City of Dublin to check that my vehicle per hour measurement was realistic and to give realistic speeds to the cars. I adjusted the simulation until it was a good model of that intersection during the hour and a half time period that I collected data on site. By completing this model of a high traffic single intersection I learned so much about the process of creating realistic models of traffic flow and how complex traffic management is.
Microscopic Traffic Simulation of Dublin Ohio
created with Aimsun Next
Traffic is something that I am very familiar with being a commuter student , however I wanted to learn more about traffic and wanted to visualization the motion of individual vehicles. I decided to achieve this my modeling a microscopic part of Dublin Ohio’s traffic system. The intersection I choose was high traffic and was complex with multiple lanes and separate left turn lanes. My original plan for the final product was to create software to model traffic during a specific time frame. My final project however uses traffic modeling software created by Aimsun, instead of a software of my own creation.
Literature review
In reviewing the Ohio Public Safety website, you quickly get a feel for how important traffic flow is to the lives of citizens. In reviewing traffic crash information, including the number of fatalities each year, it is clearly evident that proper traffic flow can literally mean the difference between life and death. This alone is a significant validation for the importance of traffic analysis.
In addition, I reviewed several academic papers on the study of traffic flow and the use of software simulations. The traffic flow simulation created by Martin Treiber was the starting point of much of this research, it is a great example of how software can be used to recreate life like situations. From there I found a book Treibar has co written called Traffic Flow Dynamics that discusses vehicle based flow dynamics and how simulation can be used at the microscopic and macroscopic levels. This book makes traffic an interdisciplinary area of interest, as it deals with human behavior, computer science, physics, and traffic engineering. Therefore my personal research understanding how these fields can combine is important because it will allow me to join the conversation on these complex interdisciplinary topics with greater understanding.
Another work also co written by Martin Treiber is the article “General Lane-Changing Model MOBIL for Car-Following Models” really tied research of traffic flow to the safety of the roads, stating that “drivers’ lane-changing behavior has a direct influence on traffic safety” Kesting, A., Treiber, M., & Helbing, D., 2007, p. 1). This just furthers how important traffic research.
Methodology
After extensively researching the traffic flow analysis I wished to do, I realized that, due to time constraints, and the existence of adequate analysis applications, it would be more effective for me to review and choose an existing software tool, rather than attempting to recreate one. In order to complete the microscopic traffic model I first had to choose a site from which I would collect traffic data. I chose a high traffic intersection to provide a larger sample of data. I then needed to collect the data and transfer it to my spreadsheet (see Appendix A and Appendix B for the spreadsheets) , so that I could calculate variables, including vehicles per hour, percentages of turners, and average traffic light time. I then inputted the data into Aimsun Next to create a representation of the intersection.
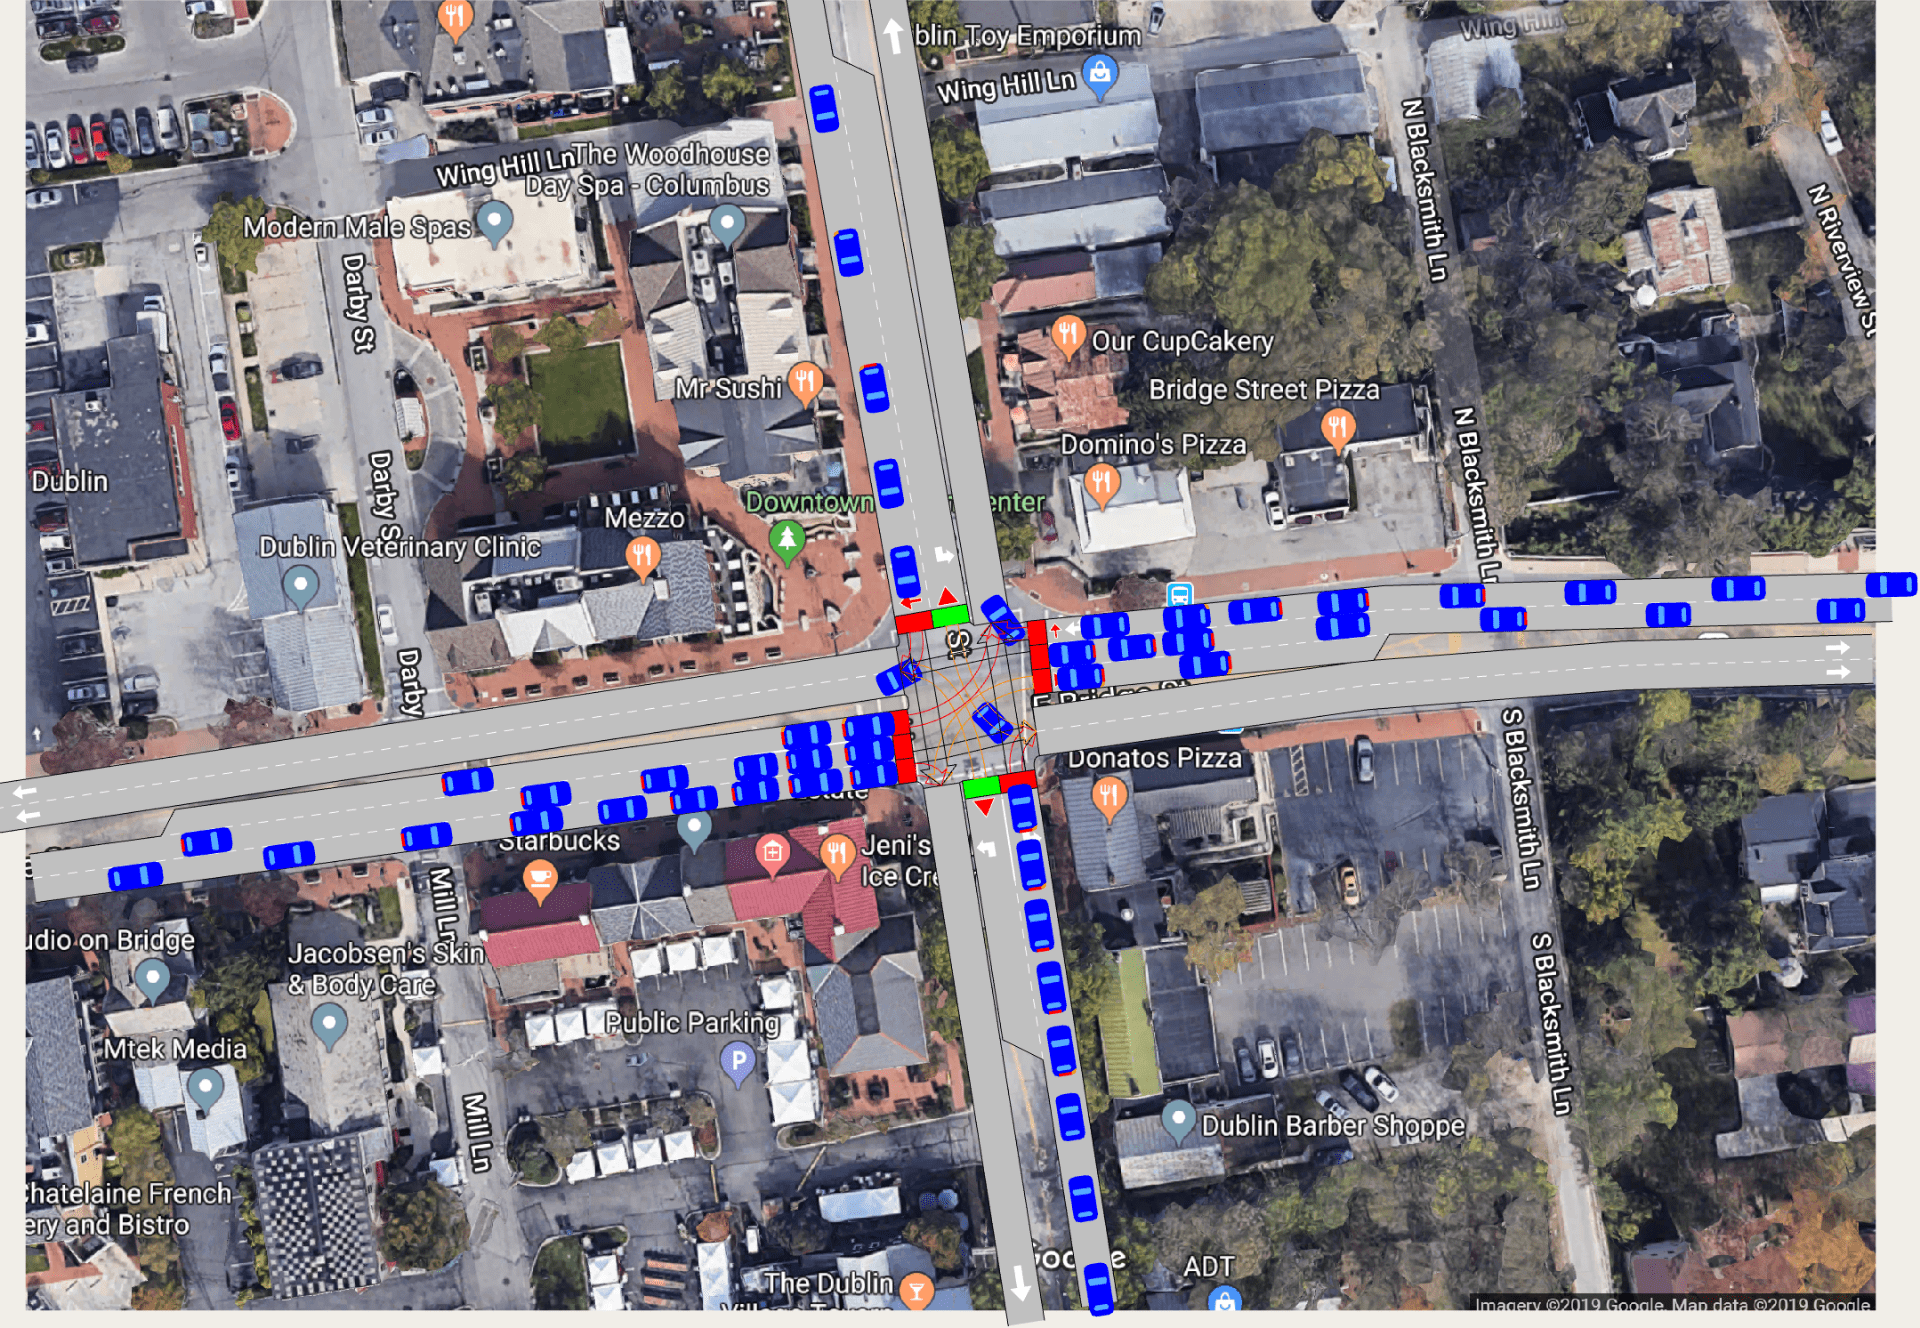
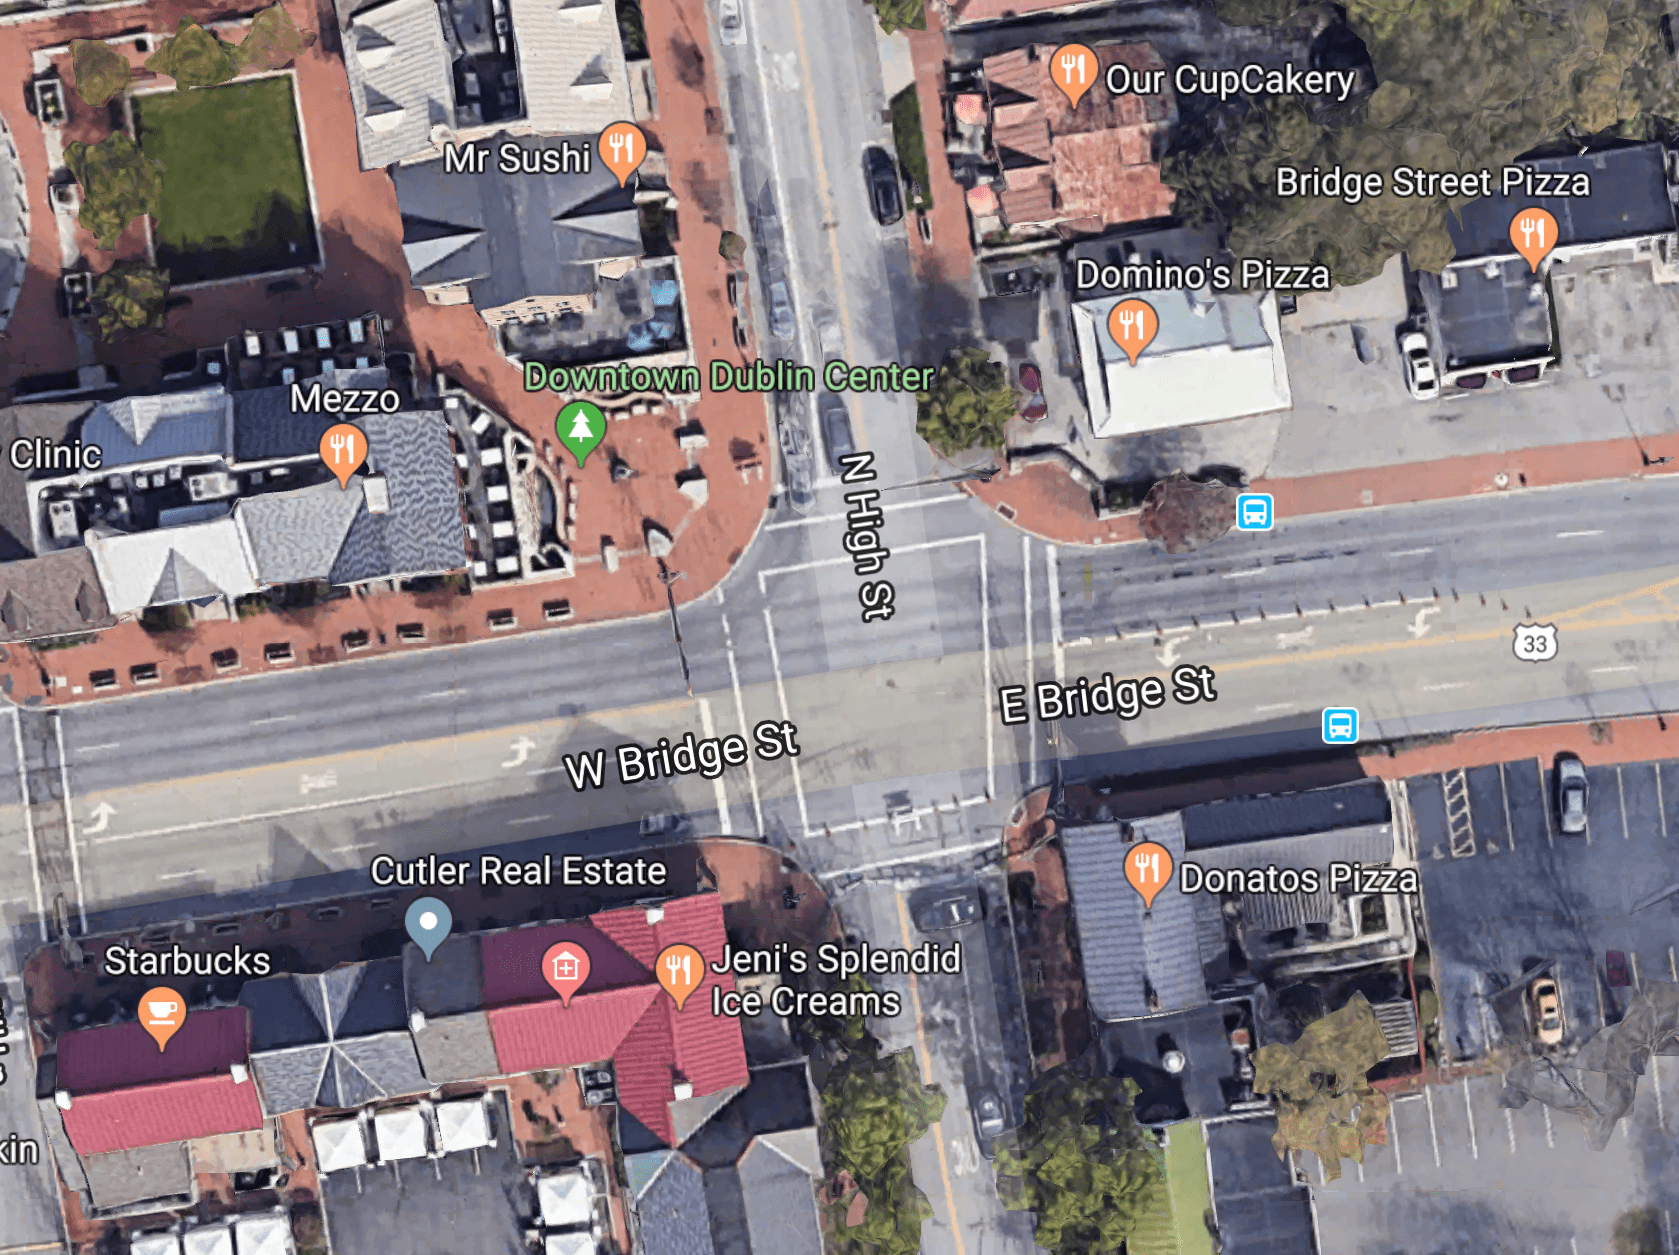
To create the model, I acquired a reference photo of the selected intersection. I used the image to add the lanes surrounding the intersection, making sure to add left turn lanes. I then had to create nodes to represent the directions of travel through the intersection. I inputted the number of vehicles that traversed each lane. I then added the traffic controller, the device that regulates the flow of traffic through the intersection. Following that, I imported the speed data from the City of Dublin Division of Police for this particular intersection (Traffic/Speed Survey Results by StealthStats, 2018). The data was from March 27th to 29th of 2018 on Bridge Street. With all of the setup work done, I had to choose the simulation scenario I wanted. I then ran the simulation through the software.

Figure 1. An image of the simulation in progress. Taken from a screenshot of the Aimsun Next simulation software.
Results
The resulting traffic model was an adequate representation of the data, although it did not fully represent the actual traffic that flowed over time. This was primarily due to the manual collection method I was able to use. This method provided more limited data. Had I been able to use actual traffic flow meters, I would have had a more realistic representation because of the increased accuracy and quantity of data that could have been collected. Overall, the model was successful in helping me understand the process of traffic analysis.
Conclusion
I believe my results from my microscopic traffic study gave me a much clearer insight into how traffic data may be collected, modeled, and simulated. I also have a clearer understanding of how this information can be used to improve the systems in place to control the overall flow of vehicles through a populated area. I am confident that this experience has helped me develop more skills related to problem solving and original inquiry.
References
Kesting, A., Treiber, M., & Helbing, D. (2007). General Lane-Changing Model MOBIL for Car-Following Models. Transportation Research Record: Journal of the Transportation Research Board,1999(1), 86-94. doi:10.3141/1999-10
Ohio Department of Public Safety. (n.d.). Retrieved from https://publicsafety.ohio.gov/wps/portal/gov/odps/home
Traffic/Speed Survey Results by StealthStats. (2018). Retrieved from https://dublinohiousa.gov/dublin-police/trafficspeed-survey-results-by-stealthstats/
Treiber, M. (n.d.). Microsimulation of Traffic Flow: Onramp. Retrieved from http://www.traffic-simulation.de/
Treiber, M., & Kesting, A. (2013). Traffic flow dynamics: Data, models and simulation. Heidelberg: Springer.
Appendix A
Frequency of Vehicles during one Traffic Cycle from 6/28/2019
| data collected: 3:22-3:32pm | North Traffic trial 1 | North Traffic trial 2 | North Traffic trial 3 | North Traffic trial 4 | North Traffic trial 5 | North Traffic average |
| Left Turners | 1 | 0 | 2 | 1 | 2 | 1.2 |
| Straight | 5 | 7 | 7 | 3 | 6 | 5.6 |
| Right Turners | 10 | 6 | 7 | 15 | 9 | 9.4 |
| data collected: 4:04-4:20pm | South Traffic trial 1 | South Traffic trial 2 | South Traffic trial 3 | South Traffic trial 4 | South Traffic trial 5 | South Traffic average |
| Left Turners | 6 | 5 | 5 | 1 | 4 | 4.2 |
| Straight | 8 | 5 | 10 | 7 | 5 | 7 |
| Right Turners | 8 | 4 | 3 | 3 | 2 | 4 |
| data collected: 4:22-4:33pm | West Traffic trial 1 | West Traffic trial 2 | West Traffic trial 3 | West Traffic trial 4 | West Traffic trial 5 | West Traffic average |
| Left Turners | 5 | 6 | 6 | 9 | 7 | 6.6 |
| Middle Lane | 11 | 13 | 17 | 11 | 17 | 13.8 |
| Curb Lane | 14 | 11 | 17 | 14 | 13 | 13.8 |
| Right Turners | 6 | 6 | 3 | 2 | 6 | 4.6 |
| data collected: 3:09-3:20pm | East Traffic trial 1 | East Traffic trial 2 | East Traffic trial 3 | East Traffic trial 4 | East Traffic trial 5 | East Traffic average |
| Left Turners | 6 | 6 | 1 | 7 | 8 | 5.6 |
| Middle Lane | 18 | 21 | 8 | 23 | 17 | 17.4 |
| Curb Lane | 24 | 22 | 15 | 25 | 21 | 21.4 |
| Right Turners | 0 | 3 | 0 | 1 | 0 | 0.8 |
Appendix B
Traffic Lights Time Averages from 6/28/2019
| data collected: 3:33-4pm then 4:35-4:45pm | North Traffic Lights | South Traffic Lights | West Traffic Lights | East Traffic Lights |
| Green Light | 34.853 seconds | 42.5 seconds | 1:30 minutes | 59.3 seconds |
| Yellow Light | 3.13 seconds | 2.98 seconds | 3 seconds | 3.72 seconds |
| Red Light | 1:28.67 minutes | 1:19.5 minutes | 1:18.5 minutes | 1:11 minutes |
| Left Turn Arrow Green | N/A | 10 seconds | 7.19 seconds | 10.32 seconds |
| Left Turn Arrow Yellow | N/A | 2.53 seconds | 2.51 seconds | 2.78 seconds |