
In the course of Performance Test 1 and 2, data was not collected due to the little effect the information had on the results. Performance Test 1 and 2 were only parts of Performance Test 3. Therefore, Team G deemed it safer to use the time to perform trial and error testing and to take data during Performance Test 3. The data below shows the data for each trial performed in Performance Test 3.
Performance Test 3.1 – 3.4

Trial 3.1 – 286.774 Joules
Trial 3.2 – 243.972 Joules
Trial 3.3 – 238.253 Joules
Trial 3.4 – 234.060 Joules
Performance Test 3.5 – 3.8
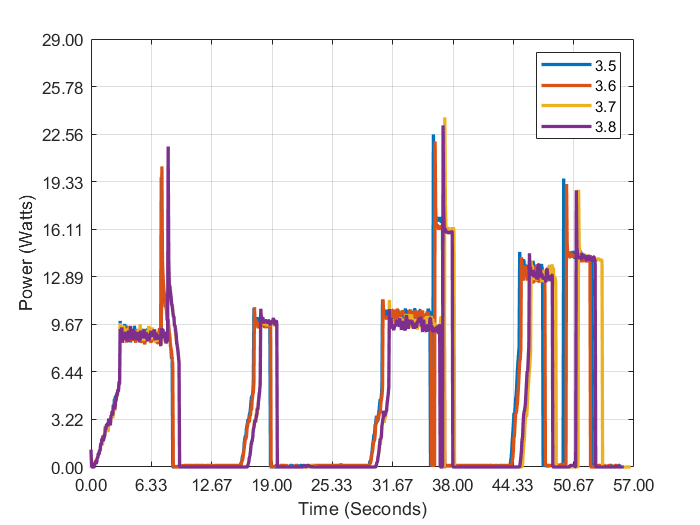
Trial 5 – 235.051 Joules
Trial 6 – 227.051 Joules
Trial 7 – 234.134 Joules
Trial 8 – 223.040 Joules
Performance Test 3.9

Trial 9 – 210.871 Joules
All in all, with each successive trial, Team G was able to keep saving power. Team G dropped from 286 Joules to 210 Joules throughout the course of Performance Test 3 and was on its way to going below 200 Joules. However, due to time constraints, Team G was unable to reach this objective. With one more day available, Team G believes that this goal could have easily been made with the use of celerate functions in the power brake command. Below is an outline of our total cost for the AEV that was ran with the final code. The Safety Violations that were incurred were a loss of a propeller ($10,000), AEV dropped off track (3 x $15,000), and the AEV hitting ground (3 x $15,000).
