Tar Spot and Fungicide Survey for Farmers and Crop Consultants

From Iowa State University Extension:

Planting is nearly here and folks are busy – but we are hoping you can help us with a tar spot and fungicide survey. This survey is the creative component for a Masters of Agronomy student, Kelsey Richie. She is hoping to get a better understanding of how tar spots may affect farmers’ decisions around fungicides. There are two surveys, one for farmers and one for crop specialists. If you could spare some time to complete the survey, it would be greatly appreciated.

The survey is only open until May 1st, so please give your input soon.

Enterprise Budgets from OSU Extension

I have had some calls about the location of the OSU Extension enterprise budgets for Corn, Soybeans, and Wheat. I thought I would share the information with the entire email list. Budgets are located at https://farmoffice.osu.edu/farm-management/enterprise-budgets#2022. You will need to scroll down on the page and choose the budget you are looking for under 2023.

Have a great week!

Virtual Corn College and Soybean School

Due to popular demand, the AgCrops Team will host the 2nd annual virtual Corn College and Soybean School on February 15, 2022, from 9:00 AM – 4:00 PM featuring your OSU Extension state specialists, including the new corn agronomist, Dr. Osler Ortez, and new soybean pathologist, Dr. Horacio Lopez-Nicora. CCA CEUs will be available during the live presentations. The cost of the program is $10. To register go to go.osu.edu/cornsoy. A zoom link will be sent after registering for the webinar. For more information contact, Laura Lindsey at 614-292-9080 or email her at lindsey.233@osu.edu.

2022 Corn College Soy School flyer.

Foliar Diseases May Affect Stalk Strength and Quality

By Pierce Paul, OSU Extension

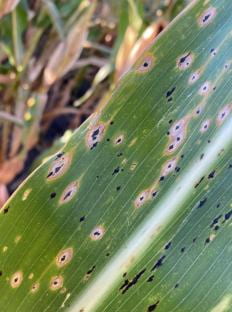
Causes of Stalk Rot: Several factors may contribute to stalk rot, including extreme weather conditions, inadequate fertilization, problems with nutrient uptake, insects, and diseases. This year, the combined effects of prevalent diseases such as northern corn leaf blight, southern rust, tar spot, and gray leaf spot may negatively affect stalk quality. However, the extent of the problem will depend on when these diseases develop and how badly the upper leaves of the plant are damaged. When leaves above the ear are severely damaged well before grain-fill is complete, the plants often translocate sugars from the stalk to fill grain, causing them to become weak and predisposed to fungal infection. A number of fungal pathogens cause stalk rot, but the three most important in Ohio are Gibberella, Collectotrichum (anthracnose), and Fusarium.

Checking for Stalk Rot: Symptom common to all stalk rots are deterioration and discoloration of the inner stalk tissues. Consequently, you can use the “squeeze test” or the “pinch test” to assess stalk rot and the potential for lodging without having to remove plants and split the stalks. Bend down and squeeze or pinch the internode of the stalk about 6-8 inches above the ground between the thumb and forefinger. If the inner node is easily compressed or collapses under pressure, you will likely have some type of stalk rot. The “push” test is another way to assess stalk rot and the risk for lodging. Gently push the stalks at the ear level, 6 to 8 inches from the vertical. If the stalk breaks between the ear and the lowest node, stalk rot is usually present. Stalk rot severity may vary from field to field and from one hybrid to another.

Consequences of Stalk Rot: Stalk rots may cause lodging, especially if the affected crop is not harvested promptly. On lodged plants, the ear on or close to the ground may develop ear rots and become contaminated with mycotoxins. In addition, lodging may lead to grain yield losses and slowdown the harvest operation.  However, it is not uncommon to walk corn fields where nearly every plant is upright yet nearly every plant is also showing stalk rot symptoms. Many hybrids have excellent rind strength, which contributes to plant standability even when the internal plant tissue is rotted or beginning to rot. However, strong rinds will not prevent lodging, especially if harvest is delayed and the crop is subjected to strong winds and heavy rains. To minimize these problems, harvest promptly after physiological maturity, even if you have to do so at a slightly higher moisture content (moisture in the lower 20s).

Grain Fill Stages In Corn

Please note: While many of the Corn Growth Stages are passed for Paulding County in the article from Bob Neilson, I received a few calls on later stage Corn Growth stages. The article below had some great comparison pictures. 

DATE: AUGUST 18, 2021 – INCLUDED IN ISSUE:

A stress-free grain fill period can maximize the yield potential of a crop, while severe stress during grain fill can cause kernel abortion or lightweight grain and encourage the development of stalk rot. The health of the upper leaf canopy is particularly important for achieving maximum grain filling capacity. Some research indicates that the upper leaf canopy, from the ear leaf to the uppermost leaf, is responsible for no less than 60% of the photosynthate necessary for filling the grain.

Kernel development proceeds through several distinct stages that were originally described by Hanway (1971) and most recently by Abendroth et al. (2011). As with leaf staging protocols, the kernel growth stage for an entire field is defined when at least 50% of the plants in a field have reached that stage.

Delayed planting of corn decreases the apparent thermal time (GDDs) required between planting and physiological maturity (Nielsen, 2019). A large proportion of that decrease occurs during grain filling and may be partially related to shorter and cooler days in late September and October that naturally slow photosynthesis and encourage plant senescence.

Silking Stage (Growth Stage R1)

Silk emergence is technically the first recognized stage of the reproductive period. Every ovule (potential kernel) on the ear develops its own silk (the functional stigma of the female flower). Silks begin to elongate soon after the V12 leaf stage (12 leaves with visible leaf collars), beginning with the ovules near the base of the cob and then sequentially up the cob, with the tip ovules silking last. Consequently, the silks from the base half of the ear are typically the first to emerge from the husk leaves. Turgor pressure “fuels” the elongation of the silks and so severe drought stress often delays silk elongation and emergence from the husk leaves. Silks elongate about 1.5 inches per day during the first few days after they emerge from the husk leaves. Silks continue to elongate until pollen grains are captured and germinate or until they simply deteriorate with age.

Silks remain receptive to pollen grain germination for up to 10 days after silk emergence (Nielsen, 2020b), but deteriorate quickly after about the first 5 days of emergence. Natural senescence of silk tissue over time results in collapsed tissue that restricts continued growth of the pollen tube. Silk emergence usually occurs in close synchrony with pollen shed (Nielsen, 2020c), so that duration of silk receptivity is normally not a concern. Failure of silks to emerge in the first place (for example, in response to silkballing or severe drought stress) does not bode well for successful pollination.

Pollen grains “captured” by silks quickly germinate and develop pollen tubes that penetrate the silk tissue and elongate to the ovule within about 24 hours. The pollen tubes contain the male gametes that eventually fertilize the ovules. Within about 24 hours or so after successfully fertilizing an ovule, the attached silk deteriorates at the base, collapses, and drops away. This fact can be used to determine fertilization success before visible kernel development occurs (Nielsen, 2016).


Silk appearance at R1

Closeup of ovules and R1

Continue reading

Did you miss out on our Ohio State University Corn or Soybean College?

Did you miss out on the Ohio State University Extension Corn or Soybean College on February 11th? We have an opportunity for you to rewatch the recordings.  The recordings are broken down into topics and smaller sections. If you are having any problems viewing, please reach out to me.

The recorded presentations up on our Ohio State Ag Crops YouTube Channel:

Pierce Paul summarized the Q&A portion of his session in the Corn Newsletter last week. You can access that summary here.

Grain Test Weight Considerations for Corn

R.L. (Bob) Nielsen
Agronomy Dept., Purdue Univ.
West Lafayette, IN 47907-2054
Email address: rnielsen at purdue.edu
Twitter: @PurdueCornGuy

Among the top 10 most discussed (and cussed) topics at the Chat ‘n Chew Cafe during corn harvest season is the grain test weight being reported from cornfields in the neighborhood. Test weight is measured in the U.S. in terms of pounds of grain per volumetric “Winchester” bushel. In practice, test weight measurements are based on the weight of grain that fills a quart container (37.24 qts. to a bushel) that meets the specifications of the USDA-AMS (FGIS) for official inspection (Fig. 1). Certain electronic moisture meters, like the Dickey-John GAC, estimate test weight based on a smaller-volume cup. These test weight estimates are reasonably accurate but are not accepted for official grain trading purposes.

The official minimum allowable test weight in the U.S. for No. 1 yellow corn is 56 lbs/bu and for No. 2 yellow corn is 54 lbs/bu (USDA-AMS (FGIS), 1996). Corn grain in the U.S. is marketed on the basis of a 56-lb “bushel” regardless of test weight. Even though grain moisture is not part of the U.S. standards for corn, grain buyers pay on the basis of “dry” bushels (15 to 15.5% grain moisture content) or discount the market price to account for the drying expenses they expect to incur handling wetter corn grain.

Growers worry about low test weight because local grain buyers often discount their market bids for low test weight grain. In addition, growers are naturally disappointed when they deliver a 1000 bushel (volumetric bushels, that is) semi-load of grain that averages 52-lb test weight because they only get paid for 929 56-lb “market” bushels (52,000 lbs ÷ 56 lbs/bu) PLUS they receive a discounted price for the low test weight grain. On the other hand, high test weight grain makes growers feel good when they deliver a 1000 bushel semi-load of grain that averages 60 lb test weight because they will get paid for 1071 56-lb “market” bushels (60,000 lbs ÷ 56 lbs/bu). Continue reading

Do your Ears Hang Low? – Premature Ear Declination in Corn

Collapsed ear shank of droopy ear

Collapsed ear shank of droopy ear

Taken from Purdue Extension, Chat and Chew Cafe – September 11, 2020 – Issue 2020.24 – By Bob Nielson

Droopy ears are cute on certain breeds of dogs, but droopy ears on corn plants prior to physiological maturity are a signal that grain fill has slowed or halted. Ears of corn normally remain erect until some time after physiological maturity (black layer development) has occurred, after which the ear shanks eventually collapse and the ears decline or “droop” down. The normal declination of the ears AFTER maturity is desirable from the perspective of shedding rainfall prior to harvest and avoiding the re-wetting of the kernels. PREMATURE ear declination, however, results in premature black layer formation, lightweight grain, and ultimately lower grain yield per acre.

What Causes Premature Droopy Ears? The most common contributing factor is severe drought stress that extends late into the grain-filling period. I have seen droopy ears in quite a few fields around Indiana these past few weeks in areas afflicted with severe drought stress. Even though Indiana has not experienced a lot of excessively hot (≥ 95o F) days in 2020, drought conditions coupled with sunny days and unusually low humidity (i.e., low dew point temperatures) result in significant evapotranspiration demands on the crop during grain filling. In most of the affected fields, the severity of leaf rolling and premature leaf death (senescence) due to drought stress was also high. Continue reading

Tar Spot – What is it?

Figure 2. Tar spot symptoms on leaves both on the lower and the upper canopy. (Photo Credit: Darcy Telenko)

While I have been out in Paulding county scouting in the last week, I have not noticed any tar spot in our cornfields as of yet.  It could be there though as I am not walking in every field. I wanted producers to take note of what Tar Spot looks like and some monitoring from our neighbors in Indiana and information from a previous CORN New Article.  Continue reading

New Crop Staging Videos

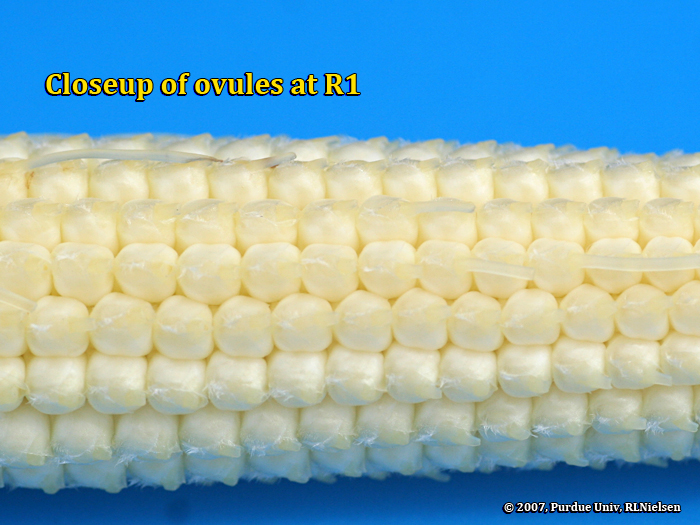
A new suite of crop staging videos has been built by faculty at The Ohio State University that highlight corn, soybean, and alfalfa. The videos highlight some common staging methods for each crop and connect the staging guidelines to practice using live plants in the field. The videos can be found in the “Crop Growth Stages” playlist on the AgCrops YouTube Channel: https://www.youtube.com/channel/UCbqpb60QXN3UJIBa5is6kHw/playlists. These compliment some of the wheat staging videos previously posted on the AgCrops YouTube channel as well. As the crops progress through the reproductive stages, expect some more videos to be posted! Continue reading

Revisiting Corn Use for Ethanol

By: Todd Hubbs, Department of Agricultural and Consumer Economics, University of Illinois.  farmdoc daily (10):133

Stronger export numbers and lower acreage boosted corn prices since the end of June.  Concerns about demand weakness in ethanol production emerged recently.  A recovery in economic activity helped ethanol plants ramp up production as gasoline demand increased.  A resurgence in virus incidences threatens ethanol production over the short run and injects uncertainty into long-run prospects.

Gasoline demand recovered to almost 89 percent of pre-coronavirus lockdown levels in early July.  Despite this positive development, the recovery in demand flattened out over the last few weeks.  Gasoline stocks began to recede but still sit substantially above levels seen at this time of the year.  Attempts to reopen the economy hit a snag as the virus spread rapidly around the country after initial hopes saw a rapid opening in many areas.  At 8.648 million barrels per day, demand recovered substantially from the low point of 5.311 million barrels per day seen in early April.  The path back to normal gasoline demand levels appears stalled.  Ethanol production followed this recovery and will feel the implications of flattening gasoline use. Continue reading