Glad to See It Come, Glad to See It Go

Thanks for Les’ contribution last Monday in his post – Is February the New March?  This is a more Mansfield-centric take on the 2024 season with a more in-depth analysis of statewide Growing Degree Days to compliment last week’s content.

What a season!  That sums it up in all the best and worst ways.  I stand by the words I typed in my 2/19 post – I believe we nailed our tapping date just about perfect.  The first run to follow was a marathon of 7 or 8 straight days, and the second run of the year culminated in our making syrup off the new OSU teaching evaporator for the first time ever.  Though many producers’ woods performed below average in terms of sap sugar, our Brix registered consistently at 2.0.  Talk about some highs.

We knew better.  The weather folks are not infallible, but there was no denying the forecast that lurked.  Warm, warm, and more warm.  But unexpectedly, February 21st was the death blow for our season.  While we were over at Malabar Farms helping out with an NRCS workshop on maple, our pump decided to quit working.  Without vacuum, the productive days of our season were over.  With a full season, we would likely have stayed tapped in until March 4th and posted one of our better season totals.  As it turned out in reality, the 2024 season ended on a low.

Looking more broadly around the state, the progression of Growing Degree Days (GDDs) was alarmingly early yet again.  If there any producers still resistant to the idea of tapping earlier than more traditional dates, then I don’t know what it will take to change minds.

Observe – Click Play for an animation of GDDs from 2021 (below).  Pay attention to 2 data points in particular.  First, the GDDs accumulated through March.  Second, the scale of GDDs on the legend.

Now, you don’t even need to see a similar video of 2024’s GDDs to know we covered lots more ground in fewer days than the previous year’s example.  Long story short, earlier AND hotter.  Hello sap season double whammy, goodbye sanitation!  I don’t believe many producers will be heard pining – “Boy! What I wouldn’t give for another season like 2024!”  And if you did hear such a remark today, then you probably also heard them quip – April Fool’s!!

Is February the New March?

Remember when Les said he would come back at the season’s conclusion to tell you in 20/20 hindsight exactly what you may already suspect, he’s back to make some sense of the 2024 sugaring season!  Enjoy.

The Ohio maple syrup season ended on the first weekend in March.  This comes less than a week after President’s Day, the traditional starting date for the season in Ohio.  Of course, not this year as many Ohio producers started the 2024 season in January.  If you are a maple producer, you must wonder if the climatologist and everything we have been hearing about our climate is right.  Is February becoming the new March?  

Let’s analyze what we have seen and experienced in 2024.  OSU Climatologist Dr. Aaron Wilson has been telling us that the winters will get milder, and Spring will come earlier.  Once again, I refer to historical weather data to make a point using Weather Underground weather history maps.  Dating back to 2021, here is what I consider a relatively normal March (below).

Here is February of this year, 2024 (below).

It has been reported over the last several months that we ended 2023 with almost record-breaking high temperatures for November and December.  In fact, the climatological winter (December, January, and February) was the third warmest on record.  The 2nd warmest occurred in 1931.  The warm weather sent a warning to many maple producers, alerting them that something unusual was about to happen.  In Ohio, those that tapped in mid-January got it right.  Those tapping right after the first of the year were rewarded with 6 to 8 weeks of maple producing weather.  Many recorded over 14 boils before the first of March.  This year undoubtedly sets a new benchmark for early tapping.  Why did this happen and what can we learn from the experience.

The winter of 2023/24 followed the long-range forecast’s prediction.  With the exception of the invasion of a cold air mass in mid-January, the mild temperatures came back and continued throughout February.  This set up some extraordinarily good runs throughout the state.  However, a troubling and confounding factor was the overall lack of moisture.  I would say that many parts of Ohio were below average on moisture during this period.  Dryness in the woods is not good for maple production.  It is much preferred to have 4 to 8 inches of slowly melting snow, at the very least, lots of rainy days interspersed through the season.  I have seen woods that face north where the snowpack will last almost to the end of March.  These woods have produced good runs all the way to the end of March and even into April.  Not this year.

Here is the graph (above) showing the high, low, and average temperatures for the first two weeks in March.  The important thing to look at here is the minimum and maximum temperatures that clearly show we not only had daytime temperatures in the first two weeks March above 50 degrees F, but also had nighttime temperatures that approached and even hit 50 degrees.  This totally wiped out the freeze/thaw cycle, and we all know you cannot make syrup without a freeze/thaw cycle.  Sustained temperatures above freezing will undoubtedly be a recurring problem into the future.  Warm temperatures also accelerates the accumulation of Growing Degree Days, pushing the trees toward budding.  However, buddy sap did not end the season in much of Ohio.  It was the acceleration of microbial growth resulting from an abundance of unseasonably warm temperatures causing the sap to warm and foul systems.  It is almost impossible to make quality syrup under these conditions.  During the Ohio Maple Tour, I tasted multiple samples of syrup made in early March.  Just about all had that sharp taste of syrup made from sour sap.

Now comes the real challenge!  How do we prevent the possibility of this very marginal syrup from entering the market?  Especially in a year when many producers in states like Ohio had a poor year and now have syrup of questionable quality to sell.  Do you bottle the syrup and hope no one notices?  After all, it may have good color somewhere between Amber and Dark Robust.  The rationale in the past has been that most customers will not pick up on the off flavor; after all, they are used to high fructose corn syrup imitations.  The question now turns becomes, how much high-quality syrup will be made in the Northeast and in Canada this year?  Will the syrup they sell to the big box stores have better quality than what our customers can buy locally?  We already know it will most likely be less expensive.

In the end what have we learn? We added one more year to the string of abnormally warm maple seasons that we have experienced over the last 5 years.  For Ohio producers tapped in January, many experienced a near normal season.  Operations made some very good syrup that did not have quality issues.  Their markets are covered.  This also means that in 2025 when New Years Day rolls around, those producers who gambled right in 2024 will again be ready to tap trees at the first signal of good sugaring weather.  Unfortunately for many Ohio producers tapping later in the calendar, this year will be a hard lesson.  Those that tapped after mid-February found out that you cannot trust Mother Nature, because she does not read the Calendar.

A Little Science behind Maple Sugaring Weather

Hands down, the number one question that comes up this time of year is “When should I tap?”

Due to the warmest December on record, I have heard a few Ohioans even asking “Should I have tapped in December?”.  When you look back over the years, the trend has been toward earlier tapping dates, but hoping that you can keep taps open for 3+ months is a bit of a stretch.  There is no way that will happen on a gravity system, and you will need more than a little luck even on high vacuum.

The scientific approach to planning involves studying climatological data and developing a plan based on that data. The maps below are long range weather predictions for the next three months. You can clearly see that all indications point to above normal temperatures for the next three months. For sugar makers what does this mean?

To quote a good friend and fellow maple researcher, “when you look at forecasts you need to look at it from the big producer / small producer perspective.”  Because most small producers tap everything at one time, they need to consider the value of a good short-term, 30-day forecast.  In most cases, especially if you are on a gravity system, you need to find the best 30-day window that will allow you to make the most syrup.  Once you tap, you are on the clock and that clock runs out shortly after 30 days.  On the other hand, if you are a large producer or even a medium producer on vacuum, you need to study yearly trends.  Trends will disclose what has happened over the last 3 to 5 years.  What we have seen is a trend to earlier tapping just about every year.  In most cases, early tapping has paid off in Ohio.  A major reason is that newer technology lends itself to pushing the envelope when it comes to tapping.  You have the advantage of running a semi-closed vacuum system utilizing 24/7 operation.  This lengthens your season considerably.

One of the most valuable pieces of data you can use are temperature history graphs for your location.  Weather Underground has some of the best.  They plot the maximum, minimum, and average temperatures.  Plotting the maximum and minimum will give you a good idea on the number of freeze-thaw days to anticipate for a month.  As we all know, freeze-thaw cycles are very important and drive daily sap runs.  You can look at these cycles over a five or even ten year period.  Over time you begin to see how various weather patterns play out.

Keeping in mind these are zip code specific but we are talking at the broad scale of an entire state, here are three February graphs. You can clearly see we started February leaving a warm end to January on two out of the three graphs.  In all the graphs, conditions continued to warm up as February wore on.  In two out of the three, the temps dropped going into March.  This may be a hint for what could happen this year.  2020 and 2022 were almost normal.  In both cases, our records show average to above average production.  2021 was the outlier and production was down for that year as temperatures stayed warm through most of March.  The other two years highlight the fact that starting out February warm does not mean you will march into March warm.

Too much science?  Here is a more common sense approach that prioritizes the size of your operation.  If you are tapping thousands of taps, you must start early to get the job done.  For a moment, think about a huge 50,000-tap operation.  Should they consider tapping right after the first of the year?  Definitely!  One of their strategies is to tap 5,000 taps super early.  This results in the Facebook posts you may have seen bragging about syrup being made over Christmas.  Several big producers in the East did this in December.  Does that mean they tapped everything?  Most likely not.  A large commercial producer hedges their season by tapping some early and the rest over the month of January with everything in the tree and ready by February 1.  Small producers who are setup to boil early can also do this, the only difference is they may start tapping their early running trees shortly after New Year’s but plan to finish out in February.  This keeps fresh taps in the system and prevents you from putting all your eggs in one basket.  The best way to accomplish this is to keep very good records.

That brings us back to our initial question.  When should I tap this year?  All indications are that we are going to have a warmer than normal winter.  If you are in Southern Ohio, you might be tapped already.  North of I-70, you should probably hold back until the end of January.  This is where analyzing the 30-day forecast is critical.  Studying several long-range forecasts a little closer, I noticed that we may have some of the coldest weather of the winter on the last week of January and the first week of February.  While the forecast is showing a warming trend coming off several weeks of genuine cold weather, depending on your situation you may even want to hold off until the first week of February.

Of course, the joker in the deck is the El Nino weather event we are experiencing.  El Nino’s are known for extremes and all it takes is a bend in the jet stream and you could be looking at 10 more days of below average weather.  Once this happens, you usually go right back to the warmer than normal pattern.  In this case, cold weather is your friend.  What we do not want is 10 days straight above normal!

As for my prediction!  I will tell you what kind of season we had in 2024 on the first week in April.  May your sugar season be long and sweet.

Anyone Tapping Yet?

When to tap?  That is the question.  And when it comes to maple sugaring, that is THE question.  Currently, we are in the holding position at our Mansfield sugarbush and thankful for the cold temperatures that have descended on the region.  The longer the woods stay cold, the closer our trees will get to meeting their chilling requirement, and the more optimistic I will be when we do eventually start our season.  Put simply, if trees don’t sleep well, they can wake up cranky!

When we look to the south along the Ohio River, I see more good signs of zero accumulated growing degree days since the start of the year.  Note, this does not account for any warm spells we had around Christmas.

With that map in mind, a peek at online chat forums like the Maple Trader’s Ohio Forum reveals that several folks are already tapped in part or in full (January 2nd in Ross County, another early report out of Muskingum County).  Looking even further south to states like Kentucky and West Virginia, only early tappers were rewarded with last year’s ultra-warm and sporadic 2023 season.  That likely pushed some producers to move their tapping date earlier on the calendar.  Still, others are crossing their fingers that last year was an anomaly and going with a more traditional schedule again for 2024.

Taking the forecast up top at face value and speaking directly to our Mansfield site, there aren’t many (if any) quality freeze-thaw cycle days for a truly big run in the next 2 weeks.  If we do decide to tap in a week or so, we should at least get all our lines flushed and spot check the vacuum on the system while we wait for better conditions to kick things fully in gear.

Come back next week for a post from Les Ober where he discusses the question of tap timing and the effects of El Nino as we all wring our hands and stare into muddy crystal balls in search of the right answer to our question!

Mid (Late?) Season Update

Chaos and unpredictability are apparently the new normal in the maple woods.  Fool me once, shame on me.  Fool me twice, well…you know the rest.  The past 2 sap seasons and current year’s production continues to highlight a new normal of early spikes in warm temperatures and the importance of being ready and willing to tap earlier than traditionally expected.  Producers wed to a historical norm will likely pay hefty cost this year.  Honestly, given the next few days of warm temperatures, we’re not sure our sap season will even make it to March 1st.

Our red x silver maples are starting to bloom and will likely be at or near full bloom by this weekend.  Though the buds on our sugar maples are still tight, the growing degree days (GDDs) are accumulating fast and tapholes are starting to dry up.  Hopefully those slowing tapholes are a combination effect of not just the warm temperatures but also the dry winter we have experienced.  I am not seeing much hope to erase the warm temperatures, but we are supposed to get drenched with a couple inches of rain tomorrow – that should help.

Here’s a photo I took this morning of the muddiest spot in our entire woods.  It is now bone dry and the used-to-be-mud is starting to crack and split.

The next week or two will tell the season’s tale – will we achieve an average season total, come up short again (maybe that’s the new normal?), or be surprised by a late spurt to make the year memorable in a positive way?  Only time will tell.

How to Combat Buddy & Sour Sap – The Path to QUALITY Syrup (Part 4)

Prevention of sour sap is all about sanitation. Here are a few things to consider when developing a sanitation plan for your maple operation. As soon as the previous season ends, producers using tubing need to clean and sanitize their lines. There are many ways to do this, but the most important thing is to make sure it gets done. As the new season approaches, inspect your lines for sanitation problems, consider replacing not only the spouts but the drops and tees if needed. As the new season begins, producers using high vacuum should consider running your vacuum 24/7 to keep your lines clean, clear, and cool.  During the season, make sure you wash your holding tanks often to prevent microbial scum buildup.

Where sap is held for a long period of time, avoid using plastic tanks for long term sap storage. Plastic is porous and retains bacterial inoculum that will quickly generate bacterial growth. These plastic tanks are often referred to as commercializers, named after the old commercial grade of syrup that nobody wanted. Once a plastic tank becomes contaminated, they are almost impossible to clean and should be replaced.

In the sugarhouse, making quality maple syrup starts with your reverse osmosis (RO) unit. Concentrate must be evaporated as soon as it comes off the RO. Bacteria multiply quickly in concentrated sap. This is the result of a higher percentage of sugar in the concentrate. There is also an increase in the sap temperature as it moves through the RO. It may enter the RO at 40 degrees F or less, but when it comes out, it will be closer to 50 degrees F. High Brix concentrate, elevated sap temperatures, and a warm sugarhouse are the perfect recipe for taking good sap and turning it into a microbial cesspool if not careful. This is one of the reasons many producers are now considering using refrigerated milk bulk tanks to store concentrate. This cools the concentrate and allows more time to manage the boiling process.

Producers often accept the fact that concentrate left on the evaporator overnight will produce a darker grade syrup, at least until fresh sap is introduced.  This does not have to happen if managed properly.  Small evaporators should be drained if possible. Larger evaporators can be equipped with a wash system that allow the entire evaporator to be cleaned and drained. Once the syrup leaves the evaporator, the process of sanitation continues. Syrup should be filtered and placed in a stainless-steel drum after being reheated to at least 180 degrees F. There is an inherent risk when you attempt to drum syrup at lower temperatures. Spoilage happens when barrels are packed at low temperatures. The hot syrup and cold barrel causes condensation (H2O) which combines with the remaining air in the barrel ultimately resulting in mold and fermentation.  It is best practice to place filled barrels in a cool place like a basement or a barn that does not heat up. Another practice worth looking into, is to build a cool room by equipping  a small insulated room with an air conditioner.

When you re-open a barrel of syrup, you should have syrup that is ready to bottle. When you bottle your syrup bring the syrup back up to 185 degrees for packing. Syrup packed below 185 F is subject to spoilage and reduced shelf life. Going above 190 also creates several problems. And if the syrup peaks above 200 F, the syrup will start to foam, and niter will start precipitate. The only solution for this scenario is to filter the syrup again. You will also overheat your jugs causing them to contract and suck in if they are not 100% filled. Plastic jugs should always be filled within a half inch of the top and laid on their side to kill any bacterial that may have found its way in the jug.  If you pack in glass bottles, make sure you put your bottles in the oven at 200 degrees for a few minutes. Hot glass will not condensate moisture and you can eliminate most problems with this simple step. It is always good to pack several times over the course of the year to maintain the highest quality in your syrup.

Many years ago, there was a use for commercial outlet for sub-standard syrup. The majority was sold to the tobacco industry. It was used to sweeten chewing tobacco. That outlet for the most part no longer exists. There are places where substandard syrup could be used but its objectionable flavor drastically lowers its value. For this reason, there is now a movement to prevent this type of syrup from getting into the market. Bulk buyers no longer want to handle sub-standard syrup and if they buy it they are not going to pay very much for the product. In addition, there is a currently an effort by the International Maple Syrup Institute and others to promote educational programing to raise producer awareness about ways to avoid producing this kind of syrup. The reality is that there is very little economic return from sub-standard syrup production. With rising costs of equipment and inputs the production of anything less than top quality saleable syrup in today’s high demand market is foolish.

There you have it – a 4-part series starting with a lesson on phenology and how to track growing degree days, relating growing degree days to tree bud development, appreciating the differences between buddy sap and sour sap, taking sanitation seriously at every single phase, and PRESTO! viola! alakazam (if only it were that easy!!) – you are making QUALITY maple syrup!

Off-Tasting Syrup: Understanding the Culprits (Part 3)

Now that we have talked about tree phenology and maple buds and growing degree days, let’s the talk more about the main prize of every sugarmaker’s dream – QUALITY syrup!  As we get ready to embark on a new maple season, let’s go over some of the things that will help you to improve the quality of your syrup in 2022. We all know that paying attention to detail in the woods will pay off with big rewards; however, the place where paying attention to detail is most important is when the sap or concentrate is on the evaporator. The finishing process can make or break your operation. Maple production is becoming a very competitive business, and the producers making the highest quality syrup will rise to the top.

Here is an oversimplification of what happens during the syrup-making process.  Once bacteria are introduced into the sap, a conversion of sugars takes place. A portion of the maple sap, which is almost 100 percent sucrose, is converted into glucose and fructose. This portion of the sugar content makes up the invert sugars present in syrup. When the sap is heated (The Maillard Reaction – something you can read more about here) the color of the syrup and the flavor of the syrup is formed, largely based on the amount of glucose and fructose sugars and other factors happening at the same time.  Thus, the level of microbial interaction plays a vital role in determining the color, grade, and corresponding flavor profile of the syrup produced. So, as you can see not all microbes are bad, in fact they are essential to everything we love about maple syrup!

Sap flowing from the maple tree is sterile, so where do the microbes come from?

Microbial activity begins as soon as sap is exposed to the outside environment. Early in the season microbial development is slow due to the normally cold temperatures, but once warm weather arrives (above 50 degrees F), more and other strains of microbes begin to multiply in the sap. As the microbes interact with the sap, the syrup produced darkens and develops an increasingly bold and pronounced maple flavor. Microbe colonies continue to expand eventually resulting in very dark and viscous syrup with an unpalatable strong flavor. Because this degradation of the sap is more likely to occur at the end of the season, low quality syrup is often associated with tree budding which happens at approximately the same time.

If you did a taste comparison, you would notice is a definite difference between buddy syrup and sour sap syrup. Buddy syrup has a chocolate flavor akin to what a Tootsie Roll tastes like while sour sap syrup has a bitter sometimes fermented taste that stays in your mouth. If you boil buddy sap, it will produce a pungent unforgettable smell. Sour Sap thickens to the point where it cannot be evaporated and will be difficult to draw off the evaporator. In extreme cases, you can pour a stream out and it will suspend in midair. This is referred to as “ropey syrup”. Sour sap is a result of intense microbial activity that builds anytime during the season when environmental conditions are right for bacterial growth. Buddy syrup comes from sap collected when the buds emerge naturally from the tree. This is a normal physiological growth stage that occurs every year.

Both processes require and progress with seasonal warming. In a normal season, the two tend to occur simultaneously and accelerate at the end of the season. Though the two are correlated, it is important for producers to understand the differences if you want to avoid the problems associated with each.


Maple Buds and the Story They Tell (Part 2)

We have all heard it (or said it) – once the maple trees ‘bud out’ the sap collection season is done.  “Done” meaning the sap has become buddy and making syrup for the season is over.  Our eyes see it and we know to expect it, but we all hold out for just one more day of collection before the tide turns.  That day or the very next, the sweet smell of sap turns sour.

The good news is you don’t have to rely completely on your nose when boiling that last batch of sap.  Keep a close eye on how the tree buds develop as the season progresses.  When you start the season the buds are tight.  As the season progresses and the weather changes towards spring, the tree buds tell the story. We can use our eyes to track bud development as the season progresses, the weather warms, and making syrup draws to a close.  The good news is that this progression is somewhat predictable if one understands how something called growing degree days (GDDs for short) correlate.  Read Part 1 released last week to learn how you can start tracking GDDs and incorporate them into your season planning.

Using a 60-power spotting scope we took pictures of our trees on March 17th, 23rd and 27th during the 2021 sap season.  The bud progression is for sugar maple and a red x silver native hybrid maple that are present at the Ohio State Mansfield sugarbush.  For reference, we deemed our sap no longer worth collecting on March 21st.

First the red x silver “mystery” maple – in the March 17th photos, the hybrid’s buds are noticeably swollen but the flowers have not burst forth yet.  In the branch I’m holding, you can see the flower buds cracking open with the leaf bud still tightly closed in the center (black arrow).  This is crucial to understand because trees have both flower buds and growth buds which break at different times and have different impacts on the sugaring season.

By March 23rd, despite the difficult lighting, the buds have clearly flowered.

This is even more apparent on March 27th when I took the last set of photographs.  Examine the leaf bud (in the black circle) which is protruding more but still closed surrounded by the bright red maple flowers.  Our operation’s sap edged towards being “buddy” in the last 2 days preceding the red maple buds popping completely out.

For the sugar maple photos, the differences are more subtle and the progression is slower – a timeline we talked about in Part 1 last week.  In the March 17th pictures, the buds were barely noticeable at the ends of the uppermost twigs of the trees; however, buds were more prominent 6 days later.

By March 27th and nearly a week after we had closed down the sugarbush, sugar maple buds were elongated and swollen and obviously scaled but not yet officially burst open.

All in all, this was a great exercise to watch how trees go through the season’s progression as the weather changes.  A set of binoculars is a handy tool for the sugar maker; pick some key trees in your woods and watch their buds next year.  Better yet, keep detailed notes and be a studious observer of 3 primary things: sap quality, tree bud development, and those GDDs we mentioned earlier.  Once you are familiar with what the bud progression looks like relative to your tree’s sap production, you will have information to align alongside GDDs for anticipating when the end of the season is near.

The Ohio State Phenology Calendar: Understanding Nature’s Biological Clock (Part 1)

A special thanks to Denise Ellsworth from OSU’s Department of Entomology for contributing her phenology expertise that makes this article possible!

Phenology, sometimes referred to as the world’s oldest science, is the study of recurring biological events and their relationship to weather and climate. Examples of phenological events include bird migration, flowering of plants, and the seasonal appearance of insects. Because the growth and development of plants depend on temperatures, phenological events of plants, such as bud swelling or flowering time, may be useful for monitoring short-term weather patterns. Likewise, scientists can detect long-term changes due to climate change by tracking the pattern of phenological events over many years.

Insects emerge earlier in warmer years than in cooler years, and plants bloom earlier too. The critical assumption in the use of plant phenology to predict other biological events is that the phenological sequence (the order in which events occur) remains constant from year to year even when weather patterns differ greatly. It is no mystery, even to a novice sugar maker, why plant phenology matters in maple. The quality of maple syrup is at stake! Once the phenological calendar for a sequence is established, the biological calendar is easily monitored to anticipate when maple syrup quality drops. If phenology can be grasped, this can greatly simplify the logistics of planning and scheduling monitoring programs, post-season clean-up and sanitization, and other critical activities. And using phenological sequence is valuable to a whole host of applications beyond just maple—beekeepers, naturalists, and gardeners also use the predictable patterns of nature to predict plant bloom and other biological activity.

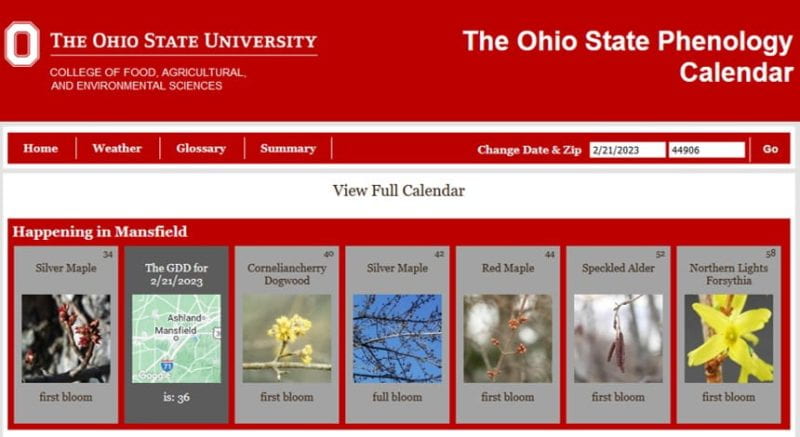
On The Ohio State University Phenology Calendar website, degree-day data and related plant bloom and pest emergence sequences are accessible for any location in Ohio.  A degree-day is a measure of the amount of heat that accumulates above a specified base temperature during a 24-hour period. A degree-day is also referred to as a growing degree-day (GDD), heat unit, or thermal unit. One GDD accumulates for each degree the average temperature remains above a specified base-temperature over those 24 hours. Several degree-days can accumulate during a 24-hour period.  However, it is important to understand that degree-days have meaning only in relation to the base temperature that has been specified. The Ohio State Phenology Calendar uses 50 degrees F as the base temperature. To provide an example, if the average temperature over a 24-hour period is only 47 degrees F with a base temperature of 50 F, no GDDs would accumulate. However, if the 24-hour average temperature was 55 degrees F, 5 GDDs would be added to the phenology calendar (more on degree day calculation here).

To inform The Ohio State Phenology Calendar, daily temperature data from 12 OARDC Research Stations and three USDA-ARS weather stations located throughout Ohio are used to calculate cumulative GDD in real-time.  Calculations for locations between weather stations are extrapolated from climatic isotherms for Ohio.  Upon entering a date and any Ohio zip code, degree-day accumulation for that location is calculated, and the user is directed to the appropriate spot on the phenology calendar to determine what plants are blooming and what pests are active in their locale.  By scrolling through the full phenological calendar, it is possible to see what blooming and pest events have already occurred, as well as what has yet to occur.  And by clicking on the Summary tab, you can get a year-by-year breakdown of GDD count for the same date and zip code location across the past 6 years.

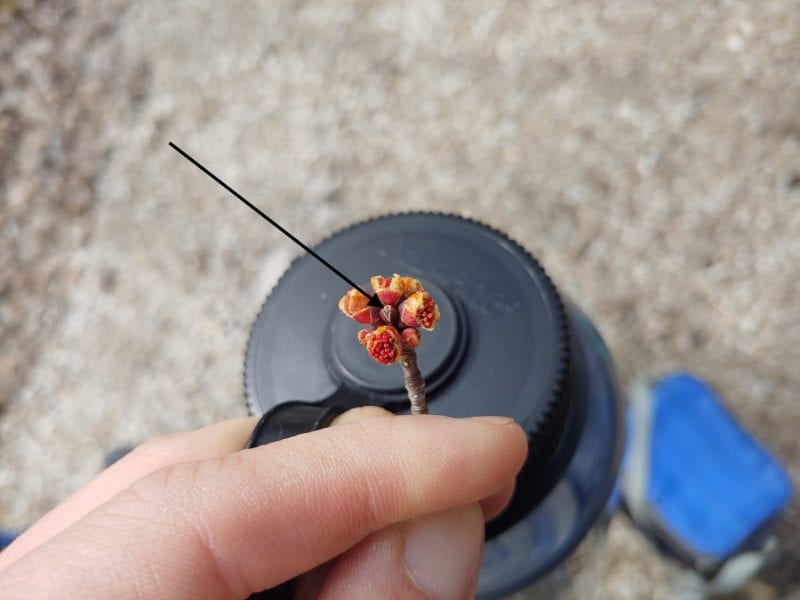
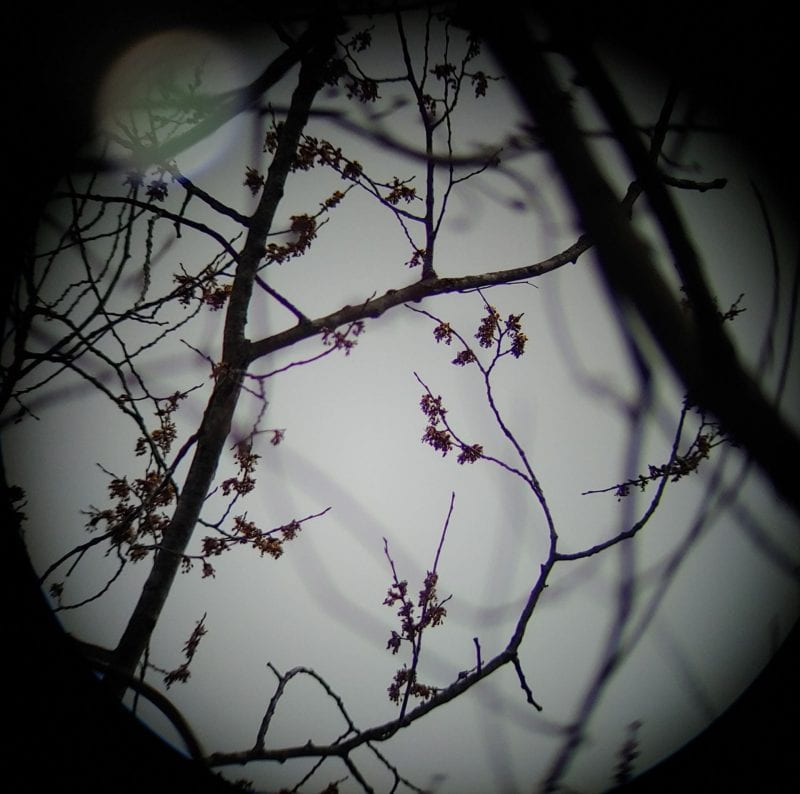
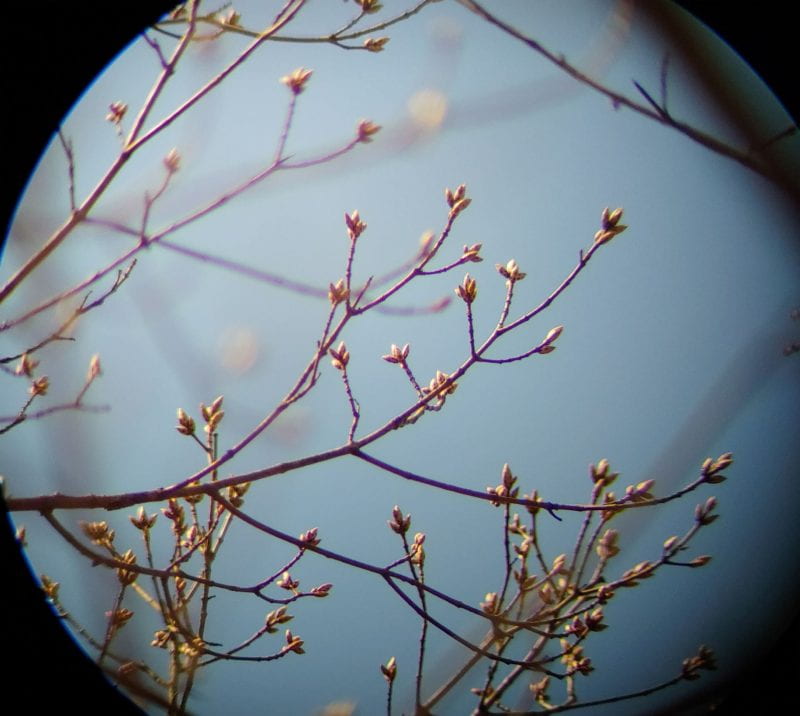
It is important to define a couple terms as we launch into species-specific phenology.  First bloom is defined as the first flower opening to expose sexual parts. Full bloom is when just one out of twenty buds is still closed while all others are open to expose sexual parts.

Of particular interest to maple producers, silver maple is listed first with 34 GDD at first bloom. A bit further down the sequence, silver maple reappears with full bloom at 42 GDD.  Red maple first bloom follows at 44 GDD just after silver maple full bloom. Red maple full bloom averages 75 GDD.  Sugar maple is not currently listed on the GDD calendar; however, it is believed that sugar maple tracks very closely with black maple – another of the “hard” maples.  While there is some uncertainty about the exact GDD timing for sugar maples, they are definitely “late bloomers” as compared to their “soft” maple counterparts.

The consistency in phenological sequence from year to year demonstrates that even one year of observation is useful to expand the phenological sequence to other plants or insects not included on the OSU calendar. This means that users can readily create, expand, and customize their own biological calendars by observing plants in first or full bloom and taking note of the GDD for that date on the OSU calendar. Many observers use a journal or excel file to track plant and insect activity from year to year, adding in new plants or insects of interest. These calculations can even be made by referring to photographs that show first bloom or full bloom; the photo’s date and location can be entered on the OSU calendar to determine the GDD for that event. Insect observations should be of developmental stages, such as egg hatch or adult emergence.

For the maple producer, understanding the predictability of nature’s patterns is crucial for better anticipating the end of each maple season. For years and years, sugar maple bud break was the traditional visual signal to take down buckets and end the sap season. Unfortunately, lots of poor-quality sap was made waiting for those first buds to break. Now we know that physiological changes occur within the tree prior to actual bud break that bring seasons to a close earlier. And sanitation issues that result in “sour” sap (due to bacterial build-up) halt most sap seasons before “buddy” sap is rampant. While we are excited to continue tracking sugar maple performance relative to GDDs, keeping an eye on the 100 GDDs mark is a rough indicator for when things are winding down. Some woods will shut down earlier and others will stretch a bit later, but when the Forsythia approaches full bloom in your yard – which occurs right around 100 GDDs depending on variety – you can be sure the end of your sugaring season is nigh.

New Article Series Launches Next Monday

This short post will serve as a sort of guidepost, a table of contents or roadmap if you will, for the next month or so worth of content.  We are excited to bring you a 4-article series on maple phenology.  Phenology is a fancy word for describing nature’s calendar.  We’ll discuss one of the most practical and accessible tools for tracking phenology – the growing degree day, or GDD for short.  Second, we’ll seek to understand and document how GDD is related to species-specific patterns in maple bud and bloom timing and why that matters for maple producers.  Then over the course of two installations, Les Ober will break down why an improvement of one’s understanding of maple season timing is particularly important towards the season’s end and how you can minimize and prevent unwanted bouts with “sour” or “buddy” sap.  After all, our main goal is promoting sustainable production of high quality maple syrup!