Glad to See It Come, Glad to See It Go

Thanks for Les’ contribution last Monday in his post – Is February the New March?  This is a more Mansfield-centric take on the 2024 season with a more in-depth analysis of statewide Growing Degree Days to compliment last week’s content.

What a season!  That sums it up in all the best and worst ways.  I stand by the words I typed in my 2/19 post – I believe we nailed our tapping date just about perfect.  The first run to follow was a marathon of 7 or 8 straight days, and the second run of the year culminated in our making syrup off the new OSU teaching evaporator for the first time ever.  Though many producers’ woods performed below average in terms of sap sugar, our Brix registered consistently at 2.0.  Talk about some highs.

We knew better.  The weather folks are not infallible, but there was no denying the forecast that lurked.  Warm, warm, and more warm.  But unexpectedly, February 21st was the death blow for our season.  While we were over at Malabar Farms helping out with an NRCS workshop on maple, our pump decided to quit working.  Without vacuum, the productive days of our season were over.  With a full season, we would likely have stayed tapped in until March 4th and posted one of our better season totals.  As it turned out in reality, the 2024 season ended on a low.

Looking more broadly around the state, the progression of Growing Degree Days (GDDs) was alarmingly early yet again.  If there any producers still resistant to the idea of tapping earlier than more traditional dates, then I don’t know what it will take to change minds.

Observe – Click Play for an animation of GDDs from 2021 (below).  Pay attention to 2 data points in particular.  First, the GDDs accumulated through March.  Second, the scale of GDDs on the legend.

Now, you don’t even need to see a similar video of 2024’s GDDs to know we covered lots more ground in fewer days than the previous year’s example.  Long story short, earlier AND hotter.  Hello sap season double whammy, goodbye sanitation!  I don’t believe many producers will be heard pining – “Boy! What I wouldn’t give for another season like 2024!”  And if you did hear such a remark today, then you probably also heard them quip – April Fool’s!!

Is February the New March?

Remember when Les said he would come back at the season’s conclusion to tell you in 20/20 hindsight exactly what you may already suspect, he’s back to make some sense of the 2024 sugaring season!  Enjoy.

The Ohio maple syrup season ended on the first weekend in March.  This comes less than a week after President’s Day, the traditional starting date for the season in Ohio.  Of course, not this year as many Ohio producers started the 2024 season in January.  If you are a maple producer, you must wonder if the climatologist and everything we have been hearing about our climate is right.  Is February becoming the new March?  

Let’s analyze what we have seen and experienced in 2024.  OSU Climatologist Dr. Aaron Wilson has been telling us that the winters will get milder, and Spring will come earlier.  Once again, I refer to historical weather data to make a point using Weather Underground weather history maps.  Dating back to 2021, here is what I consider a relatively normal March (below).

Here is February of this year, 2024 (below).

It has been reported over the last several months that we ended 2023 with almost record-breaking high temperatures for November and December.  In fact, the climatological winter (December, January, and February) was the third warmest on record.  The 2nd warmest occurred in 1931.  The warm weather sent a warning to many maple producers, alerting them that something unusual was about to happen.  In Ohio, those that tapped in mid-January got it right.  Those tapping right after the first of the year were rewarded with 6 to 8 weeks of maple producing weather.  Many recorded over 14 boils before the first of March.  This year undoubtedly sets a new benchmark for early tapping.  Why did this happen and what can we learn from the experience.

The winter of 2023/24 followed the long-range forecast’s prediction.  With the exception of the invasion of a cold air mass in mid-January, the mild temperatures came back and continued throughout February.  This set up some extraordinarily good runs throughout the state.  However, a troubling and confounding factor was the overall lack of moisture.  I would say that many parts of Ohio were below average on moisture during this period.  Dryness in the woods is not good for maple production.  It is much preferred to have 4 to 8 inches of slowly melting snow, at the very least, lots of rainy days interspersed through the season.  I have seen woods that face north where the snowpack will last almost to the end of March.  These woods have produced good runs all the way to the end of March and even into April.  Not this year.

Here is the graph (above) showing the high, low, and average temperatures for the first two weeks in March.  The important thing to look at here is the minimum and maximum temperatures that clearly show we not only had daytime temperatures in the first two weeks March above 50 degrees F, but also had nighttime temperatures that approached and even hit 50 degrees.  This totally wiped out the freeze/thaw cycle, and we all know you cannot make syrup without a freeze/thaw cycle.  Sustained temperatures above freezing will undoubtedly be a recurring problem into the future.  Warm temperatures also accelerates the accumulation of Growing Degree Days, pushing the trees toward budding.  However, buddy sap did not end the season in much of Ohio.  It was the acceleration of microbial growth resulting from an abundance of unseasonably warm temperatures causing the sap to warm and foul systems.  It is almost impossible to make quality syrup under these conditions.  During the Ohio Maple Tour, I tasted multiple samples of syrup made in early March.  Just about all had that sharp taste of syrup made from sour sap.

Now comes the real challenge!  How do we prevent the possibility of this very marginal syrup from entering the market?  Especially in a year when many producers in states like Ohio had a poor year and now have syrup of questionable quality to sell.  Do you bottle the syrup and hope no one notices?  After all, it may have good color somewhere between Amber and Dark Robust.  The rationale in the past has been that most customers will not pick up on the off flavor; after all, they are used to high fructose corn syrup imitations.  The question now turns becomes, how much high-quality syrup will be made in the Northeast and in Canada this year?  Will the syrup they sell to the big box stores have better quality than what our customers can buy locally?  We already know it will most likely be less expensive.

In the end what have we learn? We added one more year to the string of abnormally warm maple seasons that we have experienced over the last 5 years.  For Ohio producers tapped in January, many experienced a near normal season.  Operations made some very good syrup that did not have quality issues.  Their markets are covered.  This also means that in 2025 when New Years Day rolls around, those producers who gambled right in 2024 will again be ready to tap trees at the first signal of good sugaring weather.  Unfortunately for many Ohio producers tapping later in the calendar, this year will be a hard lesson.  Those that tapped after mid-February found out that you cannot trust Mother Nature, because she does not read the Calendar.

Change Over a Century: Monthly Maple REVIEW

Here is May’s edition of our feature Monthly Maple Review.  Once a month, we review a research article to spotlight key findings, investigate curiosities, and uncover important implications for Ohio’s maple producers.  Please comment below if you have thoughts, ideas, insights, or questions.  If you stumble on to a new maple article and want to see it highlighted in a Monthly Maple Review, please reach out to me via email – karns.36@osu.edu.

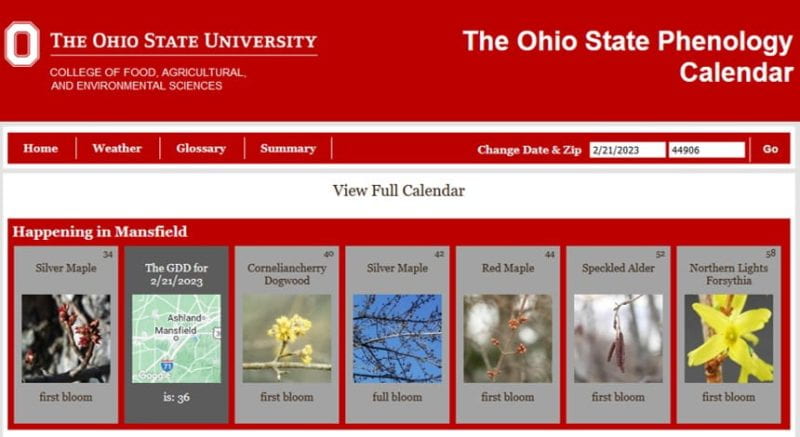
Phenology, put simply, is the study of nature’s timing.  A couple years back, we did a special article series on the use of growing degree days (GDDs) to monitor and predict the progression of trees and shrubs in Ohio.  Typically, sugarmakers are most keyed in and interested in whether maple trees are early, right on time, or late to produce the sap runs we convert into maple syrup.  But phenology gets at much more than just the time of year we make syrup.  Leaf out, dormancy, seed development, emergence of different insect pests, fall color change, and leaf drop are all elements of the annual cycle of plant phenology.  Phenology is a topic we keep coming back to you, but it’s interesting, it’s important, and it’s complicated – so we are back again!

This month’s article, published in March of this very year, is titled “A Century of Climate Warming Results in Growing Season Extension: Delayed Autumn Leaf Phenology in North Central North America.”  Authors Kellen Calinger and Peter Curtis (both Ohio State University researchers in the Department of Evolution, Ecology, and Organismal Biology) published their study in an open-access journal called PLoS ONE.  Open-access meaning, if you want to read the full paper, you can access the article here.

The methodological approach for this research paper is particularly interesting and clever.  A farmer named Thomas Mikesell from Fulton County, OH, collected data from the years of 1883-1912, meticulously recording phenological and meteorological information that was preserved in a massive 700+ page publication that is still accessible today.  Kellen and Peter, the modern day researchers from Ohio State, used Mikesell’s observations as a baseline to compare data from 2010-2014, a full century later.

Among the tree species selected in their study (they chose 7 in all), no Acer maple species were chosen unfortunately.  However, the beauty in this study’s approach is the real focus on this month’s review.  It is both elegant and simple to think that someone’s observations over 100 years ago could serve as such a significant monument in time to understand how conditions shift and change through the decades, even centuries.  Sometimes science gets complicated, complex, to the point of absurdity it seems.  This is a pleasant reminder that there is profundity in the simple as well.  Write down your observations, allow time to pass, make more observations, and compare.  Simple.  Done.

I believe there is a lesson here for us all – take notes, jot down curiosities, record all the important dates from every sugaring season.  And most importantly – save those scribbles and notes in a place where not only you, but the next generation too, can find them and propel your own personal learning journey.  Just in case you don’t recognize the common name “white maple” – that’s silver maple.

If you’re from northwest Ohio, or even just from the upper quarter latitude of Ohio, I strongly suggest you peek at this table to see how your observations jive (or don’t jive!) with Mikesell’s observations back in the late 1800s.   What conclusions do you draw?  Are there big differences for each observational category – first fully formed leaf, in full leaf, in blossom, fruit ripe, and complete change of foliage?  Or are some categories different, but some phenomenon right on schedule and unchanged?  It is important to remember that phenology is driven by a host of factors (as we noted in our March Monthly Maple REVIEW) – shifting climate is one factor, but precipitation plays a role, active and recent weather events/trends, photoperiod (fancy name for day length), and more.  Observations that have not changed much on the calendar are likely responding to more static and unchanging factors such as photoperiod.  Observations that do differ, those are more likely triggered changing climate and other more dynamic factors.

If you’re not from that part of Ohio, dig up those old records that your dad’s dad kept back when he ran the sugarshack in years bygone.  Rifle through the old drawers of dusty old spiral-bound notebooks.  Flip over the back of black-and-white photographs to see if there is an inscription that reads “first boil, 1952.”  All those memories are also records, and we learn about the present when we look to the past.  So I guess this review is less of a review and more of an admonishment – bear witness to the power of data collection and long-term record keeping.  Participate in keeping notes.  If nothing else, those notes will be curiosities to be pondered years down the road.  At best, meticulous notes and records can help you make sense of the dynamic, cluttered, and information-dense world that we live!


Mid (Late?) Season Update

Chaos and unpredictability are apparently the new normal in the maple woods.  Fool me once, shame on me.  Fool me twice, well…you know the rest.  The past 2 sap seasons and current year’s production continues to highlight a new normal of early spikes in warm temperatures and the importance of being ready and willing to tap earlier than traditionally expected.  Producers wed to a historical norm will likely pay hefty cost this year.  Honestly, given the next few days of warm temperatures, we’re not sure our sap season will even make it to March 1st.

Our red x silver maples are starting to bloom and will likely be at or near full bloom by this weekend.  Though the buds on our sugar maples are still tight, the growing degree days (GDDs) are accumulating fast and tapholes are starting to dry up.  Hopefully those slowing tapholes are a combination effect of not just the warm temperatures but also the dry winter we have experienced.  I am not seeing much hope to erase the warm temperatures, but we are supposed to get drenched with a couple inches of rain tomorrow – that should help.

Here’s a photo I took this morning of the muddiest spot in our entire woods.  It is now bone dry and the used-to-be-mud is starting to crack and split.

The next week or two will tell the season’s tale – will we achieve an average season total, come up short again (maybe that’s the new normal?), or be surprised by a late spurt to make the year memorable in a positive way?  Only time will tell.

Maple Buds and the Story They Tell (Part 2)

We have all heard it (or said it) – once the maple trees ‘bud out’ the sap collection season is done.  “Done” meaning the sap has become buddy and making syrup for the season is over.  Our eyes see it and we know to expect it, but we all hold out for just one more day of collection before the tide turns.  That day or the very next, the sweet smell of sap turns sour.

The good news is you don’t have to rely completely on your nose when boiling that last batch of sap.  Keep a close eye on how the tree buds develop as the season progresses.  When you start the season the buds are tight.  As the season progresses and the weather changes towards spring, the tree buds tell the story. We can use our eyes to track bud development as the season progresses, the weather warms, and making syrup draws to a close.  The good news is that this progression is somewhat predictable if one understands how something called growing degree days (GDDs for short) correlate.  Read Part 1 released last week to learn how you can start tracking GDDs and incorporate them into your season planning.

Using a 60-power spotting scope we took pictures of our trees on March 17th, 23rd and 27th during the 2021 sap season.  The bud progression is for sugar maple and a red x silver native hybrid maple that are present at the Ohio State Mansfield sugarbush.  For reference, we deemed our sap no longer worth collecting on March 21st.

First the red x silver “mystery” maple – in the March 17th photos, the hybrid’s buds are noticeably swollen but the flowers have not burst forth yet.  In the branch I’m holding, you can see the flower buds cracking open with the leaf bud still tightly closed in the center (black arrow).  This is crucial to understand because trees have both flower buds and growth buds which break at different times and have different impacts on the sugaring season.

By March 23rd, despite the difficult lighting, the buds have clearly flowered.

This is even more apparent on March 27th when I took the last set of photographs.  Examine the leaf bud (in the black circle) which is protruding more but still closed surrounded by the bright red maple flowers.  Our operation’s sap edged towards being “buddy” in the last 2 days preceding the red maple buds popping completely out.

For the sugar maple photos, the differences are more subtle and the progression is slower – a timeline we talked about in Part 1 last week.  In the March 17th pictures, the buds were barely noticeable at the ends of the uppermost twigs of the trees; however, buds were more prominent 6 days later.

By March 27th and nearly a week after we had closed down the sugarbush, sugar maple buds were elongated and swollen and obviously scaled but not yet officially burst open.

All in all, this was a great exercise to watch how trees go through the season’s progression as the weather changes.  A set of binoculars is a handy tool for the sugar maker; pick some key trees in your woods and watch their buds next year.  Better yet, keep detailed notes and be a studious observer of 3 primary things: sap quality, tree bud development, and those GDDs we mentioned earlier.  Once you are familiar with what the bud progression looks like relative to your tree’s sap production, you will have information to align alongside GDDs for anticipating when the end of the season is near.

The Ohio State Phenology Calendar: Understanding Nature’s Biological Clock (Part 1)

A special thanks to Denise Ellsworth from OSU’s Department of Entomology for contributing her phenology expertise that makes this article possible!

Phenology, sometimes referred to as the world’s oldest science, is the study of recurring biological events and their relationship to weather and climate. Examples of phenological events include bird migration, flowering of plants, and the seasonal appearance of insects. Because the growth and development of plants depend on temperatures, phenological events of plants, such as bud swelling or flowering time, may be useful for monitoring short-term weather patterns. Likewise, scientists can detect long-term changes due to climate change by tracking the pattern of phenological events over many years.

Insects emerge earlier in warmer years than in cooler years, and plants bloom earlier too. The critical assumption in the use of plant phenology to predict other biological events is that the phenological sequence (the order in which events occur) remains constant from year to year even when weather patterns differ greatly. It is no mystery, even to a novice sugar maker, why plant phenology matters in maple. The quality of maple syrup is at stake! Once the phenological calendar for a sequence is established, the biological calendar is easily monitored to anticipate when maple syrup quality drops. If phenology can be grasped, this can greatly simplify the logistics of planning and scheduling monitoring programs, post-season clean-up and sanitization, and other critical activities. And using phenological sequence is valuable to a whole host of applications beyond just maple—beekeepers, naturalists, and gardeners also use the predictable patterns of nature to predict plant bloom and other biological activity.

On The Ohio State University Phenology Calendar website, degree-day data and related plant bloom and pest emergence sequences are accessible for any location in Ohio.  A degree-day is a measure of the amount of heat that accumulates above a specified base temperature during a 24-hour period. A degree-day is also referred to as a growing degree-day (GDD), heat unit, or thermal unit. One GDD accumulates for each degree the average temperature remains above a specified base-temperature over those 24 hours. Several degree-days can accumulate during a 24-hour period.  However, it is important to understand that degree-days have meaning only in relation to the base temperature that has been specified. The Ohio State Phenology Calendar uses 50 degrees F as the base temperature. To provide an example, if the average temperature over a 24-hour period is only 47 degrees F with a base temperature of 50 F, no GDDs would accumulate. However, if the 24-hour average temperature was 55 degrees F, 5 GDDs would be added to the phenology calendar (more on degree day calculation here).

To inform The Ohio State Phenology Calendar, daily temperature data from 12 OARDC Research Stations and three USDA-ARS weather stations located throughout Ohio are used to calculate cumulative GDD in real-time.  Calculations for locations between weather stations are extrapolated from climatic isotherms for Ohio.  Upon entering a date and any Ohio zip code, degree-day accumulation for that location is calculated, and the user is directed to the appropriate spot on the phenology calendar to determine what plants are blooming and what pests are active in their locale.  By scrolling through the full phenological calendar, it is possible to see what blooming and pest events have already occurred, as well as what has yet to occur.  And by clicking on the Summary tab, you can get a year-by-year breakdown of GDD count for the same date and zip code location across the past 6 years.

It is important to define a couple terms as we launch into species-specific phenology.  First bloom is defined as the first flower opening to expose sexual parts. Full bloom is when just one out of twenty buds is still closed while all others are open to expose sexual parts.

Of particular interest to maple producers, silver maple is listed first with 34 GDD at first bloom. A bit further down the sequence, silver maple reappears with full bloom at 42 GDD.  Red maple first bloom follows at 44 GDD just after silver maple full bloom. Red maple full bloom averages 75 GDD.  Sugar maple is not currently listed on the GDD calendar; however, it is believed that sugar maple tracks very closely with black maple – another of the “hard” maples.  While there is some uncertainty about the exact GDD timing for sugar maples, they are definitely “late bloomers” as compared to their “soft” maple counterparts.

The consistency in phenological sequence from year to year demonstrates that even one year of observation is useful to expand the phenological sequence to other plants or insects not included on the OSU calendar. This means that users can readily create, expand, and customize their own biological calendars by observing plants in first or full bloom and taking note of the GDD for that date on the OSU calendar. Many observers use a journal or excel file to track plant and insect activity from year to year, adding in new plants or insects of interest. These calculations can even be made by referring to photographs that show first bloom or full bloom; the photo’s date and location can be entered on the OSU calendar to determine the GDD for that event. Insect observations should be of developmental stages, such as egg hatch or adult emergence.

For the maple producer, understanding the predictability of nature’s patterns is crucial for better anticipating the end of each maple season. For years and years, sugar maple bud break was the traditional visual signal to take down buckets and end the sap season. Unfortunately, lots of poor-quality sap was made waiting for those first buds to break. Now we know that physiological changes occur within the tree prior to actual bud break that bring seasons to a close earlier. And sanitation issues that result in “sour” sap (due to bacterial build-up) halt most sap seasons before “buddy” sap is rampant. While we are excited to continue tracking sugar maple performance relative to GDDs, keeping an eye on the 100 GDDs mark is a rough indicator for when things are winding down. Some woods will shut down earlier and others will stretch a bit later, but when the Forsythia approaches full bloom in your yard – which occurs right around 100 GDDs depending on variety – you can be sure the end of your sugaring season is nigh.

New Article Series Launches Next Monday

This short post will serve as a sort of guidepost, a table of contents or roadmap if you will, for the next month or so worth of content.  We are excited to bring you a 4-article series on maple phenology.  Phenology is a fancy word for describing nature’s calendar.  We’ll discuss one of the most practical and accessible tools for tracking phenology – the growing degree day, or GDD for short.  Second, we’ll seek to understand and document how GDD is related to species-specific patterns in maple bud and bloom timing and why that matters for maple producers.  Then over the course of two installations, Les Ober will break down why an improvement of one’s understanding of maple season timing is particularly important towards the season’s end and how you can minimize and prevent unwanted bouts with “sour” or “buddy” sap.  After all, our main goal is promoting sustainable production of high quality maple syrup!

What to Expect for the Rest of the 2021 Ohio Maple Season

Just like snowflakes no two maple seasons are exactly alike.  No question about it, this season fooled me. After about 5 years of early tapping, along comes 2021.  During December and January, we experienced above normal temperatures leading to what many believed would be one more in a string of early tapping seasons.  Tapping in January has become almost routine across Ohio.  However, just like a deck of playing cards, every deck has 2 jokers.  This winter season we had two meteorological jokers.

The first was the presence of a strong La Nina with its trademark warmer and wetter weather conditions.  Hidden in the background far to the North was the second joker – the always volatile and never popular polar vortex.  A polar vortex is always a possibility during the winter months.  You never know when the jet streams will line up just right and push Artic air southward into our region.  This year we did not experience the full brunt of the vortex like we did in 2014.  The coldest air stayed well to the west of Ohio.  However, we did experience a cold spell that dominated 20+ days of February.

As result of the persistent polar vortex, the start of the 2021 maple season was pushed back until the last week of February and first couple days of March.  Even southern Ohio producers were forced to tap two to three weeks later than normal.  The first of March is not historically an abnormally late starting time for maple season in Ohio.  The one dominant factor that makes this season different is that our weather is still being somewhat controlled by a strong La Nina weather pattern.  The threat of an early warm-up and above normal temperatures are real.  And the first indication of that was the stretch of 60-70 degree temperatures experienced during the middle of the second week of March.  This was enough to trigger budding in red maples and silver maples of southern Ohio.

At the same time, many sugar camps in northeast Ohio set one day records for syrup production.  Sap flows were exceptional after the long cold spell of February.  As of March 12th, the same camps are reporting a half crop entering the third week of March.  The above normal temperatures experienced at the end of the second week, pushed the season close to the brink.  Conditions also caused a dramatic change in syrup grade, and Dark Robust and even Dark Strong profiles have mostly displaced the Golden grade of early season.

The next two weeks will determine the outcome of the maple season in Ohio.  OSU Climatologist Aaron Wilson is predicting a mixed bag of weather conditions for the rest of the month.  There will be some below freezing temperatures but nothing extreme.  For southern Ohio, the trend is for slightly above normal and for northern Ohio – normal temperatures.  Again, we may or may not see those colder low temperatures needed to reset the trees and delay budding.  What is also troubling is the lack of moisture.  2021’s recent precipitation trend is not typical for a La Nina year, and drier than normal conditions are slowly creeping into Ohio.  We need precipitation, snow preferred, to keep the sap flowing, but that key factor is largely missing in the forecast for northern Ohio.  At this stage, we need a hybrid of the two jokers to keep this season productive.

I will keep my prediction for the rest of March to myself, goodness knows the first two months of 2021 fooled me.  That said, I will be able to confidently predict the outcome the 2021 maple season in Ohio on the 15th of April.  What is it they say about hindsight?

 Les Ober, Geauga County OSU Extension

Upcoming Webinar (11/19): Climate Change Impacts and Risks to Southern Maple Production

The maple syrup industry is impacted by both seasonal weather and long-term changes in climate. While the short-term conditions impact annual production cycles and quality, long-term changes in climate are having an impact as well. Temperatures across the maple syrup production areas of the US are warming, and climate change extends well beyond just temperature to include shifts in seasonal precipitation patterns and increasingly extreme events. Projections of future climate pose significant risks to the future of maple production across southern zones. Join the webinar (Register HERE) to explore the influence of weather and climate change on the maple industry and discuss the implications for the future.

Speaker: Aaron B. Wilson – Aaron is an Atmospheric Research Scientist at The Ohio State University, holding a joint appointment with the Byrd Polar & Climate Research Center and OSU Extension. He is also with the State Climate Office of Ohio.

The webinar is part of the Out of the Woods series hosted by Ohio State University, Future Generations University, and Penn State University.