Because the 2018 Farm Bill was extended, farmers will have the same commodity title choices in 2024 as they have since 2019. These include the Price Loss Coverage (PLC), Agricultural Risk Coverage at the county level (ARC-CO), and ARC at the individual level (ARC-IC) programs. For the first time, the effective reference prices in 2024 for corn ($4.01) and soybeans ($9.26) will be above statutory references prices ($3.70 for corn, $8.40 soybeans). Wheat’s effective reference price will remain at the statutory level of $5.50. Those effective reference prices are well below 2024 ARC benchmark prices: $4.85 for corn, $11.12 for soybeans, $6.21 for wheat. As illustrated in the recently updated for 2024 Farm Bill What-If Tool — a Microsoft Excel spreadsheet — ARC-CO will trigger larger payments when county revenues are driven by low yields, while PLC payments may be larger with moderately low prices and higher yields, as well as in scenarios with extremely low prices.
Payments from either PLC and ARC-CO remain relatively unlikely for corn, soybeans, and wheat, even with lower prices expected for 2024. There is a higher likelihood of ARC-CO triggering payments on corn and soybean base acres given the higher benchmark prices compared with PLC’s effective reference prices. However, PLC may be attractive if an individual is concerned about corn and soybean prices falling below $3.75 and $9.00 per bushel, respectively. In addition, producers interested in using the Supplemental Coverage Option (SCO) insurance program will want to enroll in PLC.
2024 ARC/PLC Decisions
The recent 1-year extension of the 2018 Farm Bill means that farmers will once again face the March 15th deadline to make a decision between the PLC and county and individual versions of ARC programs offered through the Commodity Title.
- Price Loss Coverage (PLC) is a crop-specific fixed price support program that triggers payments if the marketing year average (MYA) price falls below the commodity’s effective reference price. Payments are made on 85% of historical base acres (see farmdoc daily, September 24, 2019)
- Agricultural Risk Coverage at the county level (ARC-CO) is a crop-specific county revenue program. ARC-CO triggers payments if actual revenue (MYA price times county yield) falls below 86% of the benchmark revenue (product of benchmark price and trend-adjusted historical yield for the county). Payments are made on 85% of historical base acres (see farmdoc daily, September 17, 2019)
- Agricultural Risk Coverage at the individual level (ARC-IC) is a farm-level revenue support program. Like ARC-CO, payments are triggered if actual revenue falls below 86% of the benchmark. If an FSA farm unit is enrolled in ARC-IC, information for all commodities planted in the current year is combined together in a weighted average to determine benchmark and actual revenues. If a farmer enrolls multiple FSA farms in the same state, all farm units are combined in determining the averages for actual and benchmark revenues. Payments are made on 65% of historical base acres (see farmdoc daily, October 29, 2019).
Decisions are made for each Farm Service Agency (FSA) farm unit. PLC and ARC-CO are commodity-specific and can be mixed and matched on the same FSA farm or across different FSA farms (i.e., PLC for one commodity, ARC-CO for another on the same FSA farm or using different programs for the same crop on different FSA farms). High commodity prices in recent years have implied low likelihoods of payments (see farmdoc daily, January 24, 2023). The likelihood of payments being triggered remain low for 2024. However, lower projected prices for corn, soybeans, and wheat in 2024 combined with higher prices now impacting effective reference and benchmark price calculations increase the likelihood of payments and introduce additional uncertainty into the program decision for 2024.
Effective Reference Prices for 2024
The effective reference price levels for 2024 are set at the higher of: 1) a crop’s statutory reference price, or 2) 85% of the Olympic average of prices over the 5 marketing years from 2018 to 2022. The Olympic average is computed as the simple average of the 3 remaining prices after eliminating the low and high price over the 5 years considered. If applicable, the effective reference price is capped at 115% of a crop’s statutory reference price. Effective reference price calculations for corn, soybeans, and wheat in 2024 are summarized in Table 1.
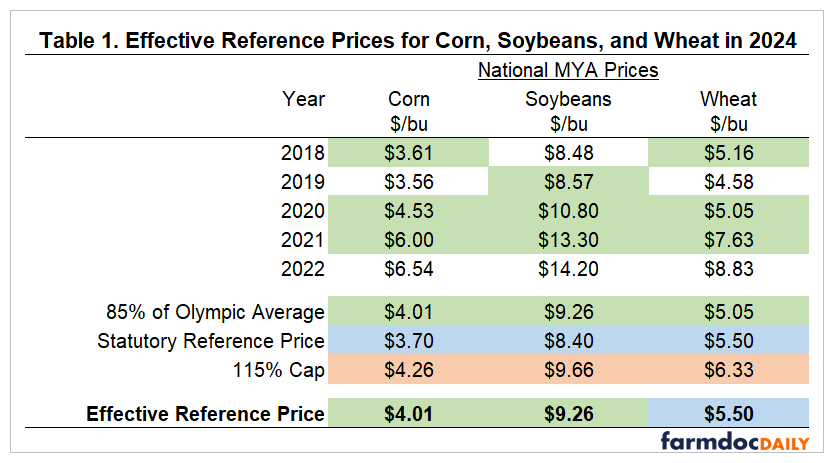
The 2024 effective reference prices for both corn and soybeans are above the minimum statutory levels due to multiple years of prices sufficiently larger than the statutory reference prices for both crops from 2018 through 2022.
For corn, 85% of the average of the MYA prices for 2018, 2020, and 2021 are used in computing the $4.01 effective reference price. For soybeans, 85% of the average for the MYA prices for 2019, 2020, and 2021 are used to set the $9.26 effective reference price.
National MYA prices for wheat have also been higher in recent marketing years, but not enough to result in an increase in the effective reference price for 2024. For wheat, 85% of the average of MYA prices in 2018, 2020, and 2021 is $5.05 resulting in the effective reference price being set at the statutory level of $5.50 for wheat in 2024.
ARC Benchmark Price Calculations
ARC program benchmark prices for each commodity are based on the Olympic average of the 5 prices used in the benchmark calculation. Prices used are the larger of the crop’s effective reference price for the current year (2024 in this case) and the actual MYA prices over the 5 preceding marketing years with a single year lag (i.e. 2018 to 2022 for the 2024 program year). Higher prices in recent marketing years, along with the use of the effective reference prices as minimums for each year used in the calculation for corn, soybeans, and wheat results in an increase in the ARC benchmark prices for 2024 compared with 2023 and earlier years. Table 2 summarizes the ARC benchmark price calculation for corn, soybeans, and wheat.
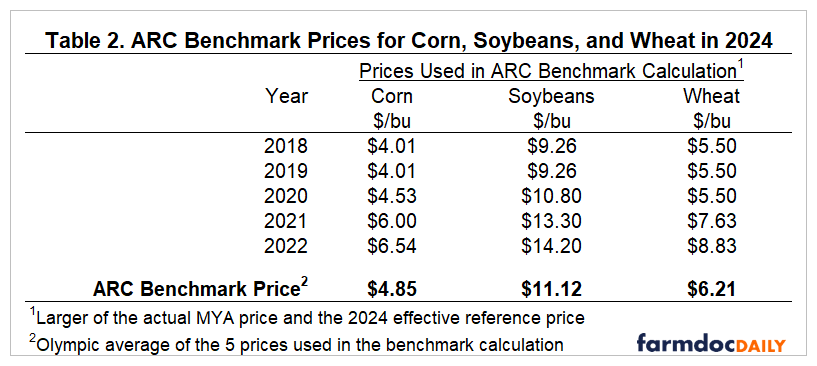
For corn, the actual marketing year average prices in 2018 and 2019 are replaced by the 2024 effective reference price of $4.01, while the actual MYA prices for 2020, 2021, and 2022 are used. Taking the Olympic average of the 5 prices used for corn results in an ARC benchmark price of $4.85 per bushel. The ARC benchmark calculation for soybeans also replaces the actual MYA prices in 2018 and 2019 with the $9.26 effective reference price to arrive at an ARC benchmark price of $11.12 per bushel for soybeans in 2024. Wheat’s benchmark calculation involves replacing the actual MYA prices with the $5.50 reference price in 3 of the 5 years (2018, 2019, and 2020) and results in an ARC benchmark price of $6.21 per bushel for wheat in 2024.
Notably, the ARC benchmark prices are all above the effective reference prices for each of the three crops. ARC-CO guarantees 86% of a county’s benchmark revenue, which implies that payments would be triggered when prices fall below 86% of the benchmark price assuming normal yields at the trend benchmark level for the county. These trigger price levels are $4.17 for corn (0.86 x $4.85), $9.56 for soybeans (0.86 x $11.12), and $5.34 for wheat (0.86 x $6.21). These trigger prices for corn and soybeans also exceed their respective effective reference prices, suggesting ARC-CO is more likely to trigger payments than PLC. For wheat the trigger price is below the $5.50 reference price, meaning a larger price decline will be needed to trigger ARC-CO payments than for PLC payments on wheat assuming yields at benchmark levels in 2024.
ARC-CO Benchmark Yield Calculations
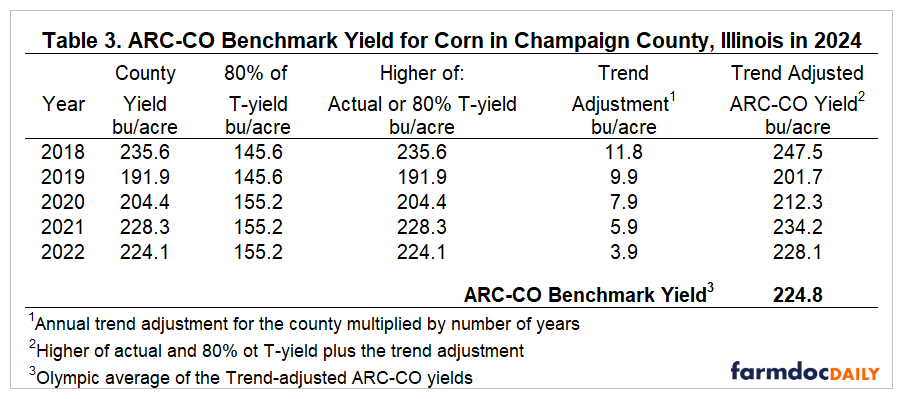
The ARC-CO program uses a county specific benchmark yield based on the higher of actual county yields and 80% of the county T-yields used for crop insurance over the 5 preceding crop years with a year lag (2018 to 2022 is used for the 2024 program year). A county-specific trend adjustment is then added to each year’s ARC-CO yield, resulting in a 5-year history of trend-adjusted ARC-CO yields.
The 2024 benchmark yield calculation for corn in Champaign County, Illinois is provided in Table 3. Actual yields for Champaign County are used for all 5 years. The trend adjustment factor for Champaign County is 1.97 bushels per acre per year. Each of the historic yields is adjusted up to a 2024 trend-adjusted yield. For example, the 2018 actual yield of 235.6 bu/acre is adjusted up by 11.8 bu/acre (6 years x 1.97 bu/acre/year) to a 2024 trend-adjusted yield of 247.5 bu/acre. The Olympic average of the trend-adjusted yields gives the 2024 ARC-CO benchmark yield of 224.8 bu/acre for Champaign County, Illinois.
PLC and ARC-CO Payments in 2024
We briefly summarize payment calculations for the PLC and ARC-CO programs here. More detailed explanations are provided in the farmdoc daily articles from September 17, 2019 and September 24, 2019.
PLC payments will be triggered if the 2024 MYA price is below the effective reference price. Payments for corn would be triggered at prices below $4.01 per bushel. Payments for soybeans would occur at prices below $9.26 per bushel. Payments for wheat would occur at prices below $5.50 per bushel. PLC payments cover the price gap between the higher of the crop’s actual MYA price and its loan rate and the commodity’s effective reference price multiplied by the PLC payment yield for the farm and paid on 85% of the farm’s base acres.
For example, if the 2024 MYA price for corn is $3.81 the PLC program would trigger payments at a rate of $0.20 per bushel ($4.01 – $3.81 = $0.20). A farm with a PLC payment yield of 180 bushels per acre would receive a payment of $30.60 per base acre (0.85 x $0.20 x 180 = $30.60).
ARC-CO payments are triggered if actual county revenue falls below the ARC-CO guarantee. Payments equal the revenue shortfall, capped at 10% of benchmark revenue, paid on 85% of the farm’s base acres. Actual revenue is the county’s actual yield times the national MYA price. The ARC-CO guarantee is 86% of the product of the ARC-CO price and yield benchmarks. Using corn in Champaign County, Illinois as an example, actual revenue for 2024 would need to fall below $937.81 per acre (0.86 x 224.8 x $4.85).
A 2024 MYA price of $3.81 and a Champaign County corn yield of 225 bu/acre would trigger an ARC-CO payment of $69 per base acre ($937.81-$856.64 = $81.17 x 0.85 = $68.99). A $4.50 MYA price and a Champaign County yield of 205 bu/acre in 2024 would trigger a $13 ARC-CO payment ($937.81 – $922.50 = $15.31 x 0.85 = $13.01).
2024 ARC/PLC What-If Tool
An updated 2024 version of the Excel-based Farm Bill What-If Tool is now available, and can be directly downloaded here. The calculator can be used to compare payment scenarios for the PLC and ARC-CO programs for individual farm scenarios. The tool provides a tabular comparison of PLC and ARC-CO payments across a range of MYA price and county yield levels. An example for corn in Champaign County, Illinois is provided below in Figure 1.
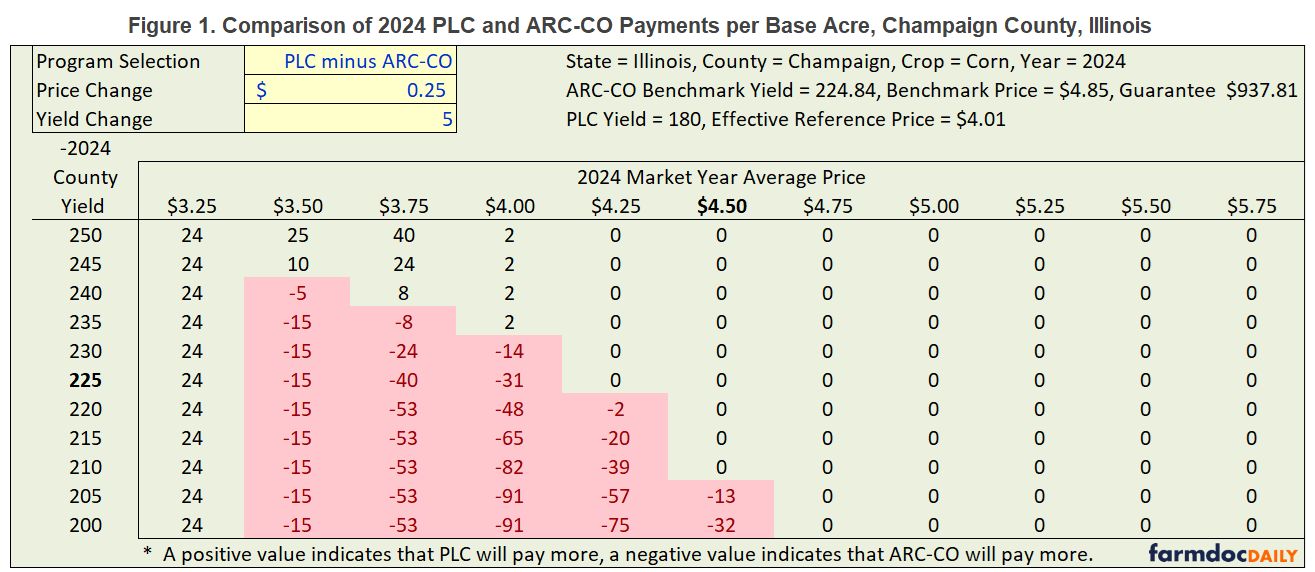
The prices across the columns are centered at $4.50 per bushel, the current price projected for the 2024 marketing year used in the January revision to the farmdoc Crop Budgets and consistent with USDA’s current forecast. Yields in the rows are centered at 225 bu/acre, the 2024 ARC-CO benchmark yield for Champaign County.
PLC payments would begin to be triggered at a MYA price for corn of $4.01. ARC-CO payments would be triggered at any combination of an MYA price and county yield for corn that resulted in revenue below Champaign County’s ARC-CO guarantee of $937.81.
The zero values in the table in Figure 1 are for MYA prices which exceed $4.01, and price and yield combinations which exceed a revenue of $937.81 resulting in no payments from PLC or ARC-CO. Positive values in green in the table in Figure 1 indicate that the size of PLC payments at that price level would exceed the ARC-CO payment, if applicable, for that price and yield combination.
For example, with a MYA price level of $3.75 and Champaign County corn yield of 250 bu/acre, the PLC payment would be $40 per base acre and no ARC-CO payment would be triggered, resulting in a $40 per base acre payment advantage for PLC. At a MYA price of $4.00 and county yield of 215 bu/acre, PLC would trigger a payment of less than $2 per base acre while ARC-CO would trigger a $66 payment resulting in an ARC-CO advantage of nearly $65 per base acre.
PLC will tend to result in larger payments when prices are sufficiently low to trigger PLC payments and county yields are sufficiently high to trigger low or zero ARC-CO payments. PLC also results in larger payments when prices are extremely low, regardless of yield outcomes, as ARC-CO payments begin to be capped at 10% of benchmark revenue. Examples of these scenarios can be seen in the first column of the table in Figure 1 where the MYA price is $3.25. Even at the 250 bu/acre county yield level shown in the first row, ARC-CO payments would hit the cap of $93 per base acre for Champaign County (0.85 x 0.10 x 224.8 x $4.85 = $93). At a $3.25 MYA price and 180 bu/acre PLC payment yield the PLC payment would be $116 per base acre, resulting in the $24 per base acre payment advantage for PLC shown in the first column for all reported yields.
ARC-CO payments exceed those for PLC when county yields are sufficiently low and when prices are moderately low relative to the benchmark and effective reference prices. These scenarios can be seen by the negative values shaded in red in the table in Figure 1. For example, at an MYA price of $4.25 PLC payments would not be triggered, but ARC-CO would begin to trigger payments at a county yield level of around 220 bushels per acre. At prices of $4.00 or lower, there are price and yield combinations where both programs would trigger payments but ARC-CO payments would be larger than those from PLC. For example, at an MYA price of $3.75 and a county yield level of 225 bu/acre the PLC payment would be $40 per base acre while the ARC-CO payment would be $80 per acre, a $40 per base acre payment advantage for ARC-CO.
Conclusions
Higher prices in recent years have resulted in higher PLC effective reference prices for corn and soybeans in 2024 as well as higher ARC program benchmark prices. While wheat’s reference price will remain at the statutory level of $5.50 for 2024, higher MYA prices are now also factoring into the ARC benchmark price calculation for wheat. With lower prices projected for 2024, the likelihood of triggering ARC and PLC payments is higher than in the past few years but remains relatively low.
The updated Farm Bill What-If Tool can be used to compare payment scenarios for the PLC and ARC-CO programs for 2024, aiding in the commodity program decisions producers must make by March 15th.
ARC-CO will trigger larger payments when sufficiently large yield losses occur and/or prices are not sufficiently below the effective reference price. Given the ARC benchmark prices for 2024, ARC-CO payments have a higher likelihood of being triggered than PLC for corn and soybean base acres.
PLC will trigger larger payments when prices fall below a commodity’s effective reference price. PLC payments would exceed ARC-CO payments in scenarios where yields are not sufficiently low to trigger large ARC-CO payments. PLC also has an advantage in very low price scenarios where ARC-CO payments hit the 10% of benchmark revenue cap.
Beyond direct payment comparisons, other considerations may enter a producer’s commodity title decision. One example is the interaction between commodity program choice and eligibility to use the Supplemental Coverage Option (SCO) insurance program. Producers wanting to use SCO will need to make sure those acres are enrolled in PLC. ARC-IC should also be considered as an option. The farmdoc daily article from October 29, 2019 lays out situations where producers may consider ARC-IC.
Future articles leading up to the March 15th commodity program and crop insurance deadlines will further analyze factors that may influence producers’ decisions for 2024.


