Ohio Cropland Values and Cash Rents 2008-09 – Additional Survey Results

The “Ohio Cropland Values and Cash Rents” survey is conducted annually drawing on the expertise of numerous professionals that are knowledgeable of Ohio’s cropland markets. Surveyed groups include farm managers, rural appraisers, agricultural lenders, OSU Extension Educators, farmers, and Farm Service Agency personnel. These data were collected in December 2008. Financial conditions at that time should be considered when evaluating this summary data.


One hundred eighteen surveys were completed, analyzed and summarized. Respondents were asked to give responses on land value, land rent and other measures. Some of these other measures include: Value of Cropland in Transition (areas where much of the land is moving into residential, commercial & industrial uses), Expected Percent Change in the Value of Bare Cropland in the Next 5 Years, Expected Percent Change in the Cash Rental Rates in the Next 5 Years, Expected Average Interest Rate for Mortgage Loans for 2009, Expected Average Operating Loan Rate for 2009, Pasture Cash Rent per Acre and the Value of Pasture Land.


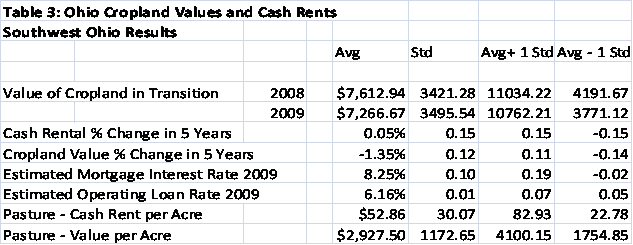
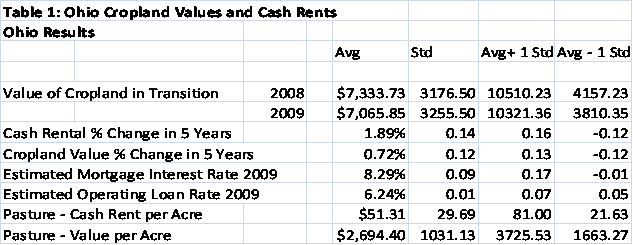
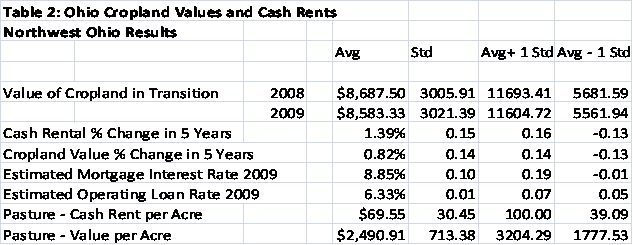
Table 1 through 3 below show the results of the survey for these measures for Ohio and 2 sub-regions (northwest and southwest) of Ohio. Only the northwest and southwest Ohio regions had sufficient survey responses to enable us to summarize and publish regional data.

Tables show the average (Avg) (simple average) of each row, standard deviation (Std) of the data for that measure (measure of variability), average plus one standard deviation (Avg+Std), and average minus one standard deviation (Avg-Std). These latter two numbers reported indicate a range within which about two-thirds of the responses in the data for that measure will fall.


Land value and cash rental results for the 2008-2009 survey were summarized in the February Edition of the Ohio Ag Manager:

http://ohioagmanager.osu.edu/2009/02/

That article reviewed the results of the survey for 3 classes of land in the survey respondent’s area; “top” producing land, “average” producing land and “poor” producing land.

Ohio Line Fence Law – Ohio Partition Fence Law

Line fence law is the body of law that establishes rules and responsibilities for fences placed on the division line between properties in rural areas. Also referred to as the “partition fence” law, Ohio ‘s line fence law underwent a dramatic revision in 2008. On the OSU AgLaw page, you’ll find explanations of the new law and a link to the new statutory provisions in Chapter 971 of the Ohio Revised Code. Also located here are a summary of court cases and a fact sheet and on Ohio ‘s former line fence law, which is no longer in effect, as well as links to resources on line fence laws in other states.

http://www.aede.osu.edu/programs/aglaw/line_and_partition_fence_law_lib.htm

Flexible Cash Lease Calculator Decision Aid at OSU Farm Management

Now, more than ever, big swings in crop prices and input costs points toward negotiating some flexibility in cash leases for farmland. “Volatile” and “Uncertain” are two words that might best describe grain prices and input costs for row crop production heading into the 2009 planting season. With this increased volatility and uncertainty, risk increases for producers and more uncertainty arises about the amount of cash rent to pay. On the other side of the negotiating table, landowners, seeing higher profitability in recent years for commodity crops, are possibly seeking higher cash rents. So, just what is that “most equitable” cash rent amount and how can it be maintained from year to year or contract to contract?

One answer is negotiating a flexible cash lease arrangement that varies from year to year based on price, yield and input costs. Price, yield and input cost changes from an agreed upon starting point will trigger changes in the base lease amount. Historically, flexible cash leases have been based on price or yield or a combination of the two. With the extreme volatility in input costs the past 2 years, some producers are only willing to negotiate a flexible cash lease if there is some measure of costs built in to the flex lease.

This Flexible Cash Lease Calculator can assist users in developing a flexible cash rent model. Unlike other flexible cash lease calculators, this tool allows the user to incorporate flexible parameters for input costs as well as for price and yield. The flexible cash rent approach used in this calculator is to multiply the base rent by: 1) the ratio of the Year End Price to Base Price, 2) the ratio of the Year End Yield to Base Yield and, 3) the ratio of the Base Input Costs to Year End Input Costs.

This Flexible Cash Lease Calculator is available at:
http://aede.osu.edu/Programs/FarmManagement/Budgets/download.htm

The Microsoft Excel spreadsheet is designed to enable the user to input base and year end prices, yields and costs to formulate a flex rent at the end of the lease year. There are two tabs for this calculator. Page 1 contains the Flexible Cash Lease Inputs and page 2 contains the Flexible Cash Lease Output.

Flexible Cash Lease Input Page – Page 1
Expected Acres – Expected number of acres to be planted with each crop – corn, soybeans, or wheat.

Base Cash Rent – Rent negotiated between farmer and landowner that will be paid if base prices, yields and input costs remain the same until year end.

Base Yield – Yield negotiated between farmer and landowner corresponding to the base rent. If the Base Yield (or projected yield) ends up being the actual yield, or Year End Yield, yield will not influence the flexible rent calculated.

Year End Yield – The actual yield from the farm or farms. (This could also be a third party end of crop year yield agreed to when the lease is negotiated i.e. county average yield from Ohio Ag Statistics Service.)

Base Price – Price negotiated between farmer and landowner corresponding to the base rent. If the Base Price ends up being the actual price, or Year End price, price will not influence the flexible rent calculated. Base Price may be a 3-5 year average or the best average estimate for the term of the lease.

Year End Price – The actual price crops are sold for or a harvest time price. (This could also be a third party end of crop year price (or an average of a series of prices) agreed to when the lease is negotiated i.e. average price at local elevator on April 1, July 1 and November 1.)

Minimum Rent – Minimum rent agreed to during the lease negotiation. (Optional)

Maximum Rent – Maximum rent agreed to during the lease negotiation. (Optional)

Base N, P2O5, K2O – Input prices negotiated between farmer and landowner at levels corresponding with the Base Rent. These prices could be entered on a per acre basis or a per ton basis. Base Price may be a 3-5 year average or the best average estimate for the term of the lease.

Year End N, P2O5, K2O – The actual cost of these inputs during the production year. (This could also be a third party cost (or an average of a series of costs) agreed to when the lease is negotiated i.e. average cost of inputs at local crop service provider on April 1, July 1 and November 1.)

Base Chemicals – Input prices negotiated between farmer and landowner at levels corresponding with the Base Rent. These prices could be entered on a per acre basis or a per product unit basis. Base Price may be a 3-5 year average or the best average estimate for the term of the lease.

Year End Chemicals – The actual cost of these inputs during the production year. (This could also be a third party cost (or an average of a series of costs) agreed to when the lease is negotiated i.e. average cost of inputs at local crop service provider on April 1, July 1 and November 1.)

Base Diesel – Input price negotiated between farmer and landowner at levels corresponding with the Base Rent. This price could be entered on a per acre basis or a per gallon basis. Base Price may be a 3-5 year average or the best average estimate for the term of the lease.

Year End Diesel – The actual cost of these inputs during the production year. (This could also be a third party cost (or an average of a series of costs) agreed to when the lease is negotiated i.e. average cost of diesel at fuel provider on April 1, July 1 and November 1.)

Base Seed Cost – Input price negotiated between farmer and landowner at levels corresponding with the Base Rent. This price could be entered on a per acre basis, a per bag basis or a per 1000 seed basis. If you choose to use the per acre basis, a per bag basis, enter the figures directly in the Total Base column. If you choose to use the per 100 seed basis enter all information in the section. Base Price may be a 3-5 year average or the best average estimate for the term of the lease.

Year End Seed Cost – The actual cost of these inputs during the production year. (This could also be a third party cost agreed to when the lease is negotiated i.e. average cost of Asgrow seed per unit.)

Flexible Cash Lease Output Page – Page 2
The Calculator allows the user to compare four different methods of calculating a flexible cash lease. The base rent is “flexed” based on factors of “Year End” to “Base” for yield and price and “Base” to “Year End” for inputs. If the “Year End” price or yield is higher than the “Base” price or yield the rent will flex higher. If the “Year End” input costs are higher than the “Base” input costs the rent will flex lower.

These factors are calculated as follows:
Adjusted Price Factor: Year End Price (of crop) divided by Base Price. A “Year End Price” higher than the “Base Price” will yield a factor greater than 1. This Factor multiplied by the “Base Rent” will yield a Flex Rent greater than the Base Rent. A “Year End Price” lower than the “Base Price” will yield a factor less than 1. This Factor multiplied by the “Base Rent” will yield a Flex Rent less than the Base Rent.

Adjusted Yield Factor: Year End Yield (Actual Yield) divided by Base Yield. A “Year End Yield” higher than the “Base Yield” will yield a factor greater than 1. This Factor multiplied by the “Base Rent” will yield a Flex Rent greater than the Base Rent. A “Year End Yield” lower than the “Base Yield” will yield a factor less than 1. This Factor multiplied by the “Base Rent” will yield a Flex Rent less than the Base Rent.

Adjusted Input Factor: Year End Input Costs (Actual Input Costs) divided by Base Input Costs. “Year End Input Costs” higher than the “Base Input Costs” will yield a factor greater than 1. This Factor multiplied by the “Base Rent” will yield a Flex Rent greater than the Base Rent. “Year End Input Costs” lower than the “Base Input Costs” will yield a factor less than 1. This Factor multiplied by the “Base Rent” will yield a Flex Rent less than the Base Rent.

Method I is Flexing for Price Only. This will take your base rent; multiply it by your adjusted price (current price divided by base price). This will equal the rent per acre, which will then be multiplied by acres grown. That will calculate the adjusted rent for the year. The total rent per acre is the sum of the adjusted rent for the year divided by total acres. This is the suggested rental rate for the year.

Method II is Flexing for Price and Yield. This method will use the same methods as above, but include the adjusted yield which is the current yield divided by current price.

Method III is Flexing for Price and Input Costs. This section will combine Method I with the total input costs calculated on the user input page. This will take the adjusted input costs (current input costs divided by base input costs) and multiply it to the adjusted price from Method I.

Method IV incorporates flexing for Price, Yield and Input costs. This will multiply the adjusted price, adjusted yield and adjusted input cost.

In all four methods, the Total Rent per Acre line is the suggested flex rent per acre. Choosing which method to decide rental rates from will come from conversation between land owner and tenant.
Fertilizer Prices – An Upside Down Market

In the last 12 months, fertilizer markets have caused a great deal of financial pain at various points in the supply chain. Fertilizer purchases and prices locked in by retailers (and many producers) at high prices from mid spring through mid fall looked to be good decisions as prices for fertilizer were projected to increase into 2009. Instead the global financial crisis changed much of the outlook for commodities including crops, energy and fertilizer. Lower commodity crop prices and poorer prospects for profitability in 2009 kept many producers out of the fertilizer buying market. Producers, aware of falling fertilizer demand (domestic and global) and import/wholesale prices, were hesitant to buy high priced fertilizer when lower prices might potentially show up at the retail level.

Throughout this past fall and winter retailers have struggled to find buyers and producers have struggled with the decision of when to purchase needed fertilizer. Retail ag dealerships have struggled with when and by how much prices could or should be lowered to encourage farmer purchases yet limit their own losses. Prices have declined for some fertilizer materials while others have remained at relatively high levels. Eventually producers will have to return to purchasing fertilizer and not (in some cases) rely on existing P and K levels in the soil. Will that be yet this spring or later this fall in preparation for the 2010 crop? Better prospects for profitability for 2009 and 2010 in the form of higher commodity prices (if they occur) may move some producers back into the market for purchasing not only needed N for corn production, but P and K that they may have skimped on thus far for 2009 crops.

So what fundamentals will drive fertilizer markets in the next year?

Fertilizer Fundamentals – The Case for Steady/Higher Prices
1.If we experience steady to higher commodity crop prices and reasonable scenarios for profitability, fertilizer purchasing will resume which may put some upward pressure on fertilizer prices again.
2.Balance sheets for farmers in the U.S. are generally strong, especially amongst crop farmers. Strong financial positions will “help grease the purchasing wheels”.
3.Large under-fertilized acreages worldwide signal stronger long term fertilizer demand.
4.Fertilizer manufacturing/mining curtailments over the last several months as a result of slow demand may over-compensate and see supplies unable to keep up with demand when producers return to the market.

Fertilizer Fundamentals – The Case for Steady/Lower Prices

1.Large high priced inventories combined with smaller farmer purchases at the retail level continue to put downward pressure on prices.
2.The potential for lower commodity prices (due to falling demand from the global downturn) and questionable profitability in 2009 may keep many producers from fertilizing at high or even sufficient levels.
3.Deteriorating credit opportunities in many countries around the world may hurt demand further.
4.Lasting demand destruction may occur in some countries/regions due to lack of liquidity or financing and/or utilization of alternative nutrient sources.
5.A stronger U.S. dollar allows for more purchasing power in the U.S. and lower prices for imported fertilizer.
6.Lower transportation costs due to lower energy prices and less demand for transportation worldwide will decrease prices for imported fertilizer.

Fertilizer prices (with the exception of potash) have declined sharply in the last 6 months. According to our retail survey that we conduct by surveying several crop supply outlets in Ohio, the price of NH3 on 3/22/09 averaged $765 per ton. This is a decrease of 37% from 6 months ago ($1212 per ton), but down only 6% from a year ago ($783 per ton).  UAN, now priced at $331 per ton, is down 33% from 6 months ago, from a high of $492 per ton. Urea decreased 43% in the last 6 months, falling from $870 to $498 per ton. According to our survey, MAP price declined from $1223 to $683 per ton in the last six months, while DAP price fell from $1218 to $700 per ton. These are decreases of 44% and 43% respectively.

As of 3/22/2009, the price of potash has not followed this trend. According to our survey, the average price of Potash is $880 per ton. This is up 1.8% from 6 months ago when it was averaging $864 per ton.

As of 3/22/2009:

NH3 – $765/ton or $0.47/lb
UAN – $331/ton or $0.59/lb
UAN-Direct to farm – $298/ton or $0.53/lb
Urea – $498/ton or $0.54/lb
MAP – $683/ton or $0.66/lb
DAP – $700/ton or $.67/lb
Potash – $880/ton or $0.73/lb
10-34-0 – $1038/ton

On-Highway Diesel (Midwest) – $2.04 per gallon

There have been and will continue to be painful adjustments as farmers, retail dealers and wholesalers sort out how to navigate the present uncertainties in the fertilizer markets. Eventually higher priced inventories will be sold through retailers and the cycle will begin again. Will all retail crop service companies survive this upside down fertilizer market? If there is some industry consolidation, will producers suffer due to lack of local retail fertilizer dealers? And what will that mean to competition and price of retail fertilizer in the long run? Will producers find profitability in 2009 even with these relatively lower fertilizer prices? Many questions….but not enough evidence yet to draw conclusions. Most experts agree that in these volatile times, spreading out fertilizer purchases to take advantage of some cost averaging may be prudent.

Free Business Plan Tool Available

A business plan is a written guide to starting and running your business. This plan will encourage loans, promote growth, and provide a map for you to follow. I just found a great new tool that can help you make a business plan for your business. It is called AgPlan, from the Center for Farm Financial Management at the University of Minnesota. These are the people who developed the Finpack software for farm businesses (balance sheets, financial analysis, long range budgeting, cash flows, and more).

The AgPlan program is designed to be used by you on line. You simply register by putting in your e-mail address and a password to get in. You create the business plan by filling in the windows on the screen, but there are helpful guidelines for each part. You can add a photo to the front page, change the font or insert tables if that helps tell your story. You can work on it, then log off if needed, and come back to it later to finish it. If you have someone you work with such as a partner, banker, consultant, etc., you can allow them to review your plan, and, if you give them permission, they can help you edit the document. When completed, you can print out a very professional looking business plan. Take a look at AgPlan at: http://agplan.umn.edu/

Chapter 12 Bankruptcy-Hope for Financially Stressed Family Farms

There are probably few words that have a more negative connotation in the farm business world as bankruptcy. Often seen as giving up or quitting, farmers often try to avoid bankruptcy at all costs as they pride themselves on their independence and self-reliance. However, Chapter 12 bankruptcy is not for quitters. In fact, it is designed for those family farms that are willing to keep fighting to keep their farm going despite being severally financially stressed. In this article, which originally appeared in the Buckeye Dairy News, Chapter 12 Bankruptcy is discussed at length.

https://bpb-us-w2.wpmucdn.com/u.osu.edu/dist/9/29991/files/2010/08/chapter12.pdf

Estate Planning Resources on Ohioline

There are two sets of materials available on estate planning on the Ohio State University Extension web site. The first are the newly revised set of twelve (12) Basic Estate Planning Fact Sheets at either http://ohioline.osu.edu/ep-fact/index.html or http://ohioline.osu.edu/lines/comun.html

The second is a more detailed but less recently updated set of material (dated November 2003) called “Estate Planning Considerations for Ohio Families” at http://ohioline.osu.edu/estate/

Other estate planning resources are available as links to Barry Ward’s web page on the OSU Agricultural, Environmental and Developmental Economics Department web site at: http://aede.osu.edu/Programs/FarmManagement/MgtPublications.htm that has the following additional links attached: Estate Planning for Tomorrow (pdf), Estate Planning: Writing Wills in Maryland (pdf), Virginia Cooperative Extension – Estate Planning (html), Farm Transition Planning (HTML). Go to the last web site above to click on these web pages.

Recognizing Stress and Depression

As a high school student I worked on a hog farm operated by a good family who was well respected throughout the community. While in college I learned that my previous employer had fallen into a deep depression, neglected feeding the animals, and considered suicide as a way to cope with the low hog prices and high input costs. Fortunately, the situation was resolved and the family successfully overcame the situation.

The economic climate in the dairy industry today is much like the one this hog farmer experienced. Cases of suicide have been reported on some dairy farms across the country. A session on this very topic was one of the most highly attended at the recent Western Large Herd Dairy Conference. It is no surprise that dairy farm families are being negatively impacted by current market prices. Milk income is significantly lower while expenses have not dropped. This severe financial strain has caused elevated levels of stress for dairy farm families. With the financial stress often comes emotional stress.

There are a number of signs of stress that can be recognized by family, friends, employees, veterinarians, Extension professionals, school personnel, or health and human service workers. These signs include:

Changes in routine – family stops attending church, 4-H/FFA activities, or no longer stops at the coffee shop or feed mill.

Care of livestock declines – animals may not be cared for properly; show signs of neglect.

Increase in illness – may experience more colds, flu, aches, pains, etc.

Increase in farm accidents – stress causes fatigue which may result in increased accidents; children may not be well cared for.

Appearance of farmstead declines – family no longer takes pride in the way buildings and grounds appear.

Children show signs of stress – children may act out, be increasingly absent or show declines in academic performance.

CHRONIC OR PROLONGED STRESS

Individuals or families experiencing prolonged stress may exhibit the following effects:

Physical – headaches, ulcers, backaches, sleep disturbance.

Emotional – sadness, depression, bitterness, anger, anxiety.

Behavioral – irritability, acting out, withdrawal.

Cognitive – memory loss, lack of concentration, inability to make decisions.

Self-Esteem – “I’m a failure.”, “I blew it.”, “Why Can’t I…?”

SIGNS OF DEPRESSION OR SUICIDAL INTENT

Signs of Depression           Signs of Suicidal Intent

Poor appearance                      Anxiety

Unhappy feelings                      Withdrawal

Negative thoughts                     Helpless and hopeless

Reduced activity                       Alcohol/drug abuse

People problems                      Previous suicidal attempts

Physical problems                   Suicidal plan

Guilt/low self esteem               Cries for help

HOW TO REFER A PERSON FOR HELP

If you recognize signs of depression or suicide in a friend or family member, consider the following:

  1. Be aware of the services available in your local community and what they can offer.
  2. Listen for signs the person or family needs help that you can’t provide, i.e., financial, legal, counseling.
  3. Assess what community resources would be most appropriate.
  4. Discuss referral with the person or family, “It sounds/looks like you are feeling __________. I think __________ could help you deal with your situation.”
  5. If the person/family is unwilling to take the initiative or where there is danger if no action is taken, you need to take the initiative.
    1. Call an agency in the community that deals with these issues.
    2. Identify yourself and your relationship with the person or family for whom you are seeking assistance.
    3. Explain to the agency what you believe the person/family needs.
    4. Provide information about the family and particulars of their situation.
    5. Ask the agency what follow-up will be taken.

Many people are reluctant to get involved in these family situations because they are very personal issues. However, it is better to be proactive in getting help for the person/family than watching something tragic happen and wishing you had done something.

Source: Farm and Ranch Family Stress and Depression, A Checklist for Making Referrals, Roger T. Williams, University of Wisconsin-Madison and Robert J. Fetsch, Colorado State University . Available at: http://mtt.cahs.colostate.edu/current_issues/depression

Deadlines Extended for ACRE and SURE

Farmers now have more time to make the decision concerning their farm program choice between the existing DCP and the new ACRE election. The deadline has been extended to August 14, 2009. This extension will allow farmers the opportunity to learn more about the different options, as well as have a more accurate estimate of the state revenue guarantee for corn and beans. The state wheat revenue guarantee will be finalized by this date. Attached to this article is a factsheet created by FSA that provides additional information about the ACRE election.

Although the deadline for making the ACRE election has been extended, farmers should still be studying and thinking about the election implications now. For instance, the 20% reduction in direct payments averages $3.71 per acre here in Ohio, but FSA farms with high corn base acres will be higher while FSA farms with high soybean, oat or barley bases will be substantially lower. Also FSA farms that do not have 100% of the acres in base acres could potentially benefit since payments are based on planted acres not base acres.

Why is this important? Since the ACRE election is based on planted acres instead of base acres, farmers might want to plant the farms that they are considering on enrolling in ACRE to the crop that they believe has the highest probability of receiving an ACRE payment. For instance if corn prices remain strong (above $3.80 average US cash price for 2009 crop year) then an ACRE payment will probably not occur. If on the other hand soybean prices are weak (below $8.75 average US cash price for 2009 crop year) then and ACRE payment is probable. If this is the scenario that one expects then the farms that might be enrolled in ACRE should be planted to soybeans. These prices are for illustrative purposes only and should not be considered accurate. Every farmer should access the ACRE program software at http://www.farmdoc.uiuc.edu/ to determine the numbers for their farm using their own assumptions.

Also farmers need to be aware that to be eligible for SURE (and any potential payments) on the 2008 crops they will need to purchase CAT and NAP on all insurable crops by May 18, 2009. Paying such a buy-in fee does not provide the producer with crop insurance or NAP for the 2008 crop year; it merely permits the producer to become eligible for the 2008-crop disaster assistance programs. Farmers need to access the SURE calculator at http://www.fsa.usda.gov/Internet/FSA_File/sure_calculator.xls and enter their farms information to determine if “buying-in” makes sense for their farming operation. Below are a few factsheets that provide additional information about the programs.

ACRE Program Backgrounder
https://bpb-us-w2.wpmucdn.com/u.osu.edu/dist/9/29991/files/2010/08/acrebkgrd.pdf

ACRE Factsheet
https://bpb-us-w2.wpmucdn.com/u.osu.edu/dist/9/29991/files/2010/08/acre.pdf

SURE Factsheet
https://bpb-us-w2.wpmucdn.com/u.osu.edu/dist/9/29991/files/2010/08/Sure_Factsheet.pdf

DCP Program Factsheet
https://bpb-us-w2.wpmucdn.com/u.osu.edu/dist/9/29991/files/2010/08/dcp2008.pdf

Dairy Critical Issue Briefs (DIBS)

Dairy Critical Issue Briefs (DIBS) address issues facing dairy producers dealing with today’s pitiful milk prices.
Plummeting prices in the dairy industry are creating critical cash-flow and long-term survivability issues on Ohio’s 3,328 dairy farms. Cost-cutting decisions must be made with full awareness of both short and long-term production and economic consequences. OSU Extension’s Dairy Working Group, a collaboration of OSU Extension and OARDC faculty is identifying and addressing critical issues in five areas:

  • Nutrition and feed costs
  • Reproduction and health
  • Calf and heifer management
  • Business issues
  • People and stress management


A series of 27 Issue Briefs (DIBS) targets management issues being addressed on farms now. The Issue Briefs can be found at the http://dairy.osu.edu/DIBS/dibs.html web site. DIBS currently posted include:


DIB#1-09 Can I use more corn silage in my diets to reduce cash feed costs?
DIB#2-09 Is it time for Daisy to go on a truck ride?
DIB#3-09 Will changing from a confinement system to a grazing system reduce my short term costs?
DIB#4-09 How can I lower feed costs in a management intensive grazing system?
DIB#5-09 Should I remove feed additives from my diet to reduce short term costs?
DIB#6-09 Observing signs of stress and depression
DIB#7-09 What happened to our dairy exports?
DIB#8-09 Should I use silage additives this year?
DIB#10-09 Should I wean calves earlier?


The emphasis is on “brief”, with a short explanation of the issue, the conclusion and contact information for the author(s) if you have further questions. As additional DIBS are completed, they are posted to the OSU Resources for Ohio’s Dairy Industry Website.