Throughout Performance Test 1, the team worked on successful implementation of the servo as the primary braking method to stop the vehicle before the gate. The process involved fine tuning the code that instructed the AEV and servo motor placement. Two prototypes were assessed during the testing process that were voted on by the team. During a meeting outside of lab, the team came up with concept ideas and scored them based on stability, safety, weight/size, and cost efficiency. The first design was the default AEV design, and the second was a hybrid of two concept sketches from the team that the team believed would have the best result (concept scoring can be seen on page 12). The two designs that were combined into the final prototype were Geoffrey’s design with emphasis on stability and Colin’s design modeled after a pizza slice. Each prototype was tested during Preliminary R&D and Advanced R&D, but there were no noticeable differences due to wing configuration, so the flat wing style was chosen to allow for greater stability and to reduce the time spent testing each prototype.
Table 1: Performance Test 1 Results

The AEV was absent for the majority of the first lab, so the team was limited to writing the code based on estimations until the AEV’s arrival. The code required a change from earlier experiments due to the differences in the tracks used. The track used previously was flat while the actual track included an incline and decline. This iteration of testing required successful implementation of the servo motor as well as accurate braking. Code was modified to implement a braking mechanism that combined coasting and servo braking. It was estimated that the AEV would need to travel 15.5 feet to stop at the correct location to activate the gate arm.
Upon the AEV’s arrival, the code was uploaded and the trials began. The first trial resulted in the AEV stopping before mounting the incline. The servo brake successfully activated and stopped the AEV from moving further after the motors stopped. Since the AEV is set to brake according to distance traveled and the servo braking is highly effective, motor speed can be incremented with minimal effect on stopping distance. A change was made to the code to run the motors at 30% power instead of 25% and the second trial was completed. This trial had a similar result, so the team implemented another motor speed change. Each motor was changed from 30% to 40% power and the AEV surmounted the incline but stopped short of the target position by 3 feet.
The second day of Performance Test 1 had more hurdles to overcome. The testing period began with a trial that brought the AEV past the desired stopping position. A change was made to the code that changed the angle the servo arm braked at so that a stronger brake would be applied, and the second trial successfully stopped at the target position. A third trial was performed with the same code to test whether the results could be repeated, and the servo motor arm dislodged upon being engaged. When securing the servo arm back to the servo, the team struggled to recreate the way it was attached originally. Once the arm was secured correctly, the angle of the servo had changed, so the braking angle being used in the code was rendered ineffective. To account for the potential of future issues, the team devised a method of starting of setting the servo starting angle and braking angle from a vertical position.
The third day of Performance Test 1 started with three trials that stopped short of the target distance. After the third trial, the team realized that the servo was braking as soon as the motors cut off instead of coasting and then braking. The team debugged the code and corrected the mistake that was preventing the desired braking method.
The team created a method that delays the progression of the code until the AEV reaches a certain mark. To do this, the method needs to know whether the AEV is going forward or backward so that it can continuously test if the current AEV position is either less than or greater than a certain number of marks. When calling the getVehicleDirection() method, the team had used 0 for forward and 1 for backward, which is the opposite of what is stated in the documentation. The group made this decision because at the start of the code, the reverse() method was called because of the way the propellers were attached to the AEV, and so it was thought that 0 would be considered the correct forward and 1 the correct backward. This, however, was not the case, so the AEV was stopping right away instead of waiting until it reached a certain number of marks. Once the switch was made, the code worked fine.
The current code can be seen on page 20 and 21. At this time, the team was required to complete Performance Test 1. The first attempt stopped three feet before the target distance and resumed operation 7 seconds after braking. For the second attempt, the team adjusted the code, but ended with similar results.
Due to the similarity between many trials, only two trials will be analyzed in detail: a successful run and an unsuccessful run. The distance data analysis is continued below.
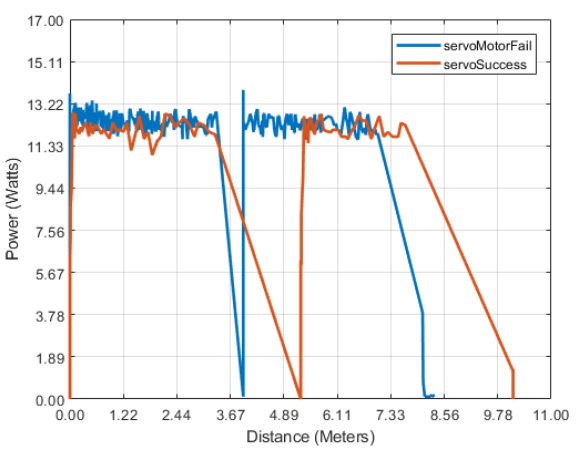
Figure 1: Power vs Distance Graph For Servo Brake Success and Failure
As shown by the combination of the unsuccessful (blue) and the successful (orange) runs on the graph, the AEV stopped over a meter short of the target stopping distance (roughly 5.2 meters). What can also be seen is the sharp stop that was made by the AEV after the power to the motor was cut. The unsuccessful representation shows how the code was modified to the successful code where the AEV stopped at the target location and implemented a gradual stop involving coasting and servo braking. The figure below will analyze the changes made to the motor configuration.

Figure 2: Power vs Time Graph For Servo Brake Success and Failure
Like the Power vs. Distance graph above, the Power vs. Time graph displays a successful and unsuccessful trial. The change of motor speed drastically changed the amount of time the AEV took to complete the course. The time to complete stop at the gate was reduced by 10 seconds.
After completing Performance Test 1, the team moved on to Performance Test 2. The details of Performance Test 2 are described in detail under the experimental methodology section above, but in summary, Performance Test 2 built upon Performance Test 1 and finished with the AEV attaching to a caboose at the end of the track and traveling in the reverse direction. A table that summarizes each trial can be found below:
 Table outlining the results and changes made after each trial.
The first day of Performance Test 2 began similarly to how Performance Test 1 ended. The AEV was unable to accurately brake at the gate. Throughout the first two trials, the AEV did not brake correctly at the gate and the team modified the stopping position according to where the AEV stopped during the previous run. The third trial resulted in the AEV successfully traversing the gate. On the second to last run of the day, the AEV passed through the gate and stopped short of the caboose. The final trial of day 1 resulted in the AEV not making it through the gate.
The braking inconsistencies continued to plague the second day of Performance Test 2. Two tests were completed each resulting in undesired stops at the gate. The team got together to discuss how to fix the consistency issues, and Geoffrey recommended removing the servo completely and switching to a coasting and power braking method. After discussing alternative options, the team team supported Geoffrey’s recommendation and implemented the change. After the servo was removed and the code was updated to implement the new method of braking, one last test was completed and the AEV successfully traversed the gate and attached to the caboose at the end of the track.
The final day of Performance Test 2 started with trials 9 and 10 traversing the gate but stopping too early at the caboose. Trial 11 resulted in the AEV failing to pass the gate even though earlier runs successfully passed it earlier. To test to see if this was an anomaly, trial 12 was completed with no change to the code and resulted in identical results to trial 11. To fix this issue, the power braking levels were reduced for both motors during the next trial, and the result was similar. Trial 13 resulted in identical results to trials 11 and 12. Trial 14 was the actual performance test and the AEV was able to complete it successfully with the AEV stopping slightly past the desired point after attaching to the caboose. To test the consistency, another run was performed afterwards, and the AEV did not make it through the gate.
Before the final performance test, the team needed to address the consistency issue, so they attended Chris’ office hours. Chris discovered that the reflectance sensors were throwing inaccurate values because the screws that hold the reflectance sensors were not flush with the AEV’s arm. After he drilled the proper holes for the screws, the team tested the AEV and was able to complete the final performance test objectives within 40 minutes. Leading up to the Final Performance Test, the team optimized the code to improve performance as well as find deficiencies. The following changes were made to the code:
- Changes were made to the code that commanded the AEV to wait at the gate and at the caboose.
- The speed of each motor was increased to traverse the track faster and stop on time as well as to compensate for the additional weight from the caboose.
The trials are not listed as they were redundant and minor changes were made to improve run consistency and energy and time efficiency. The results of the final run are displayed below:

Figure 3: Power vs Time of Final Run
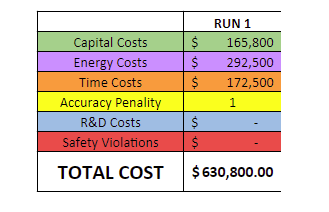
Figure 4: Cost Breakdown
The Final Performance Test took 55 seconds and required 335 Joules of power to complete the course. The total cost of the run was $630,800. Team R had the second most expensive capital cost, the most energy used, and the fifth longest run.