Corn Growth & Development

Today managing your corn crop requires knowledge of the different growth stages of the corn plant.  Growth stage identification is critical for scouting and proper timing of fertilizer and pesticide applications.  Each week throughout the growing season I will discuss the various corn growth stages and management issue at each stage.  This week I will focus on the seed.

The rain continues.  By now most of the corn that is going to be planted is in the ground.  Due to the weather induced extended corn planting season we have corn at various growth stages ranging from just planted to V4.

The Seed

Now that the seed is in the soil, it will begin to absorb water and begin to swell. Corn kernels must absorb about 30% of their weight in water before germination begins.  When enough water has been absorbed and the soil temperature is favorable, germination will occur.

Germination occurs in a specific sequence that is strongly influenced by soil temperature. Therefore, germination and emergence will occur in fewer days when the seed is planted into warmer soils.  Corn typically emerges in 115-120 growing degree days (GDD’s).

(Click on each picture to enlarge)

Fig. 1. Kernel appearance 12 hrs after planting.

The radicle root emerges first, near the tip end of the kernel, within two to three days in warm soils with adequate soil moisture or much longer if soil temperatures hover at or below 50F (10C).  In cooler or drier soils, the radicle root may not emerge until one to two weeks after planting.


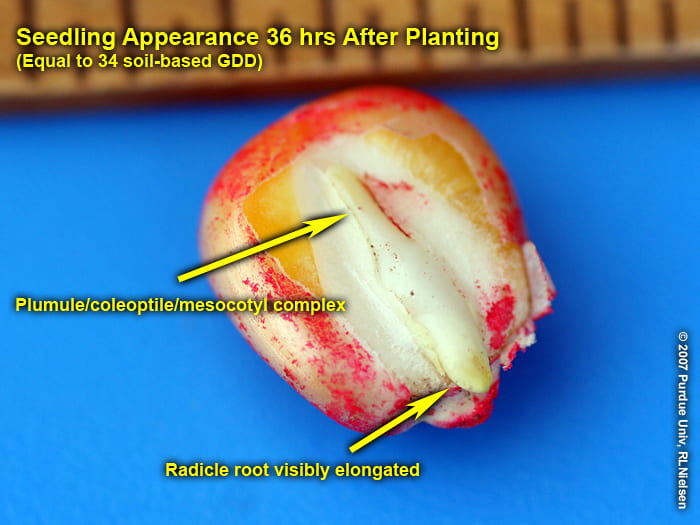
Fig. 2. Seedling appearance 36 hrs (34 GDD) after planting.

The coleoptile (commonly called the “spike”) emerges next from the embryo side of the kernel within one to many days of the appearance of the radicle, depending on soil temperature.  The coleoptile is a rigid piece of plant tissue that completely encloses the four to five embryonic leaves (plumule) that formed during grain development of the seed production year.  The coleoptile initially negotiates its way toward the dent end of the kernel by virtue of the elongation of the mesocotyl. The plumule leaves slowly enlarge and eventually cause the coleoptile to split open as it nears the soil surface.

Fig. 3. Seedling appearance 60 hrs (58 GDD) after planting.

The lateral seminal roots emerge next and initially elongate towards the dent end of the kernel. Even though these roots and the radicle root are technically nodal roots, they are considered part of the seminal (seed) root system and not part of the permanent nodal root system that develops later. The first so-called “permanent” roots begin elongating from the first node at the crown of the seedling at approximately the V1 leaf stage (1 leaf with visible leaf collar) and are clearly visible by V2.

Fig. 4. Seedling appearance 72 hrs (67 GDD) after planting.

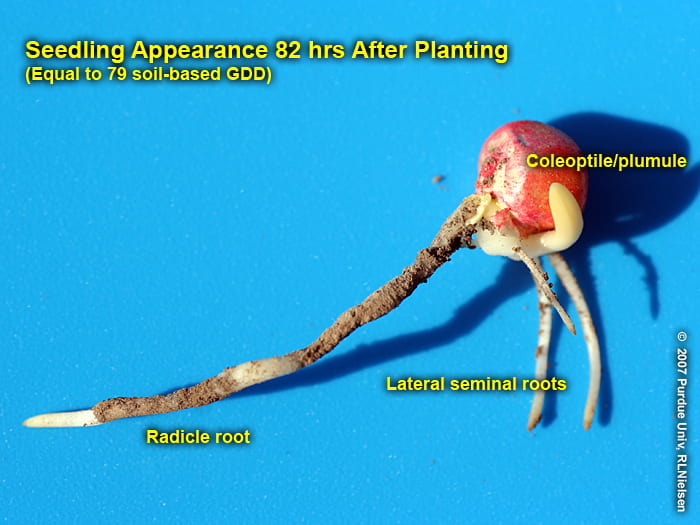
Fig. 5. Seedling appearance 82 hrs (79 GDD) after planting.

Fig. 6. Seedling appearance 105 hrs (103 GDD) after planting.


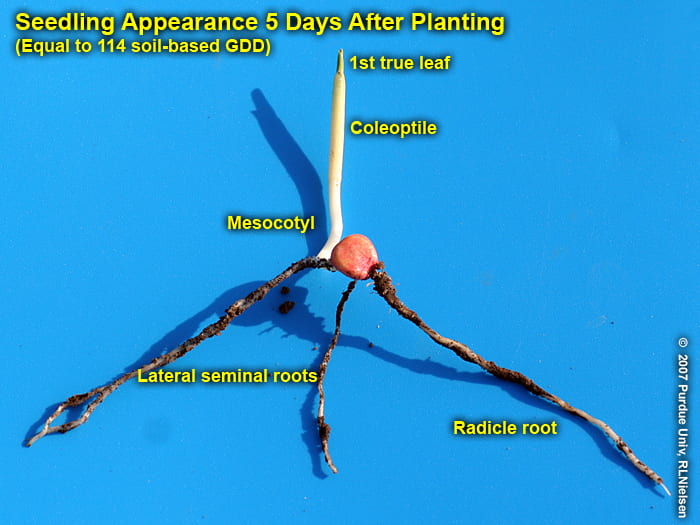
Fig. 7. Seedling emergence 5 days (114 GDD) after planting.

Fig. 8. Seedling emergence 5 days (114 GDD) after planting.


(Adopted from: Visual Indicators of Germination in Corn, Dr. Bob Nielsen, Purdue University)


Ponding and Saturated Soils: Results of Recent Ohio Corn Research

Source: Alexander Lindsey, Peter Thomison

Persistent rains during May and early June have resulted in ponding and saturated soils in many Ohio corn fields and led to questions concerning what impact these conditions will have on corn performance.

The extent to which ponding injures corn is determined by several factors including (1) plant stage of development when ponding occurs, (2) duration of ponding and (3) air/soil temperatures. Corn is affected most by flooding at the early stages of growth (see https://agcrops.osu.edu/newsletter/corn-newsletter/2018-15/young-corn-wet-feet-what-can-we-expect). Under certain conditions, saturated soils can result in yield losses. Saturated soil conditions can result in losses of nitrogen through denitrification and leaching. Additionally, root uptake of nutrients may be seriously reduced even if plants are not killed outright by the oxygen deficiency and the carbon dioxide toxicity that result from saturated soil conditions. Root growth and plant respiration slow down while root permeability to water and nutrient uptake decreases. Impaired nutrient uptake may result in deficiencies of nitrogen and other nutrients during the grain filling stage. Once the corn has reached the late vegetative stages, saturated soil conditions will usually not cause significant damage. Moreover, moderate temperatures should help minimize the level of stress.

Although standing water is evident in fields with compacted areas, ponding has usually been of limited duration (i.e. the water has drained off quickly within a few hours). In Ohio in 2017-2018, we observed a 10% yield loss when corn was flooded at V4 for 2 days and received 120 lbs N pre-plant + 60 lbs N sidedress (applied post-flood). When flooded for 4 or 6 days, yield loss increased to 15 and 33%, respectively, when receiving the same N regime. If the additional 60 lbs N was not side-dressed post-flood, yield losses increased to 30, 50, or 57% for 2, 4, or 6 days of flooding, respectively. According to Dr. Emerson Nafziger at the University of Illinois (http://bulletin.ipm.illinois.edu/?p=1240) “…At the time the crop reaches stage V13 (about head-high), it still has to take up 110 to 120 lb of N, and in years when June is wet, a common question is whether or not the crop might run out of nitrogen, leaving the crop short. While the need for 20 or more lb of N per week would seem to raise the possibility of a shortage, the production of plant-available N from soil organic matter through the process of mineralization is also at its maximum rate in mid-season. For a crop with a good root system growing in a soil with 3 percent organic matter, mineralization at mid-season likely provides at least half the N needed by the crop on a daily basis. This means that normal amounts of fertilizer N, even if there has been some loss, should be adequate to supply the crop.”

If the rain has been paired with strong winds, root lodging may occur. Yield losses of 4, 10, and 15-25% have been reported for 100% root lodging at V10, V13-15, and V17-R1, respectively in Wisconsin. Results from Ohio in 2018 suggest these values may be greater than previously reported (8, 37, and 58% yield loss when root-lodged at V10, V13-14, and VT-R1, respectively).  This trial will be repeated in 2019 in Ohio.

Disease problems that become greater risks due to ponding and cool temperatures include Pythium, corn smut, and crazy top. Fungicide seed treatments will help reduce stand loss, but the duration of protection is limited to about two weeks. The fungus that causes crazy top depends on saturated soil conditions to infect corn seedlings. There is limited hybrid resistance to these diseases and predicting damage from corn smut and crazy top is difficult until later in the growing season. However, the economic impact of these latter two diseases is usually negligible.

More Wet Weather Ahead

Source: Jim Noel

After the wet spring which was forecast, we expected a transition in early/mid-June from the spring pattern to summer pattern with a relaxation of rainfall for a brief period. This appears to be happening. However, it won’t last too long as we expect above normal rainfall to return for the second half of the month.

Over the last week, rainfall has been all over the place. Northern Ohio and far southern Ohio saw above normal rainfall above 1 inch. Central sections and far northwest Ohio saw below normal rainfall below an inch.

For the remainder of June, expect temperatures to be near normal. However, there will be a lot of swings in those temperatures. For the week of June 11-16, temperatures will be slightly below normal. For the week of June 17-23, temperatures will remain slightly below normal. For the last week in June temperatures will likely swing to above normal. With those average temperatures, expect below normal maximum temperatures the next two weeks with above normal minimum temperatures. For the last week of June, both maximum and minimum temperatures will be above normal but plenty of moisture will keep maximum temperatures generally at or below 90.

Rainfall for the week of June 11-16 will average 0.50 to 1.5 inches which are actually close to normal. For the rest of June rainfall will go above normal after this week. For the next 16 days, rainfall will average 2-5 inches which are above the normal of too far from 2 inches. However, confidence is low in rainfall after this week. Weather models are all over the place with the transition to summer. There is the risk of some heavy rain events in late June of 5+ inches. The greatest risk is in northern Ohio for these heavy rain events.

The outlook for June is near or slightly above normal temperatures and above normal rainfall and humidity.

The latest observed 7-day 4-km hi-resolution rainfall estimates can be found here: https://www.weather.gov/images/ohrfc/dynamic/latest7day.jpeg

The latest 16-day rainfall outlook can be found at https://www.weather.gov/images/ohrfc/dynamic/NAEFS16.apcp.mean.total.png

The latest NWS Ohio River Forecast Center river conditions can be found at  https://www.weather.gov/ohrfc/


Ohio Corn, Soybean and Wheat Enterprise Budgets – Projected Returns for 2019

Source: Barry Ward, Leader, Production Business Management & Director, OSU Income Tax School

Production costs for Ohio field crops are forecast to be largely unchanged from last year with slightly higher fertilizer and interest expenses that may increase total costs for some growers. Variable costs for corn in Ohio for 2019 are projected to range from $356 to $451 per acre depending on land productivity. Variable costs for 2019 Ohio soybeans are projected to range from $210 to $230 per acre. Wheat variable expenses for 2019 are projected to range from $178 to $219 per acre.

Returns will likely be low to negative for many producers depending on price movement throughout the rest of the year. Grain prices used as assumptions in the 2019 crop enterprise budgets are $3.60/bushel for corn, $8.20/bushel for soybeans and $4.25/bushel for wheat. Projected returns above variable costs (contribution margin) range from $150 to $308 per acre for corn and $144 to $300 per acre for soybeans. Projected returns above variable costs for wheat range from $102 to $202 per acre (assuming $4.25 per bushel summer cash price).

Return to Land is a measure calculated to assist in land rental and purchase decision making. The measure is calculated by starting with total receipts or revenue from the crop and subtracting all expenses except the land expense. Returns to Land for Ohio corn (Total receipts minus total costs except land cost) are projected to range from $23 to $182 per acre in 2018 depending on land production capabilities. Returns to land for Ohio soybeans are expected to range from $84 to $254 per acre depending on land production capabilities. Returns to land for wheat (not including straw or double-crop returns) are projected to range from negative $2 per acre to a positive $143 per acre.

Total costs projected for trend line corn production in Ohio are estimated to be $753 per acre. This includes all variable costs as well as fixed costs (or overhead if you prefer) including machinery, labor, management and land costs. Fixed machinery costs of $66 per acre include depreciation, interest, insurance and housing. A land charge of $187 per acre is based on data from the Western Ohio Cropland Values and Cash Rents Survey Summary. Labor and management costs combined are calculated at $69 per acre. Returns Above Total Costs for trend line corn production are negative at -$120 per acre.

Total costs projected for trend line soybean production in Ohio are estimated to be $518 per acre. (Fixed machinery costs – $52 per acre, land charge: $187 per acre, labor and management costs combined: $45 per acre.) Returns Above Total Costs for trend line soybean production are also projected to be negative at -$76 per acre.

Total costs projected for trend line wheat production in Ohio are estimated to be $488 per acre. (Fixed machinery costs: $52 per acre, land charge: $187 per acre, labor and management costs combined: $39 per acre.) Returns Above Total Costs for trend line wheat production are also negative at -$137 per acre.

These projections are based on OSU Extension Ohio Crop Enterprise Budgets. Newly updated Enterprise Budgets for 2019 have been completed and posted to the OSU Extension farmoffice website: https://farmoffice.osu.edu/farm-management-tools/farm-budgets

Prevented Planting, 2019 Market Facilitation Program Payments, Disaster Assistance, and Price Dynamics

Source: Schnitkey, G., C. Zulauf, K. Swanson, R. Batts and J. Coppess, Department of Agricultural and Consumer Economics, University of Illinois

We stand at a point of extreme price and policy uncertainty.  In the Midwest, corn planting is historically late and many acres are or soon will be eligible for prevented planting payments on corn crop insurance policies.  On many farms, corn prices have not increased enough to cause net returns from planting corn to exceed net returns from prevented planting.  However, the U.S. Department of Agriculture announced a 2019 Market Facilitation Program (MFP) and has currently indicated that payments will be tied to 2019 planted acres.  The 2019 MFP could provide incentives to plant crops and not take prevented planting payments.  Moreover, this program could bring a little used option into play this year:  take 35% of the corn prevented planting payment and plant soybeans after the late planting period for corn.   Adding confusion to this situation is a disaster assistance program working its way through Congress. We provide detail on the 2019 MFP program based upon what is known at this time, and the Congressional disaster assistance bill.  Then, we evaluate farmer options at this point.  Decisions are difficult.  Corn prices have not risen enough to justify planting corn on many farms.  Yet, corn prices could increase if a large number of prevent planting acres occur.

2019 Market Facilitation Program Payments

In a May 23rd press release, the U.S. Department of Agriculture (USDA) outlined the 2019 Market Facilitation Program (MFP). This program is projected to provide $14.5 billion in direct payments to farmers of specific commodities, $4.9 billion more than the $9.6 billion spent on the 2018 MFP (Schnepf, Monke, Stubbs, and Hopkinson). Important details of this program are:

  • Payments will be based on 2019 planted acres to MFP-covered crops. USDA has initially stated that payments will not be received on prevented planting acres but the final details have yet to be released. By itself, this provision provides incentives to plant crops and not take prevented planting payments.
  • MFP-covered crops in 2019 include corn, soybeans, wheat, alfalfa hay, barley, canola, crambe, dry peas, extra-long staple cotton, flaxseed, lentils, long grain and medium grain rice, mustard seed, dried beans, oats, peanuts, rapeseed, safflower, sesame seed, small and large chickpeas, sorghum, sunflower seed, temperate japonica rice, and upland cotton.
  • There will be a single payment rate for a county. That per acre payment rate will be based on total plantings of the MFP-covered crops on the individual farm. Acres planted to an individual crop will not matter other than its contribution to total planted MFP crops on the farm.  As an example, suppose that MFP rate for a county is $50 per acre. A farm with 60 acres in corn and 40 acres in soybeans will have 100 MFP acres and receive $5,000.  The farm will also receive $5,000 if 40 acres are corn and 60 acres are soybeans.
  • Payments acres in 2019 cannot exceed the payment acres on the farm for the 2018 MFP. This restriction is designed to prevent more acres moving into covered crops, particularly from grasslands or lands typically not farmed. It will most likely be made on a Farm Service Agency (FSA) farm basis. A farm that had 80 MFP-acres in 2018 cannot receive payments on more than 80 acres in 2019.  (see, Perdue Provides More Clarity on Tariff Aid).
  • Payments will be made in three tranches, the first in late July/early August after the July 15th planting reporting date with the Farm Service Agency (FSA), November, and early January.  Whether or not the November and early January payments are made will depend on USDA determination on the need for these payments.

Many important questions remain to be answered regarding 2019 MFP payments; the answers to these questions could affect 2019 planting decisions.   The most important question is:  What are the 2019 per acre payment rates?

Click Here To Read The Entire Article