2014 Kip Fellow Moa Frygell posted this on her personal blog this week. It details how she used tips from Kip trainer Mandy Jenkins to crowd-source and visualize data using a survey, Microsoft Excel and Google Maps.
Last week I tried out a tool that I’ve been familiar with for some time, but that I never really got around to doing. Skellefteå AIK is a northen swedish hockey team that has been very successful this season and last. They won the Swedish championships last year, and they are probably going to do the same this year. They won the last game in the final series 8 goals to 1 against Färjestad. Game 4 out of 7 is to night.
My collegue in Skellefteå, great hockey reporter Robert Tedestedt, did a piece last week on a kid that lives in Stockholm but who is a big Skellefteå AIK-fan. His dream was to interview the players, and Robert let him do that.
This story got me thinking. There must be plenty of Skellefteå AIK-fans all over the world. People that were born in Skellefteå, but that left for one reason or another, or anyone really who is into hockey and likes their play or a player.
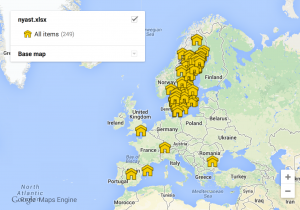
So I created a form that people could fill in details of where they live and what team they support. I shared it on our webpage and in social media. Then I made a map by putting the data from Excel into Google maps. It was really very easy, and fast. The only problem was that too many people wanted to sign up so I lost control over the data collected and published over the weekend. Another problem is that settings in Escenic doesn’t allow us to embed external files. I’m going to talk to Stockholm about that.
Thanks to @mjenkins for inspiring this!

Picked Vulkan Vegas ( https://5vulkanvegas.com/ro ) for the best slots. It seems to be able to win a lot. And you can play in this game club not only for fun, but also to earn money. Already gave all my friends. I recommend to come here!