Aquaculture Food Systems

Right now is fish fry season! For many that observe Lent or live in communities that practice Lenten traditions, the Friday fish fry is a common practice in the 40 days that precede Easter. Growing up I was largely vegetarian/pescatarian (a hard thing to do surrounded by Texas BBQ) so I rejoiced this time of year where fish was plentiful and commonplace on menus. For others in my family this was the only time of year they eat fish. This time often brought up a lot of confusion in which fish to eat, or reservations about how “fishy” it was going to taste.

Fish can be downright confusing. For instance, there exist tradeoffs in nutrition and taste. Many fish are rich in Omega-3 fatty acids (the “good” fat), but this contributes to the “fishy” ocean taste, so more palatable fish have lower levels of omega-3s. There are also a variety of fish categories: wild caught, farmed (aquaculture), and shellfish. Becky Mansfield (2004) observed the debate over organic certifications for fish, and found that many views relate to the way fish elude classification. Her research highlights the ways people draw distinction between soil and water-based agriculture, and the troubles in defining ‘livestock’ or ‘wild’ and outside of producers’ control.

“Fish are different from everything else, but just what makes them different is not clear.” Mansfield, pg. 230

Fish also provide an avenue for examining connections between food production and sustainability goals. Much of the basis for expanding aquaculture is predicated on global fishery collapse. Aquaculture now makes up over half of the relative contribution of fish for human consumption (FAO, 2020). Sustainability is touted as a driver for expanding aquaculture production, however it also remains a point of contention against the industry. Aquaculture growth will increase demand for groundwater, and farm systems present contamination risks due to their large wastewater holdings. Growing fish on land still takes large amounts of marine inputs. Fish oils and protein for feeding raised fish have increased strain on wild stocks of input fish, like sardines and anchovies. Feeding fish alternatives, like plant proteins (ie. corn and soybean) encourage the problem of monocropping in the US and have nutritional compromises in the final fish product.

From a consumer standpoint it is extremely difficult to make purchasing decisions. As Michael Pollan made famous through “Vote with your fork,” food decisions are political and our choices can transform the food system. Julie Guthman (2007) provided a thought provoking account of subjectivities at play in these discourses, specifically in relation to the “epidemic of obesity.” She writes that Pollen and others “see themselves as morally superior to fat people in the sense that they characterize fat people as being short of subjectivity.” The core issue is that these types of food writers push a politics that is to do as they do. In Pollan’s case it is eating as an affluent thin white man.

In this vein I will resist telling you which food decisions to make, as is often the relation between academic “subject” writer and “object” reader needing intervention. Instead, I think talking about food should instead spur creativity and nuance in the ways we identify problems and propose solutions. Sustainability is vague and needs to be more specifically defined in conversations. When promoting “better” outcomes we should be explicit in the people considered in those politics. I want a food system that works for everyone- across race, class, ability, and gender.

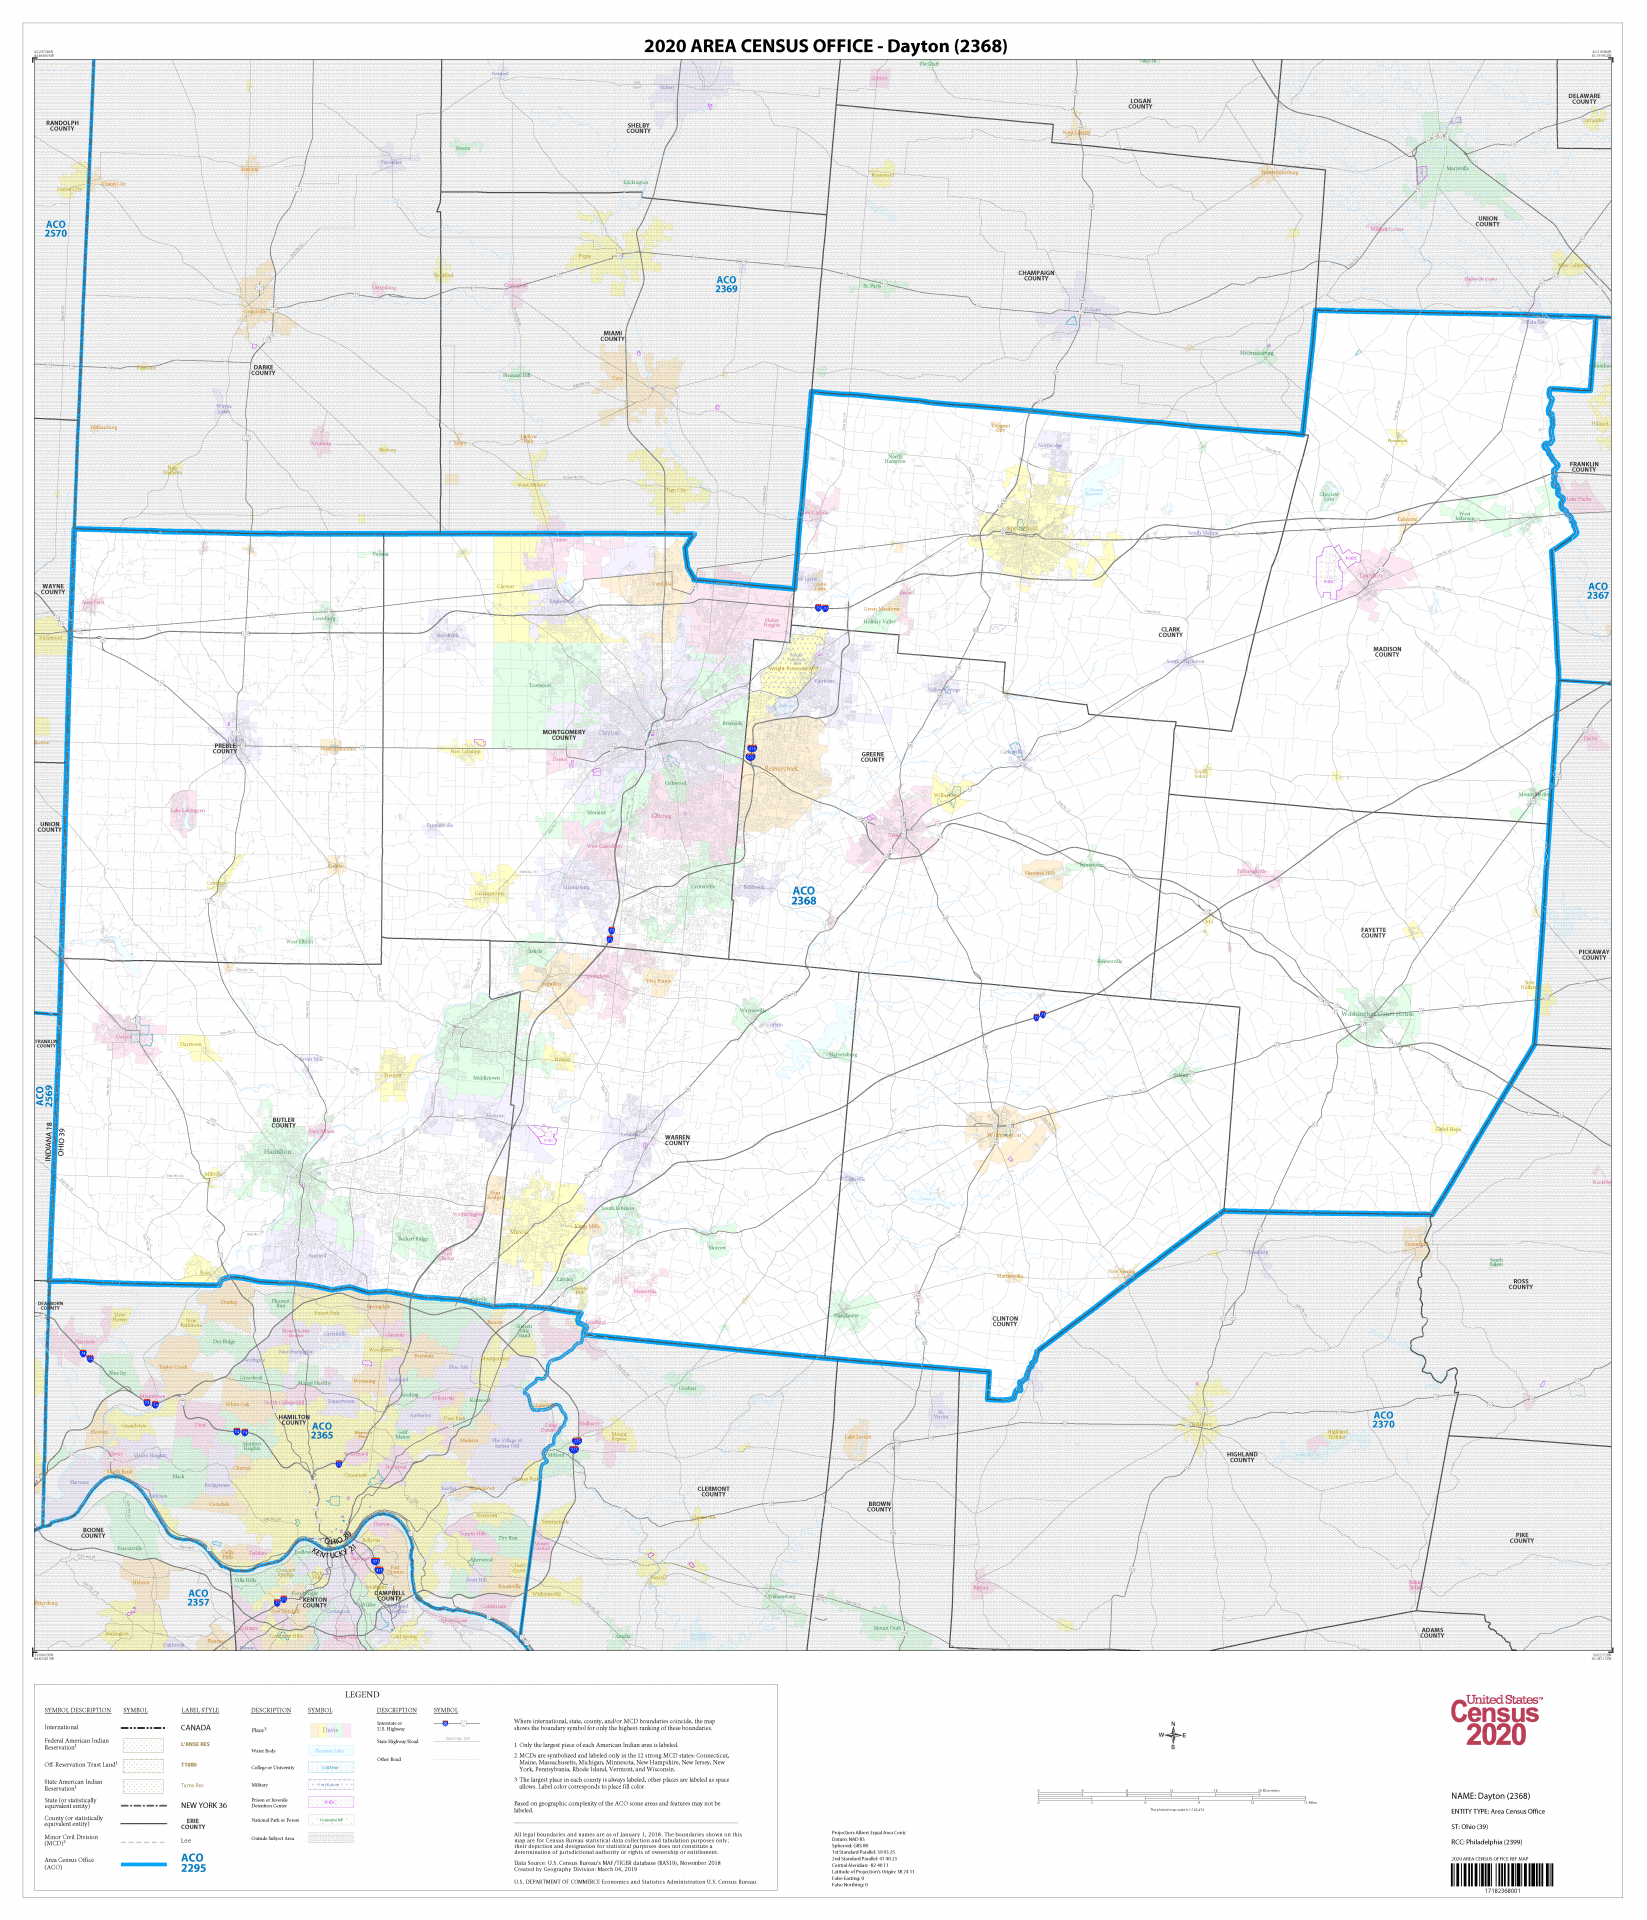
Finally, I will tell you what I have enjoyed in my own exploration into Midwest aquaculture. Fish offerings are much different here than when I grew up in Texas. Redfish isn’t on the menu but Walleye is. I was also surprised to see how many farms there were in the Midwest (see below). You can, in fact, get fresh live shrimp over 800 miles away from an ocean. I plan to continue researching Midwest fish over the next two years. If you have a fish farm- I’d love to stop by!

This image shows the total number of aquaculture farms by state, as reported by the Census of Aquaculture, 2018.

Map of aquaculture farm totals in the “Midwest” region. Data source: https://www.nass.usda.gov/Publications/AgCensus/2017/Online_Resources/Aquaculture/index.php

Rebecca Chapman
Doctoral Student
chapman.751@osu.edu
Pronouns: she/her/hers


References:
FAO. 2020. The State of World Fisheries and Aquaculture 2020. Sustainability in action. Rome.
https://doi.org/10.4060/ca9229en

Guthman, Julie. 2013. “Can’t Stomach It How Michael Pollan Et Al. Made Me Want to Eat Cheetos.” Gastronomica 13(1). https://doi.org/10.1525/gfc.2007.7.3.75

Mansfield, Becky. 2004. “Organic Views of Nature: The Debate Over Organic Certification for Aquatic Animals.” Sociologia Ruralis 44(2). https://doi.org/10.1111/j.1467-9523.2004.00271.x

Pollan, Michael. “Voting With Your Fork” The New York Times “On the Table” Blog, May 7, 2006
https://michaelpollan.com/articles-archive/voting-with-your-fork/


Food system challenges in rural forested communities

There is increasing awareness of food access and availability challenges in so-called food deserts (too little available food) or food swamps (too much low-quality food). One helpful geographical insight from prior research is that as cities expand into surrounding countryside, new retail developments follow, and big grocery stores are often to be found in the suburbs or beyond the city limits, while inner city grocery stores close as wealth and population density decline (Hamidi 2020).

My team has been looking at the complexities of food accessibility at the urban-rural interface, particularly in rural regions with substantial forest cover. While cities have sprawled into surrounding countryside, formerly remote rural areas have been pulled into new relationships with cities, in the form of commuting (Olson and Munroe 2012), or as new “bedroom” communities for city dwellers who want a more rural lifestyle, or as a weekend “getaway” to recreate in nearby forests (Munroe et al. 2017, van Berkel 2014).

Figure 1: Main thoroughfare in Shawnee, Perry County Ohio. Population 319 in 2019. Photo Credit Darla Munroe

In 2017-2018, I interviewed a variety of community key informants in an Appalachian Ohio study area[1], comprising of small towns in Athens, Hocking and Perry counties. Though my central focus was on small town resilience to big employment shocks (Morzillo et al. 2015), the complexities of food in this region were a common theme among respondents. These towns have often surprising mixtures of high poverty, significant forest tourism, and small group business initiatives. Specifically, Athens County, Ohio, is trying to capitalize on new biking trails where weekend cyclists from all over the state come to ride hard and then drink craft beer. Schools are promoting entrepreneurship, encouraging students to create sustainable livelihood strategies for themselves via food trucks, farm-to-table programs or other such small-scale ventures.

At the same time, grocery options in small towns can be limited. Many communities do not have a dedicated grocery store, and they must rely on what’s obtainable at the convenience store if driving to the Kroger in the next town over is not an option. Public transportation is particularly limited in Appalachian Ohio; the rural poor often locate in places where walking to a post office to collect benefits is possible, and thus are limited to whatever food options might be available in these village centers. Within the state or even larger region, if you are laid off from your job, you might move to a town where you have a family connection, however distant. These areas offer a rural quality of life, and a low cost of living, which appeals to rich and poor alike.

Figure 2: Downtown Glouster in Athens County Ohio. Population 1896 in 2019. Photo Credit Darla Munroe

As a geographer, it is hard to see small towns reorienting their economic development strategies to cater to (relatively) wealthy tourists while locals are dependent on whatever the local dollar store might carry. At the same time, I marvel in the complexity of these urban-rural spaces (Irwin et al 2009) that defy easy categorization and rather call for much deeper collaboration and engagement. For those students in the 6th grade onward who are being taught that their economic futures are, at least in part, in their own hands and subject to their own imaginations, I can’t wait to see what this landscape might yield in decades to come.

Darla Munroe

Professor and Chair

Department of Geography, The Ohio State University


References

Hamidi, S. (2020). Urban sprawl and the emergence of food deserts in the USA. Urban Studies57(8), 1660-1675.

Irwin, E. G., Bell, K. P., Bockstael, N. E., Newburn, D. A., Partridge, M. D., & Wu, J. (2009). The economics of urban-rural space. Annu. Rev. Resour. Econ.1(1), 435-459.

Morzillo, A. T., Colocousis, C. R., Munroe, D. K., Bell, K. P., Martinuzzi, S., Van Berkel, D. B., … & McGill, B. (2015). “Communities in the middle”: Interactions between drivers of change and place-based characteristics in rural forest-based communities. Journal of Rural Studies42, 79-90.

Munroe, D., Gallemore, C. & Van Berkel, D. (2017). Hot Tub Cabin Rentals and Forest Tourism in Hocking County, Ohio. Revue économique, 3(3), 491-510. https://doi.org/10.3917/reco.683.0491

Olson, J. L., & Munroe, D. K. (2012). Natural amenities and rural development in new urban‐rural spaces. Regional Science Policy & Practice4(4), 355-371.

Van Berkel, D. B., Munroe, D. K., & Gallemore, C. (2014). Spatial analysis of land suitability, hot-tub cabins and forest tourism in Appalachian Ohio. Applied Geography54, 139-148.


[1] This research was funded by USDA NIFA Award #2016-6701925177, Biodiversity, ecosystem services, and the socioeconomic sustainability of rural forest-based communities, 2016-2021


The Food Environment Doesn’t Impact Your Health…Unless You Use It

A lot of public attention has focused on so-called “food deserts.” These are food environments that lack low-priced healthy food options, and are often identified as areas that lack a full-service supermarket. (See Figure 1 for a map of Ohio.)

I have argued elsewhere that I prefer not to use the popularized terms of “food deserts” or “food swamps.” Food deserts suggest a lack of food, when these locations, particularly urban locations, often have a plethora of unhealthy food. Further, the terms “desert” and “swamps” are not asset-based approaches to characterizing community members’ residential locations.

Poor food environments are disproportionately found in poor urban and rural communities and communities of color. These communities are also associated with relatively higher levels of poor mental and physical health outcomes, such as greater levels of stress, diet-related disease, and insecurity [1-4].

Figure 1. USDA’s Low income, Low Access Census Tracts (previously termed “food deserts”) [7]

While an increasing amount of public funds at the federal, state and local level aim to improve food environments with the hopes of improving diet, many researchers have dismissed any significant relationship between the food environments and diet. There are two reasons for the lack of consistent and significant findings: (1) the way people go about measuring the food environment, and (2) people do leave poor food environments for better ones, particularly if they have a car, enough time and money, and feel safe (e.g., not going to face personal racism)[5].

A recent study lead by my advisee and PhD candidate, Alannah Glickman, and co-authored by myself and Darcy Freedman, addressed these issues by studying how people use their immediate food environment, rather than assuming everyone uses the space in the same way [5].  This gets to a fundamental way in which to conceptualize space [6]: as absolute – envision two convenience stores and one grocery store in a neighborhood; as relative – think about the position of the household relative to stores and the distance households travel; and as relational – how do households use the stores in their neighborhood. Nearly all research focuses on the second approach; we focus on the third.

Using a novel approach applied to two Ohio neighborhoods (Figure 2), we found that there is a significant relationship between the food environment and diet if people shop in their immediate, poor food environments. For people who do more than 50% of their shopping within their poor food environments, we found, all else equal, an eight point decrease in their healthy eating index (which is measured on a 100-pt. scale; the average American’s score is 58.7).

Figure 2. These are two images of the food environment taken in our study areas – Columbus, Ohio (left) and Cleveland, Ohio (right) [Google maps]

In my position now as an associate professor in the John Glenn College of Public Affairs, I ask questions, such as: is there a public purpose to intervene in the food environment? However, to understand the complexities of the food environment, I returned to my training in geography!


Jill Clark, Associate Professor

John Glenn College of Public Affairs


References Cited

  1. Walker, R.E., C.R. Keane, and J.G. Burke, Disparities and access to healthy food in the United States: A review of food deserts literature. Health & Place, 2010. 16(5): p. 876-884.
  2. Caspi, C.E., et al., The local food environment and diet: a systematic review. Health & place, 2012. 18(5): p. 1172-1187.
  3. Clifton, K.J., Mobility Strategies and Food Shopping for Low-Income Families A Case Study. Journal of Planning Education and Research, 2004. 23(4): p. 402-413.
  4. Ver Ploeg, M., Access to affordable and nutritious food: updated estimates of distance to supermarkets using 2010 data. 2012: United States Department of Agriculture, Economic Research Service.
  5. Glickman, A., J.K. Clark, and D. Freedman, Residential Proximity to Low-Quality Food Retailers and Diet Behavior: Exploring the Micro Food Environment within Low-Income Neighborhoods, in Association of Public Policy Analysis and Management. 2020: Virtual.
  6. Harvey, D., Social Justice and the City 1973, London: Edward Arnold
  7. USDA. Food Access Research Atlas. 2020 [cited 2021 February 22]; Available from: https://www.ers.usda.gov/data-products/food-access-research-atlas/go-to-the-atlas/.


Map Production to Support 2020 Census Programs and Operations

Maps have always played a significant role in conducting a census. This post discusses map production within the Geography Division of the U.S. Census Bureau to support the 2020 Census.

Although most of the field operations for the 2020 Census were conducted on digital instruments rather than paper, there is still a need for paper maps to support many operations. For instance, staff in the area census offices (ACOs) use large-format paper maps to help understand and visualize the boundaries of the collection geographic areas within their ACO or to visualize the workload for a particular operation. Other operations, such as Remote Alaska, Update Enumerate, and the Island Areas Census, are conducted entirely on paper. In these cases, staff use small-format maps to locate their workloads and annotate updates in the field.

In order to provide the number of maps required for geographic programs and field operations under strict production timelines, the Census Bureau utilizes the Census Automated Map Production System (CAMPS). CAMPS is automated mapping software that runs in a batch environment. CAMPS was developed in the lead up to the 2010 Census and continues to be a major part of production mapping. Cartographers design maps by setting up project parameter tables that describe everything from the title that will appear on a map to the appearance of labels and features for each feature class that will appear on a map. During peak operations, CAMPS creates thousands of map sheets per hour. For example, for the Local Update of Census Addresses Operation (LUCA), CAMPS created more than 800,000 unique map sheets over an 11 day period!

Largely due to the digital nature of many 2020 Census operations, most operations requested that we create large-format maps on as few sheets as possible, preferably a single sheet for each mapping entity. This presented some design challenges as CAMPS traditionally scales maps to as many sheets as needed based on the density of a particular geographic type within the subject area. Due to the large variety of the sizes of the subject areas for some map types, we designed multiple scale-dependent parameter configurations for each map type. Figure 1 shows a map of the Dayton ACO. This map was created in CAMPS and identifies the boundaries of the ACO. This map type included maps with scales as small as 1:1,000,000 and as large as 1:11,000 for the ACOs in the contiguous U.S.

Although we created the vast majority of our 2020 Census field maps in CAMPS, we also used commercial mapping software to produce maps, using manual interactive design and scripting. We designed map document templates in the commercial mapping software and developed scripts to automate the creation of the maps. For the Island Areas Census, we created approximately 5,600 basic collection unit (BCU)-based maps with imagery. Figure 2 shows an example of one of these maps in Guam, which was used in the field along with additional small-format maps to conduct the Island Areas Census.

Web maps and web map applications have also become a large part of our work for the 2020 Census. Web maps are particularly valuable for the communication of 2020 Census concepts to the general public and our partners. We developed web map applications to aid in outreach efforts in hard-to-count communities with the Response Outreach Area Mapper and to indicate how the Census Bureau planned to conduct the census with the Type of Enumeration Area Viewer, the In-Field Address Canvassing Viewer, and the Mail Contact Strategies Viewer. We were able to communicate with the public about the participation of local partners in programs such as LUCA, the Participant Statistical Areas Program, and the New Construction Program. In addition, we found the web map applications to be useful for the internal tracking of the status and progress of programs.

We are currently planning and developing maps and cartographic products for the next phase of the 2020 Census: data dissemination.

Kevin Hawley is an OSU alumnus and chief of the Cartographic Products and Services Branch in the Geography Branch at the U.S. Census Bureau. Any views expressed are those of author and not necessarily those of the U.S. Census Bureau.


You can see more of Kevin Hawley’s important work and its basis in Geography below.

Fieldwork in a 250 sq ft Studio

One of the sampling methods commonly used in fieldwork is the snowballing technique. The method is to recruit the next research participants by asking current participants to help researchers in identifying potential participants, which is a kind of referral system. I took advantage of the method in my preliminary fieldwork last year. My generous interviewees gladly introduced me to someone they knew and sometimes took me directly if it was not far away from their places. Yet, COVID-19 changed everything.

The goal of my fieldwork this summer was to compare the two largest strawberry production regions in South Korea. I was supposed to participate in farm conferences and local education programs to recruit farmers for interviews and then apply the snowballing technique. However, most of those gatherings were canceled due to the virus. Even if there were meetings, they were held behind closed doors. I had no choice but to conduct “un-immersive fieldwork,” relying on cold calling from my rented studio in Seoul.

Three strategies that got me through this challenge were calling organizations’ representatives, virtual snowballing, and random calls.

Calling organizations’ representatives: There are several farmers’ organizations in the Korean strawberry sector (i.e., cooperatives, agricultural corporations, and strawberry research groups). The contact information for the organizations’ representatives is often posted on the government’s website, making it easy to make contact. Also, the representatives are usually more likely to be extroverted. If things went well, an interviewee was interviewed by phone while they were driving long distances, enabling in-depth interviews to take place over one to two hours. In the worst-case scenario, however, the interviewee was not able to answer questions properly, because they were on their way to visit a hospital or bank. One-third of the potential interviewees declined to be interviewed, refusing in the same manner as they would with spam calls. They said, “I don’t do such a thing. Sorry.”

Virtual snowballing: At the end of every telephone interview, I asked interviewees to introduce me to another close farmer. They were a little reluctant to introduce another farmer than I expected, and said, “Other farmers will say the same anyway.” This was in contrast to the welcome introduction of the surrounding farmers during the in-person visits last year. Meanwhile, experts (researchers, technicians, etc.) and government officials whom I met in person last year gladly introduced farmers they knew this year. I guess people become willing to introduce me to other people when they are sure that an interviewer is reliable and the introduction will not harm their reputations.

Random calls: I tried random calls to various farmers through a Google search. Usually, farmers who left their contact information on the Internet were selling agricultural machinery and fertilizers or running pick-your-own strawberry farms in addition to farming, and most of them willingly accepted the interview request. They answered my questions as comfortably as they treated their customers. I also posted a promotional post on the web communities for strawberry farmers, hoping to coax the farmers to call me. Despite the offer of compensation, only a small number of farmers contacted me. Interestingly, they had something in common in that they felt sorry for Ph.D. students because they or their children had graduate school experience.

In the COVID-19 era, while many people are getting used to new technologies such as Zoom, there remain difficulties in applying these technologies to fieldwork. The use of video calls or online messaging platforms was almost impossible, especially since farmers are of high average age and are usually conservative. Nevertheless, there must be huge room for improvement: a more friendly way of phone calls, writing an attractive promotional post, and many more creative methods. We keep learning how to adapt to uncertainties by doing everything in the virtual field.

As mentioned, there is always room for improvement, and I welcome new ideas. Please feel free to contact me if you have any suggestion for my virtual fieldwork!


Sohyun Park, PhD Candidate

Department of Geography

The Ohio State University

Have We Gone Too Far to Come Back?

As geographers and atmospheric scientists, we are keenly aware of the reciprocal and interdependent relationships among human societies and the earth system. Popular understandings of natural disasters such as the recent acceleration of burning in the Amazon [1] and the Australian bush fires arguably overemphasize social drivers, and recent changes, that are political (Brazil) and individual (Australia). What we as a community can contribute is the push to think more systematically, structurally, and historically: how have climate changes over the last 50 years contributed to recent crises? And, given the long-term, dynamically interacting social and environmental systems, what are the prospects for resilience?

Australia, for several months, has been experiencing bush fires on an epic scale. There is a great deal of talk about homes lost, people dead, and smoke clogging the air. However, there are other immediate and long lasting implications to our actions.

The fires have devastated Australia with 30 people dead (including four firefighters), roughly 38,594 square miles of bush, forest and parks across Australia burned [2]. In addition to the landscape change, countless animals have perished and as the smoke clears, we may discover that some of the endangered species inhabiting those regions may very well be extinct.

Our planet, however, has some resiliency. Below are examples of life emerging from the fires as nature attempts to rebound through the flames.

This is heartening, however, bush fires don’t only damage our landscape but they can create dangerous weather patterns to worsen existing fire burning patterns. This can cause unpredictability in the way the fire behaves and endanger those fighting the fire [3].

The fires are still burning and will continue to cause damage. The toll may not be known until long after fires have been extinguished. As Geographers and Atmospheric Scientists, the complexity of how these fires affect our planet, our research, and out understanding of climate change, are both exciting and terrifying. Our planet is resilient, but is it resilient enough to survive human beings? Have we gone too far to come back?


[1] –https://www.usatoday.com/story/news/nation/2019/10/18/amazon-rainforest-still-burning-more-fires-future/4011238002/

[2] – https://www.bbc.com/news/world-australia-50951043

[3] – http://media.bom.gov.au/social/blog/1618/when-bushfires-make-their-own-weather/