Worsening Drought Conditions Across Southern Ohio
Author: Aaron Wilson
This article was originally posted in the Fruit, Vegetable, & Specialty Crop Newsletter. To view the original article, click HERE.
Summary
As I write this article on Monday afternoon, showers and a few embedded storms are rolling across the Buckeye State. However, for southern and southeastern Ohio, this has largely not been the case for the last several weeks. Precipitation over the past 30-to-60-days is running 25-75% of normal, with some parts of Pickaway, Ross, Noble, Morgan, Washington, Monroe, and Belmont Counties receiving less than 2 inches over this period (Figure 1). As a result, the latest US Drought Monitor depicts about 8% of Ohio in D2-Severe Drought and abnormally dry conditions or worse being felt by approximately 70% of the state. This has led to notable crop stress on drier ground, deep cracks in the ground from the lack of soil moisture, poor pasture conditions, and short-cuttings of hay. Producers are encouraged to provide observations from their locations by submitting a Condition Monitoring Observer Report (go.osu.edu/drought_cmor). For more information and resources, please visit our Drought Conditions and Resources Knowledge Exchange page or visit the State Climate Office of Ohio.

Weather Forecast
Scattered showers and storms are possible on Tuesday through Thursday this week, before high pressure and drier air moves in for the weekend. However, widespread heavy rain is not expected. The Weather Prediction Center is currently forecasting 0.01-0.50” for the state over the next 7 days (Figure 2), though locally heavier amounts are possible. Temperatures will generally rise into the low to mid 80s each day with overnight lows in the 60s, about average for mid to late July.

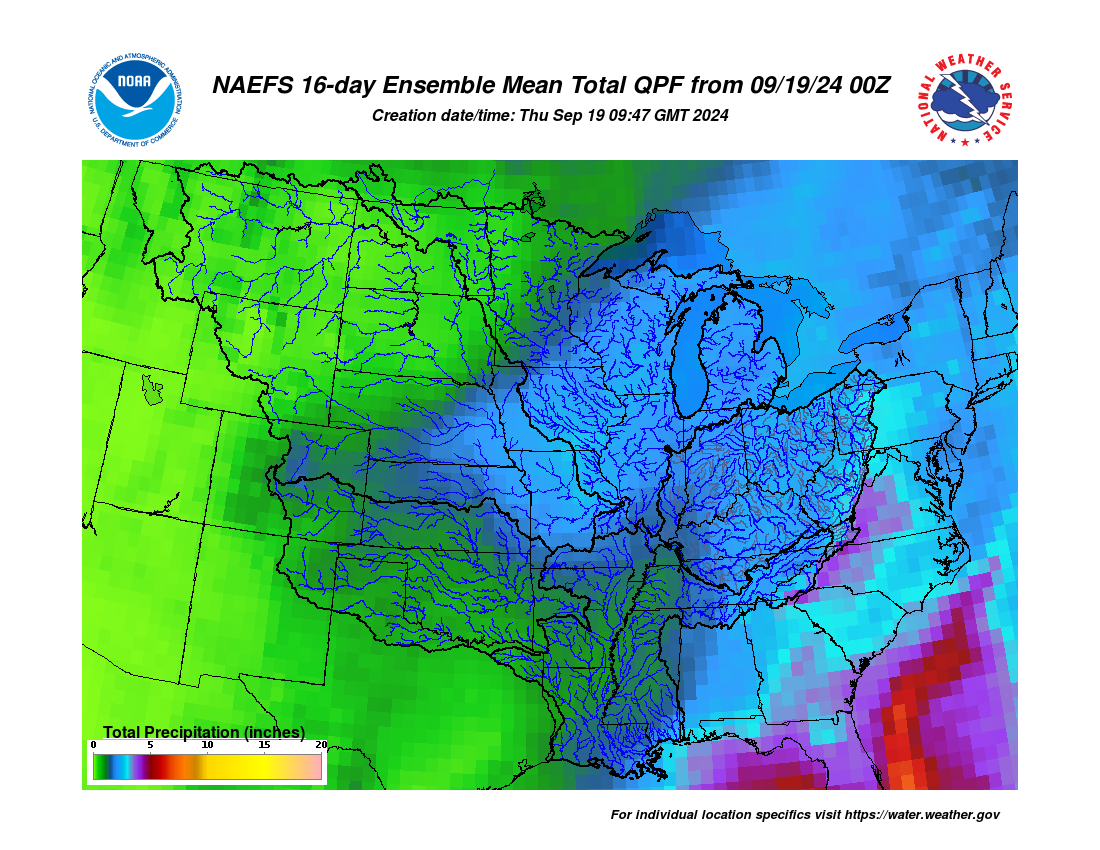
The 8-14 day outlook from the Climate Prediction Center and the 16-Day Rainfall Outlook from NOAA/NWS/Ohio River Forecast Center show temperatures are likely to be above average with precipitation probability leaning toward wetter than average (Figure 3). Climate averages include a high-temperature range of 83-86°F, a low-temperature range of 60-66°F, and weekly total precipitation of 0.90-1.20”.
