- Propeller Configuration Deliverables
- Include figures that show each different propeller configuration (Done below)
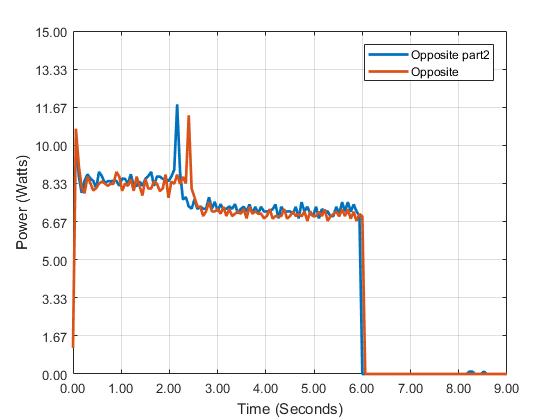
- Include Power vs. Time and Power vs. Distance plots
Power vs. Time

Power vs. Distance


- Quantitatively explain why the propeller configuration your team selected through testing is the best for your AEV to continue with.
-The pulling configuration was the most energy efficient while still traveling the same distance. To travel 50 marks, the pulling (tractor) configuration only used ~ 8 Watts, while pushing used ~ 9 Watts and the mix of one each used ~ 8.33 Watts. We are hoping to have the most energy efficient AEV while still getting the job done reasonably.
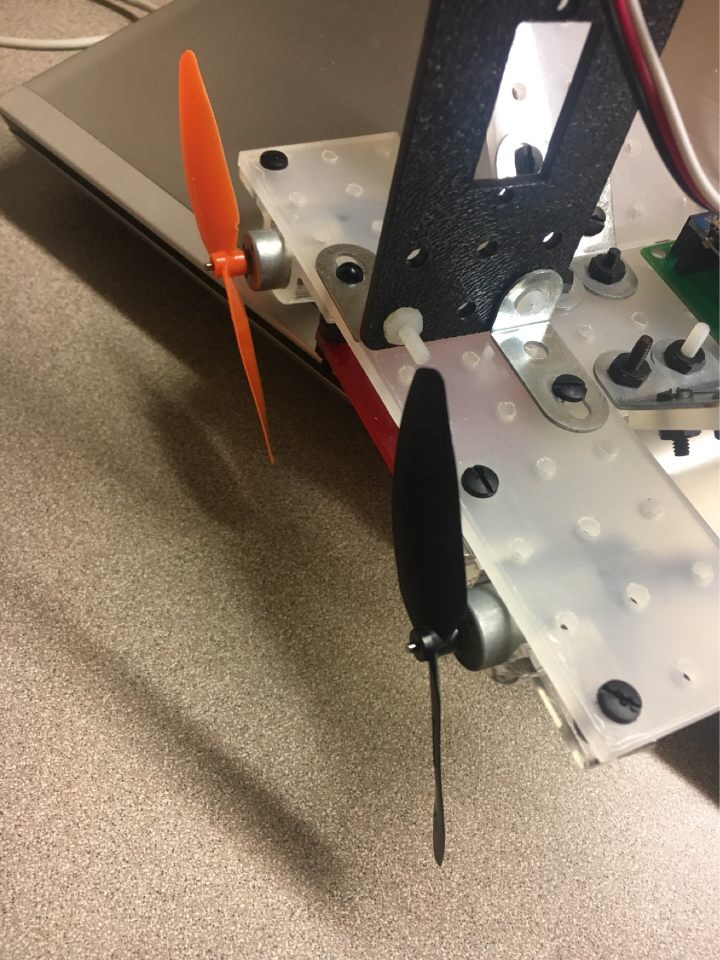
- Include figures that show each different propeller configuration.
Opposite, Both push, Both pull


- Explain takeaways from the lab, including which propeller configuration is best.
-The pulling configuration was the most energy efficient while still traveling the same distance. To travel 50 marks, the pulling (tractor) configuration only used ~ 8 Watts, while pushing used ~ 9 Watts and the mix of one each used ~ 8.33 Watts. We are hoping to have the most energy efficient AEV while still getting the job done reasonably. A main takeaway however was that the differences in efficiency were very slight and therefore if there was another effect by the propellers in another area that required a different configuration for best quality, it would not be detrimental to use any of our three configurations.
- Caboose Testing Deliverables
Progress Report Questions
- Include Power vs. Time and Power vs. Distance plots (Done Below)
- Explain the difference and effects of having a caboose.
-The same code was used for both tests and the same propeller configuration, so the energy required was approximately the same. However, the additional weight of the caboose caused it to take a longer period of time to get to the same destination.
-
Website Deliverables
- Include Power vs. Time and Power vs. Distance plots
Power vs. Time


Power vs. Distance

-
- Explain takeaways from the lab, including how the caboose affects the AEV run.
-When the Caboose is added during the run, the AEV will take much longer to run the same distance. This will help prepare us for future runs because now we know that we cannot just run the code for a period of time if we will later add a caboose. Instead, we will need to run the code to a specific location.