
This graph shows the distance vs the power of the two different motor configurations. From of a basic observation, it is hard to distinguish a clear design that is more efficient than the other. It seems that the second configuration had a small bit of an advantage because of the initial start up of the graph.
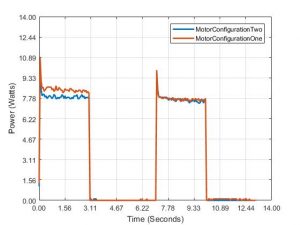
The Power VS Time graph is similar to the first one as there is no clearly efficient design. The first configuration shows more power usage than the second configuration in the initial three seconds. In result, it seems that the second a slight advantage.
Based on the results, the team decided to go with the second configuration. It seemed to give a slight advantage over the first configuration.
MOTOR CONFIGURATION LAB Arduino Code:
reverse(1);
motorSpeed(4,30);
goFor(4);
brake(4);
goFor(4);
// Brake motor one.
brake(1);
Reference
OSU Carmen, LM_PreliminaryR&D_18AUG2017.pdf,
https://osu.app.box.com/s/ter1ysxfl88vej3wezqleed30cymth1p